

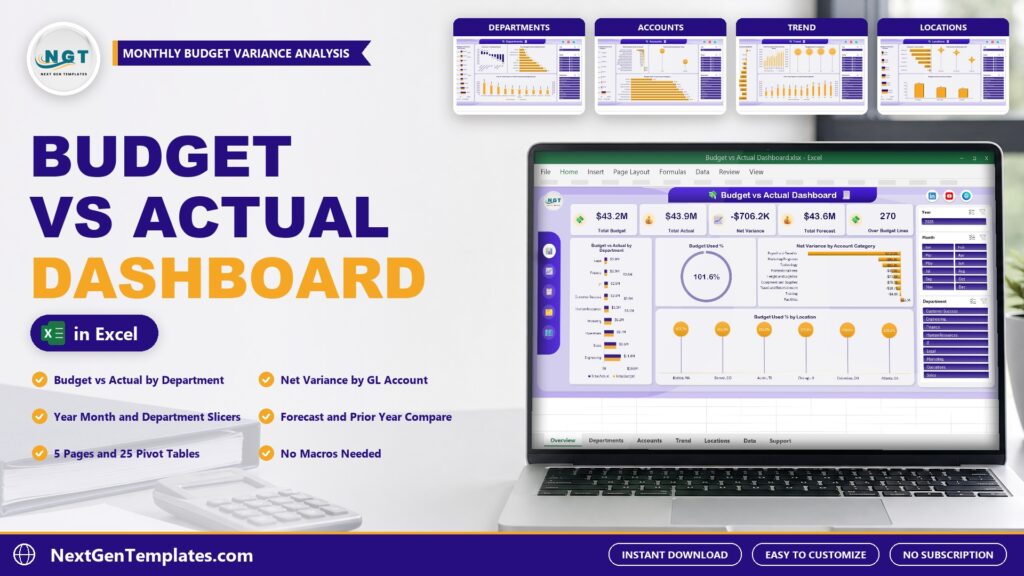
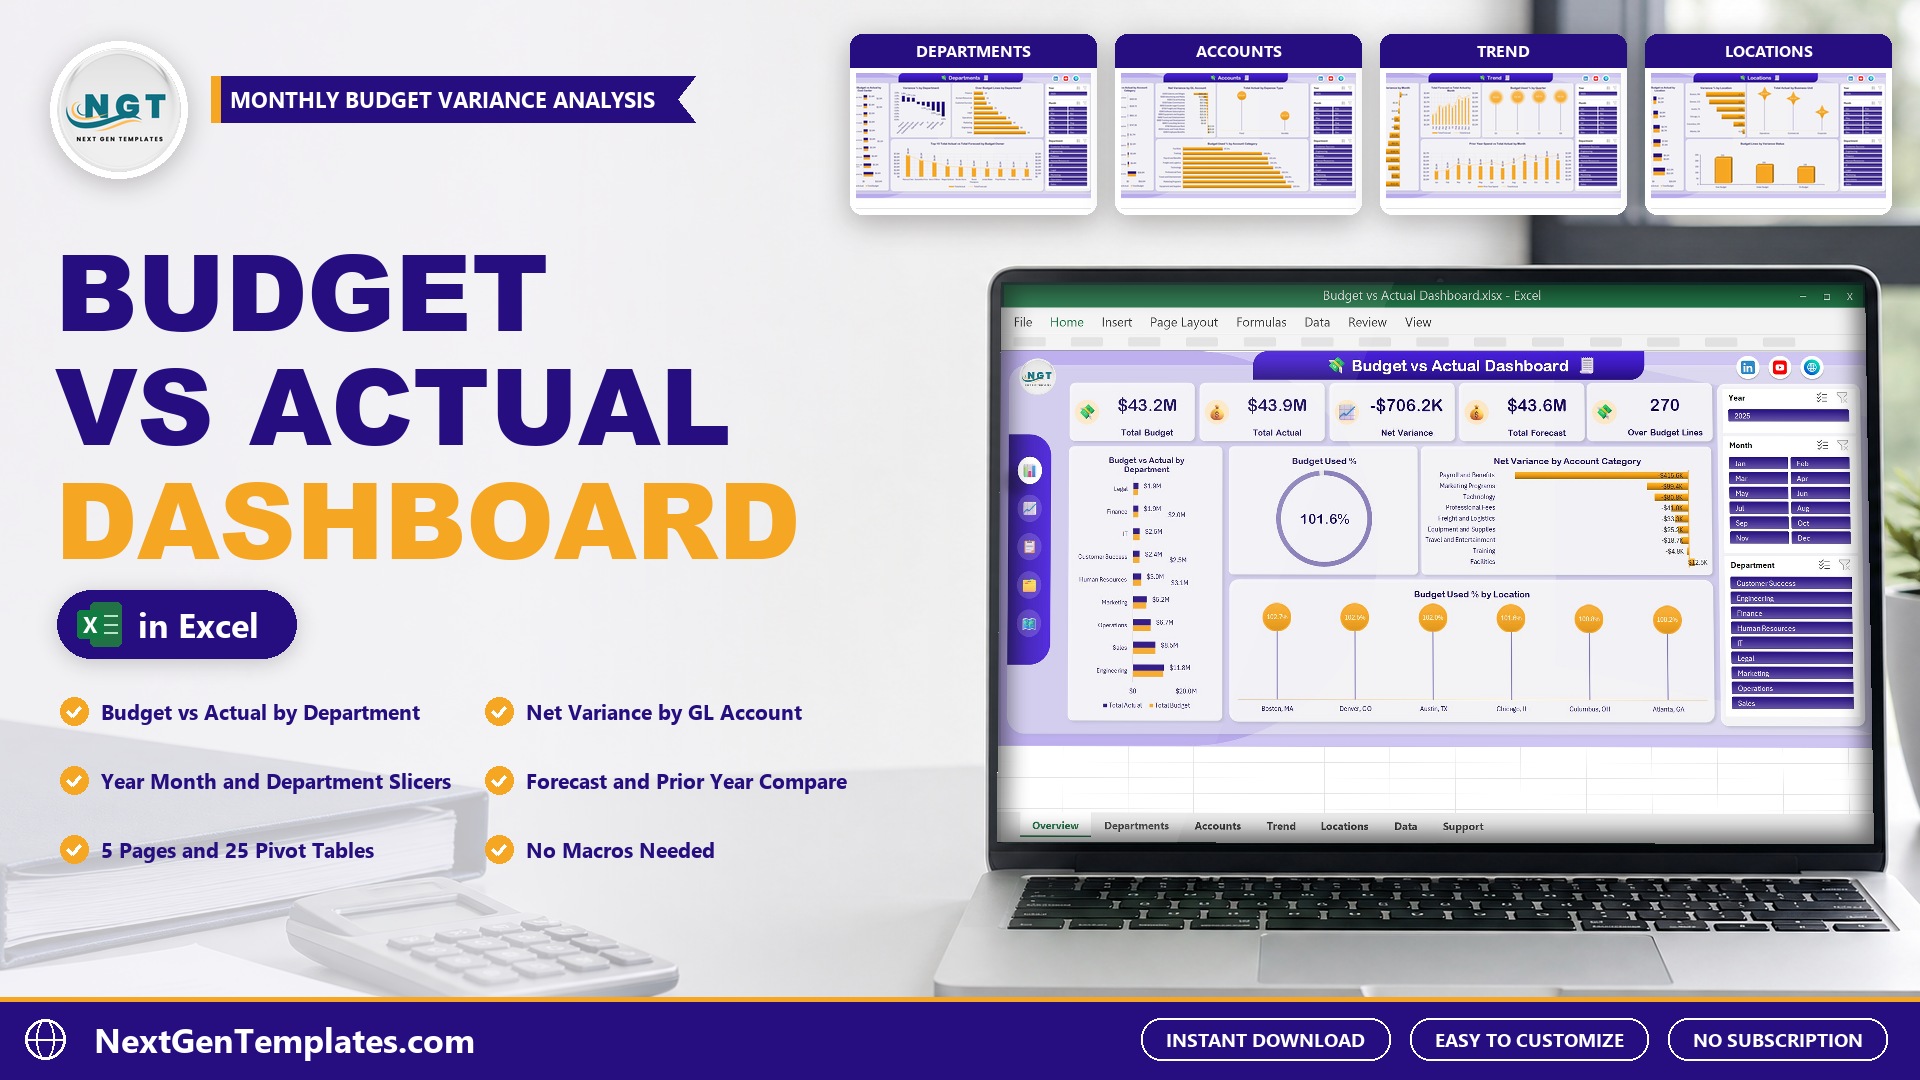
Overspending hides inside long budget lists. The Budget vs Actual Dashboard in Excel puts budget, actual, forecast and variance for every department, account and office on one clickable screen.
Watch the Budget vs Actual Dashboard in Excel: Variance, Forecast and Budget Used % walkthrough
 Launch offer
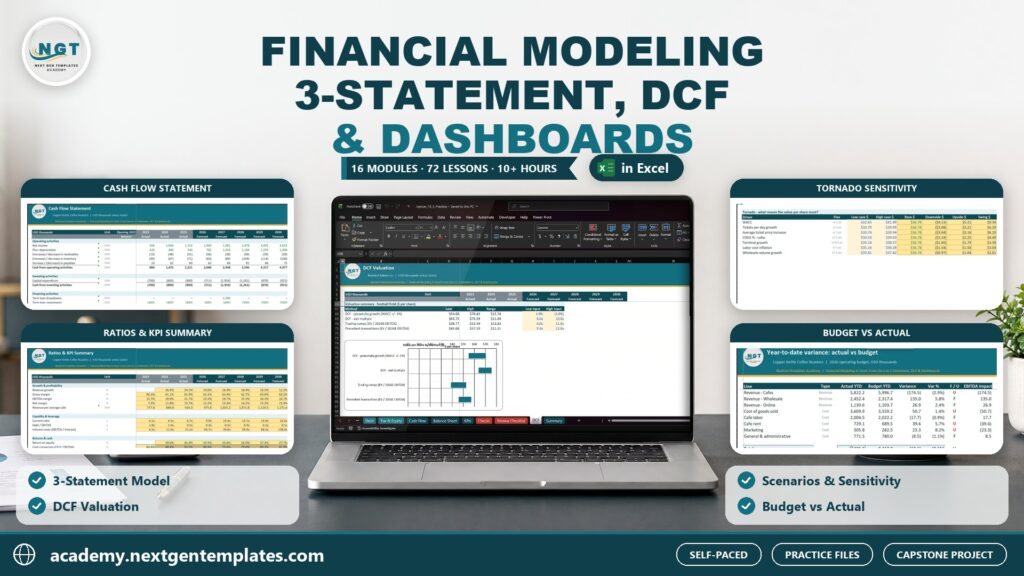
Build a linked three-statement model, a DCF valuation, scenarios and budget vs actual, plus a Power BI finance dashboard. 10h 27m of video by PK, with practice and solution files for every lesson.
What Is a Budget vs Actual Dashboard?
A budget vs actual dashboard compares what you planned to spend with what you actually spent, and shows where each department, account and office is running over or under. This one is an Excel workbook with five pages. You keep your budget lines on a Data tab, click Refresh All, and the pivot tables behind the charts update the Overview, Departments, Accounts, Trend and Locations pages.
Inside the Dashboard
Overview Page
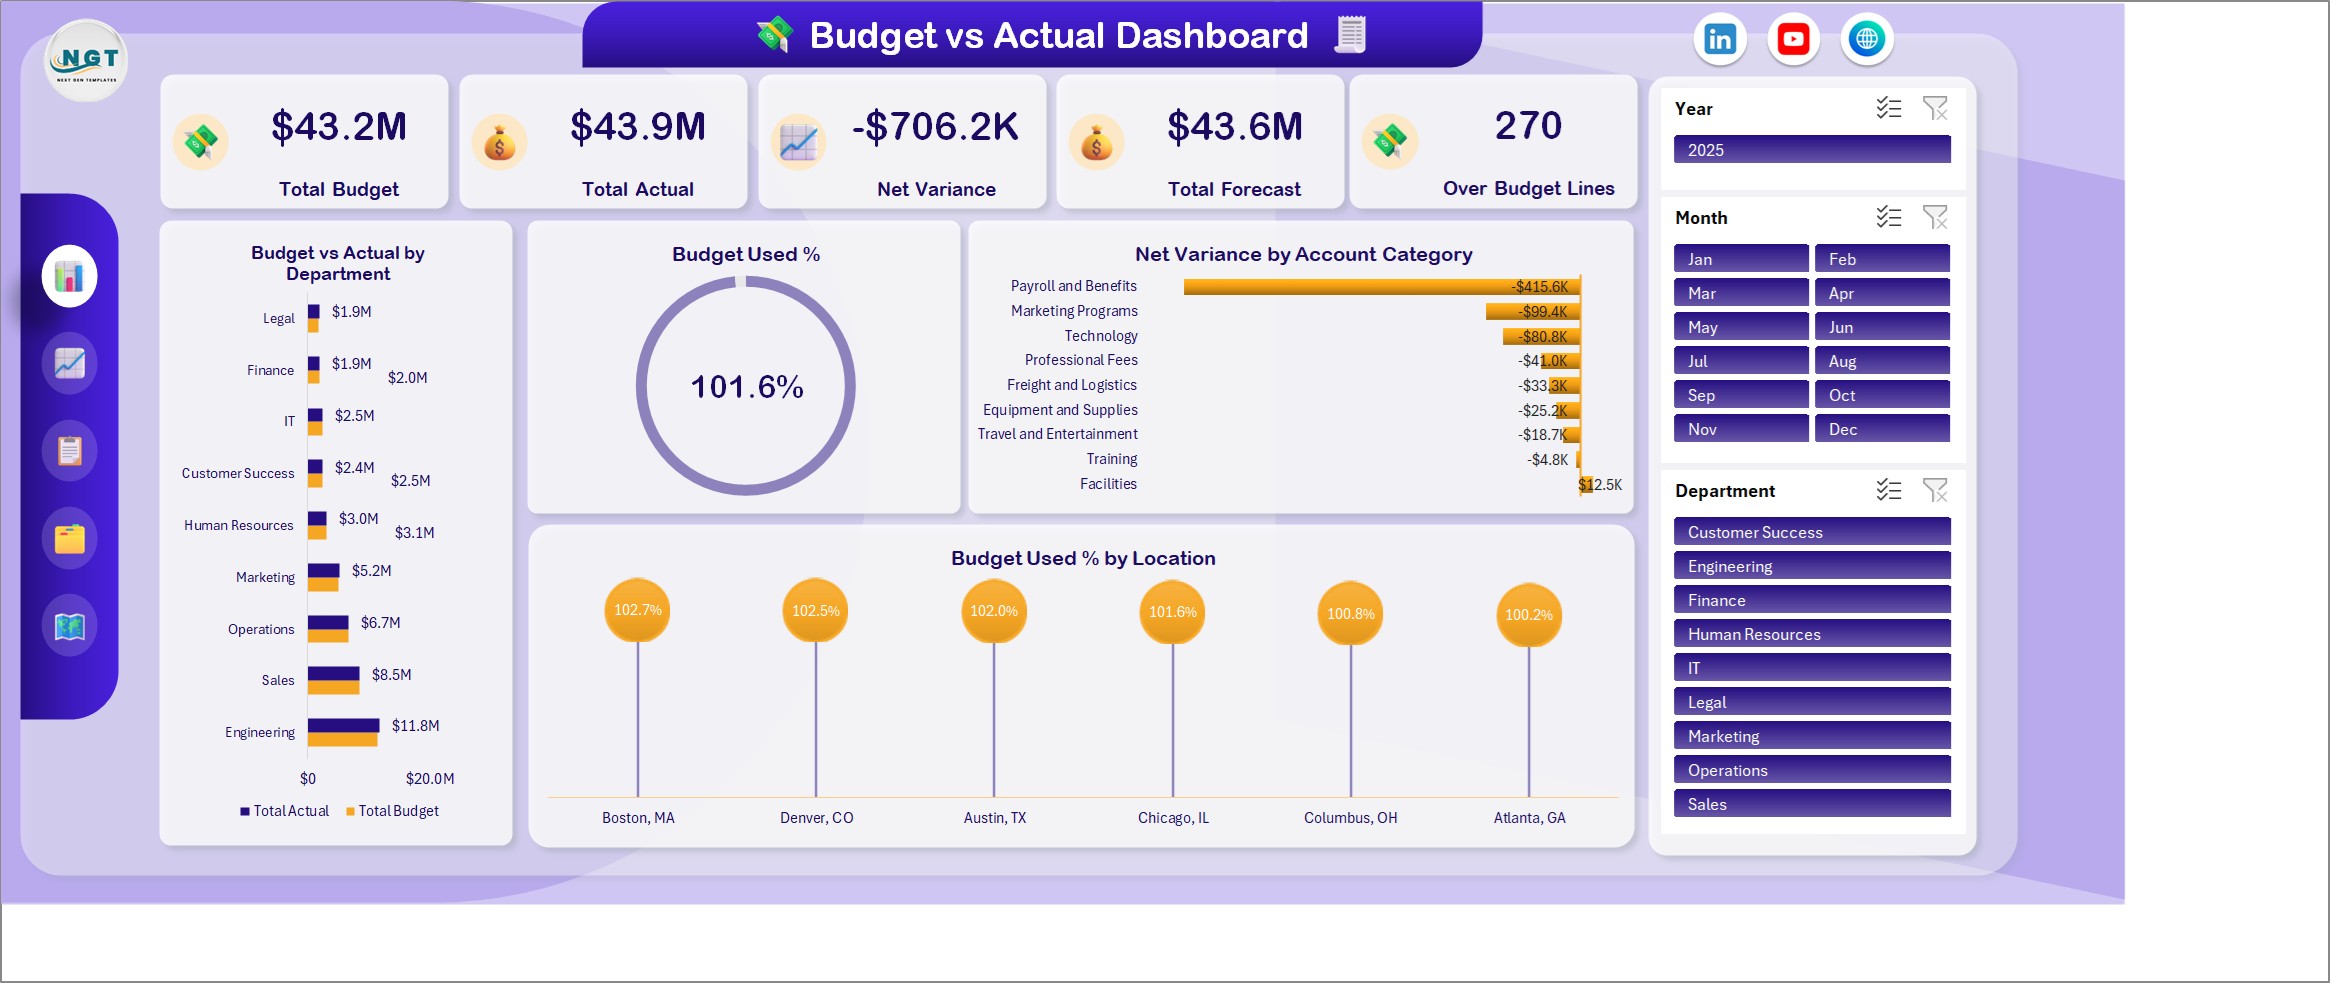
Five KPI cards sit across the top: Total Budget, Total Actual, Net Variance, Total Forecast and Over Budget Lines, plus Budget Used %. Below them you get budget vs actual by department, net variance by account category and budget used % by location.
Departments Page
The top 10 cost centers, variance % by department, over-budget lines by department and actual vs forecast by budget owner.
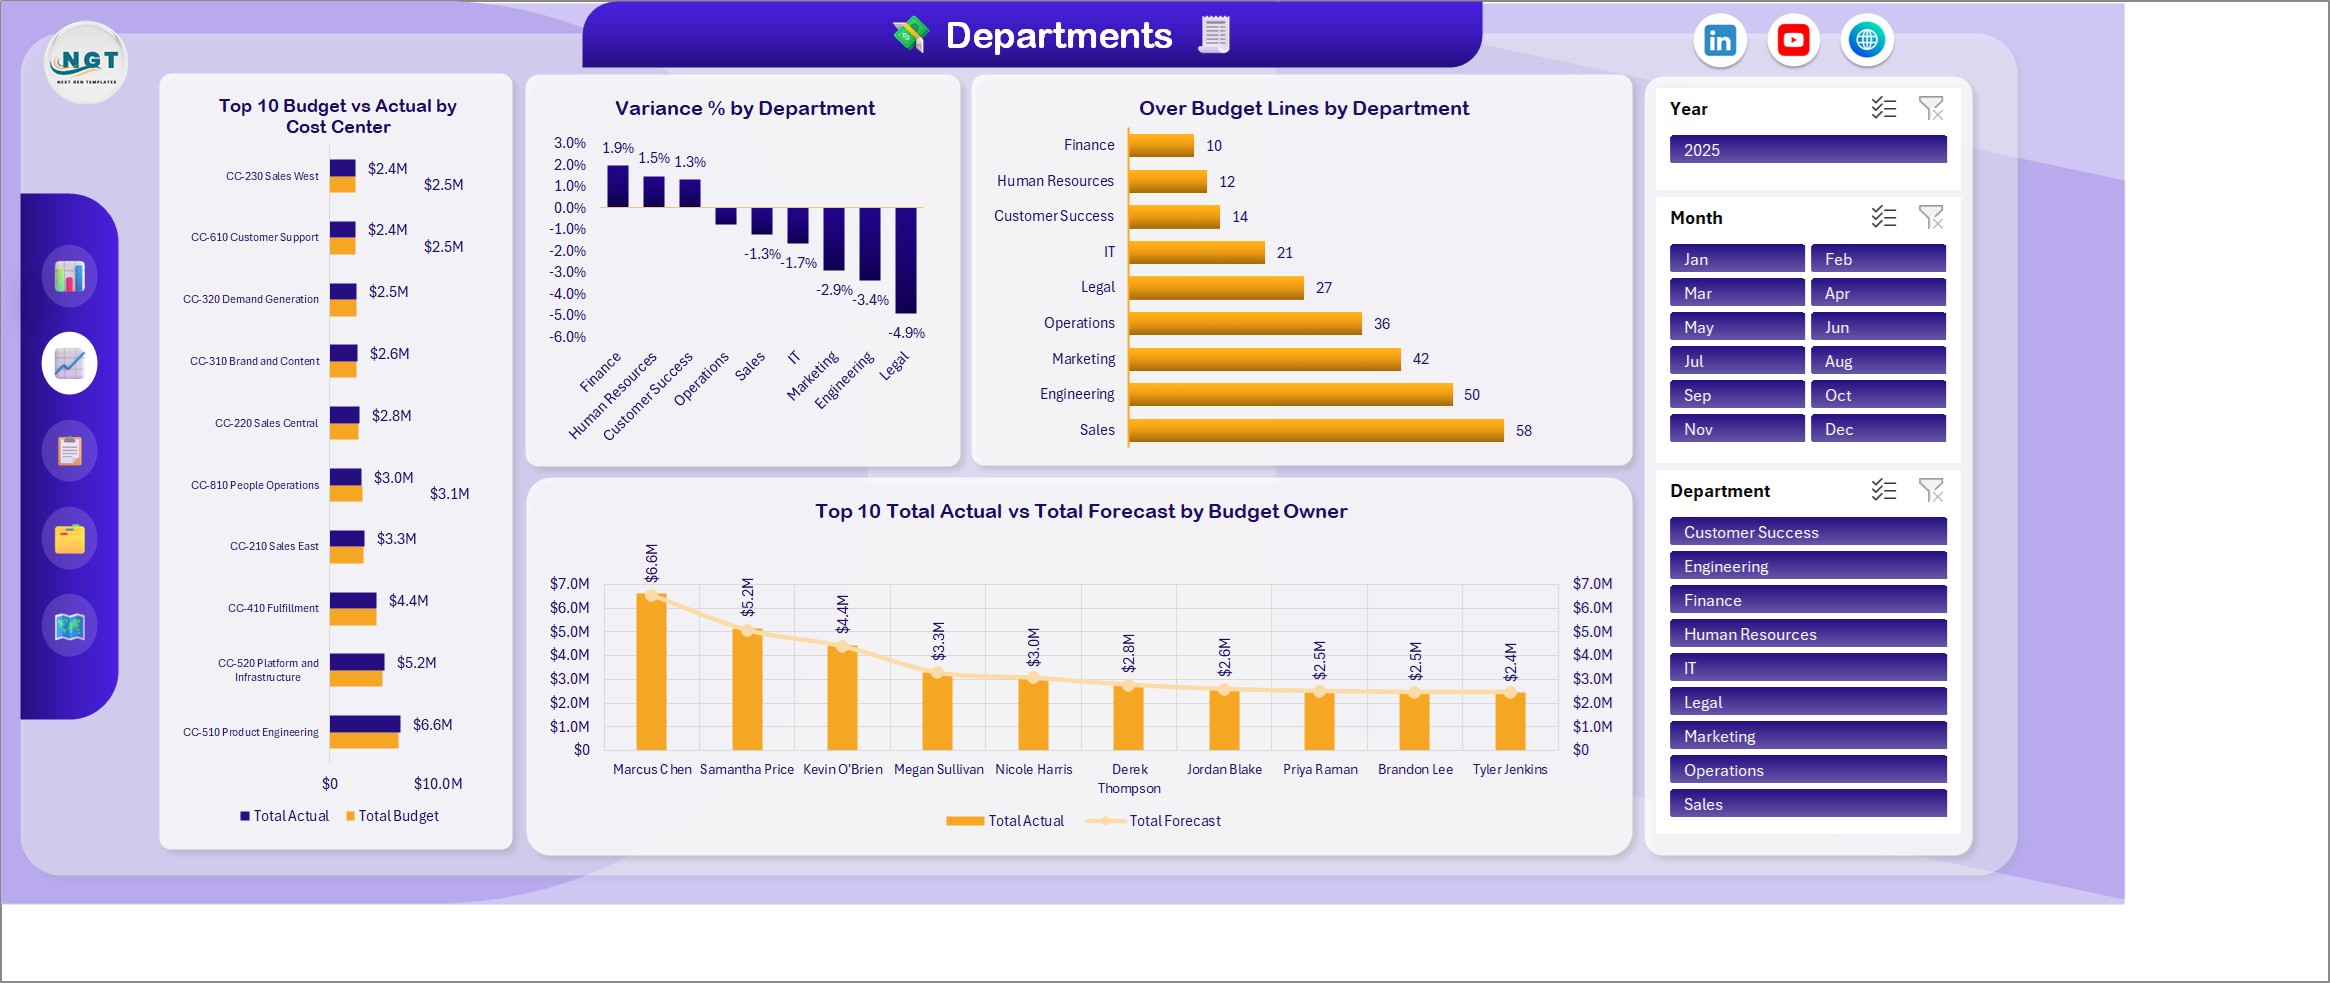
Accounts Page
Budget vs actual by account category, net variance by GL account, actual by expense type (fixed vs variable) and budget used % by category.
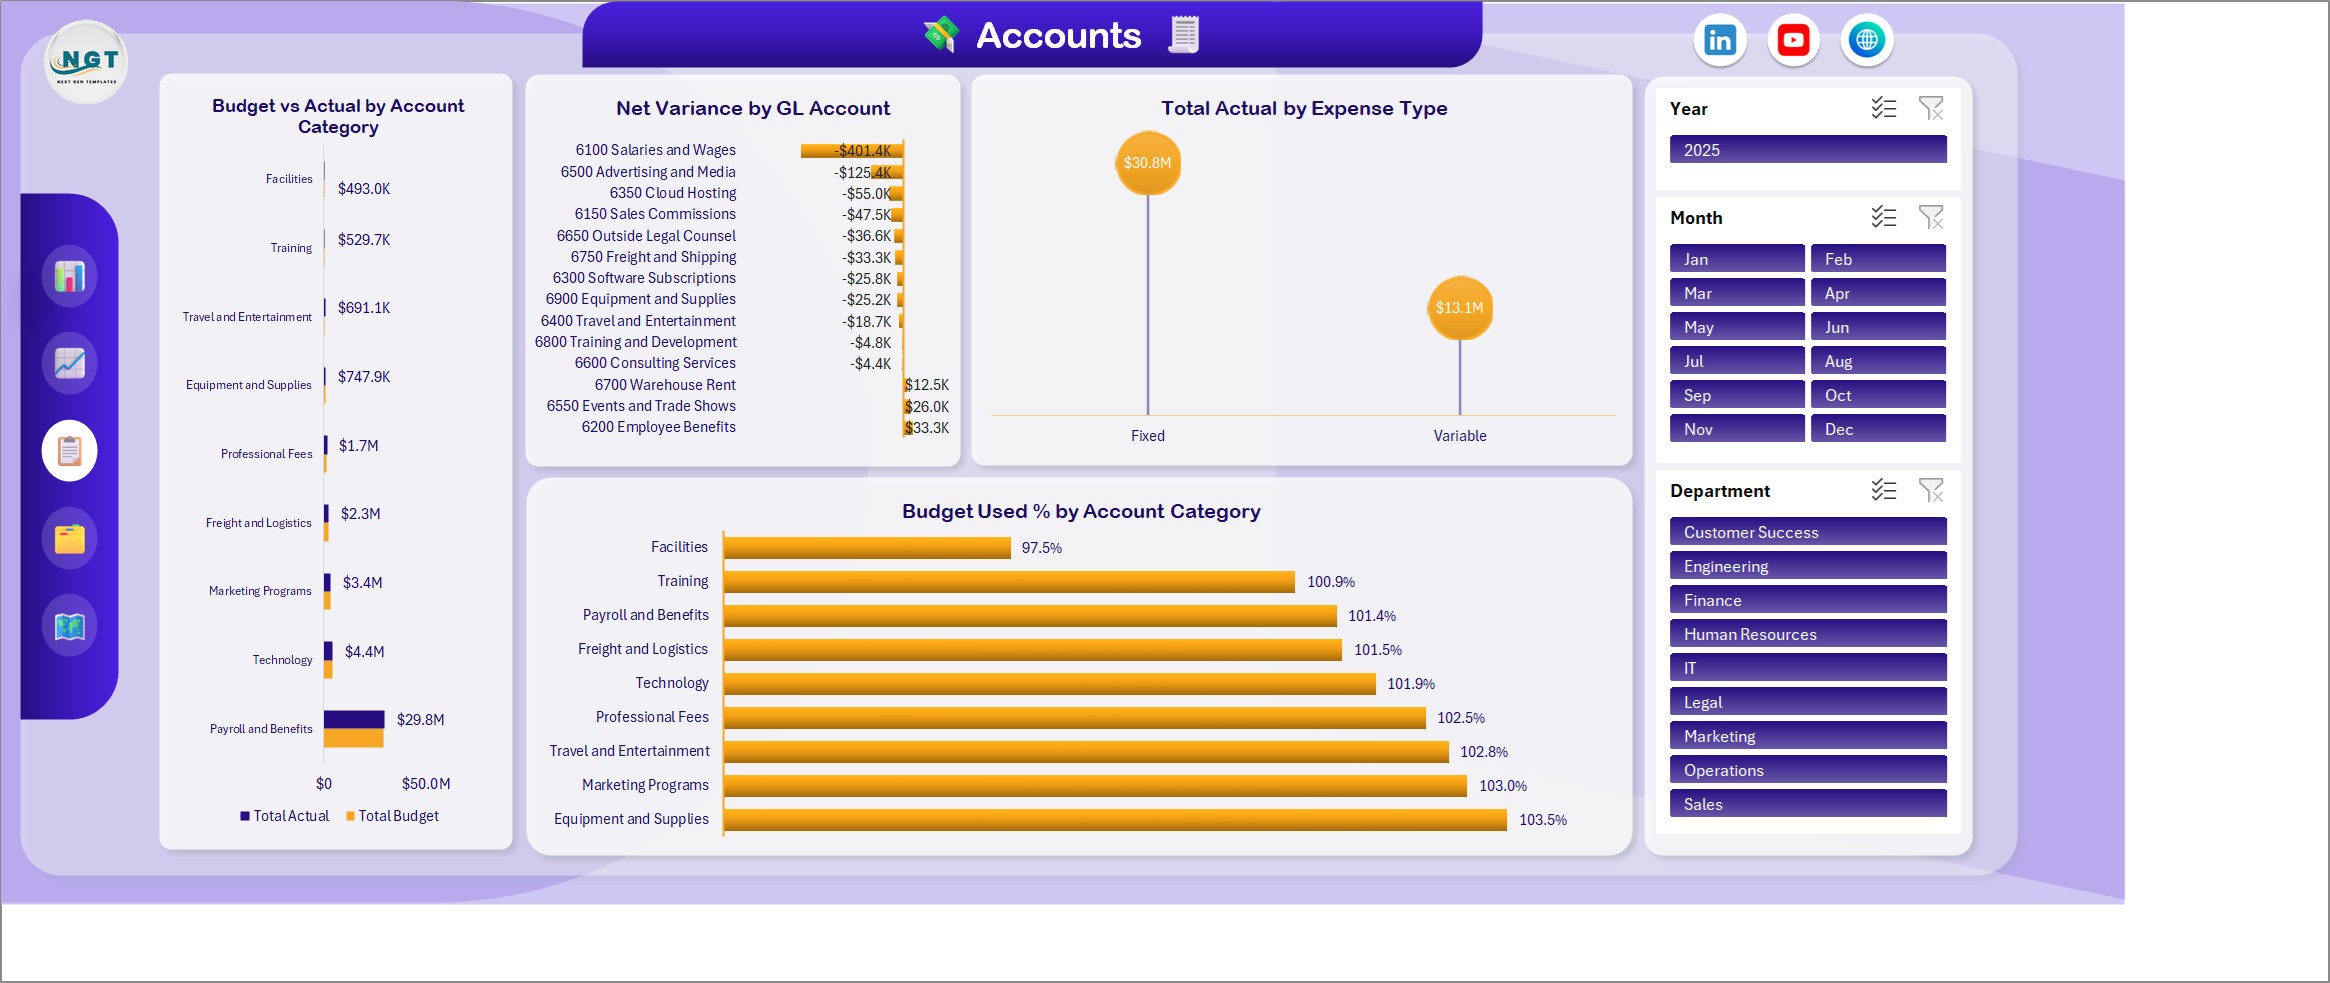
Trend Page
Net variance by month, forecast vs actual by month, budget used % by quarter and prior year vs actual by month.
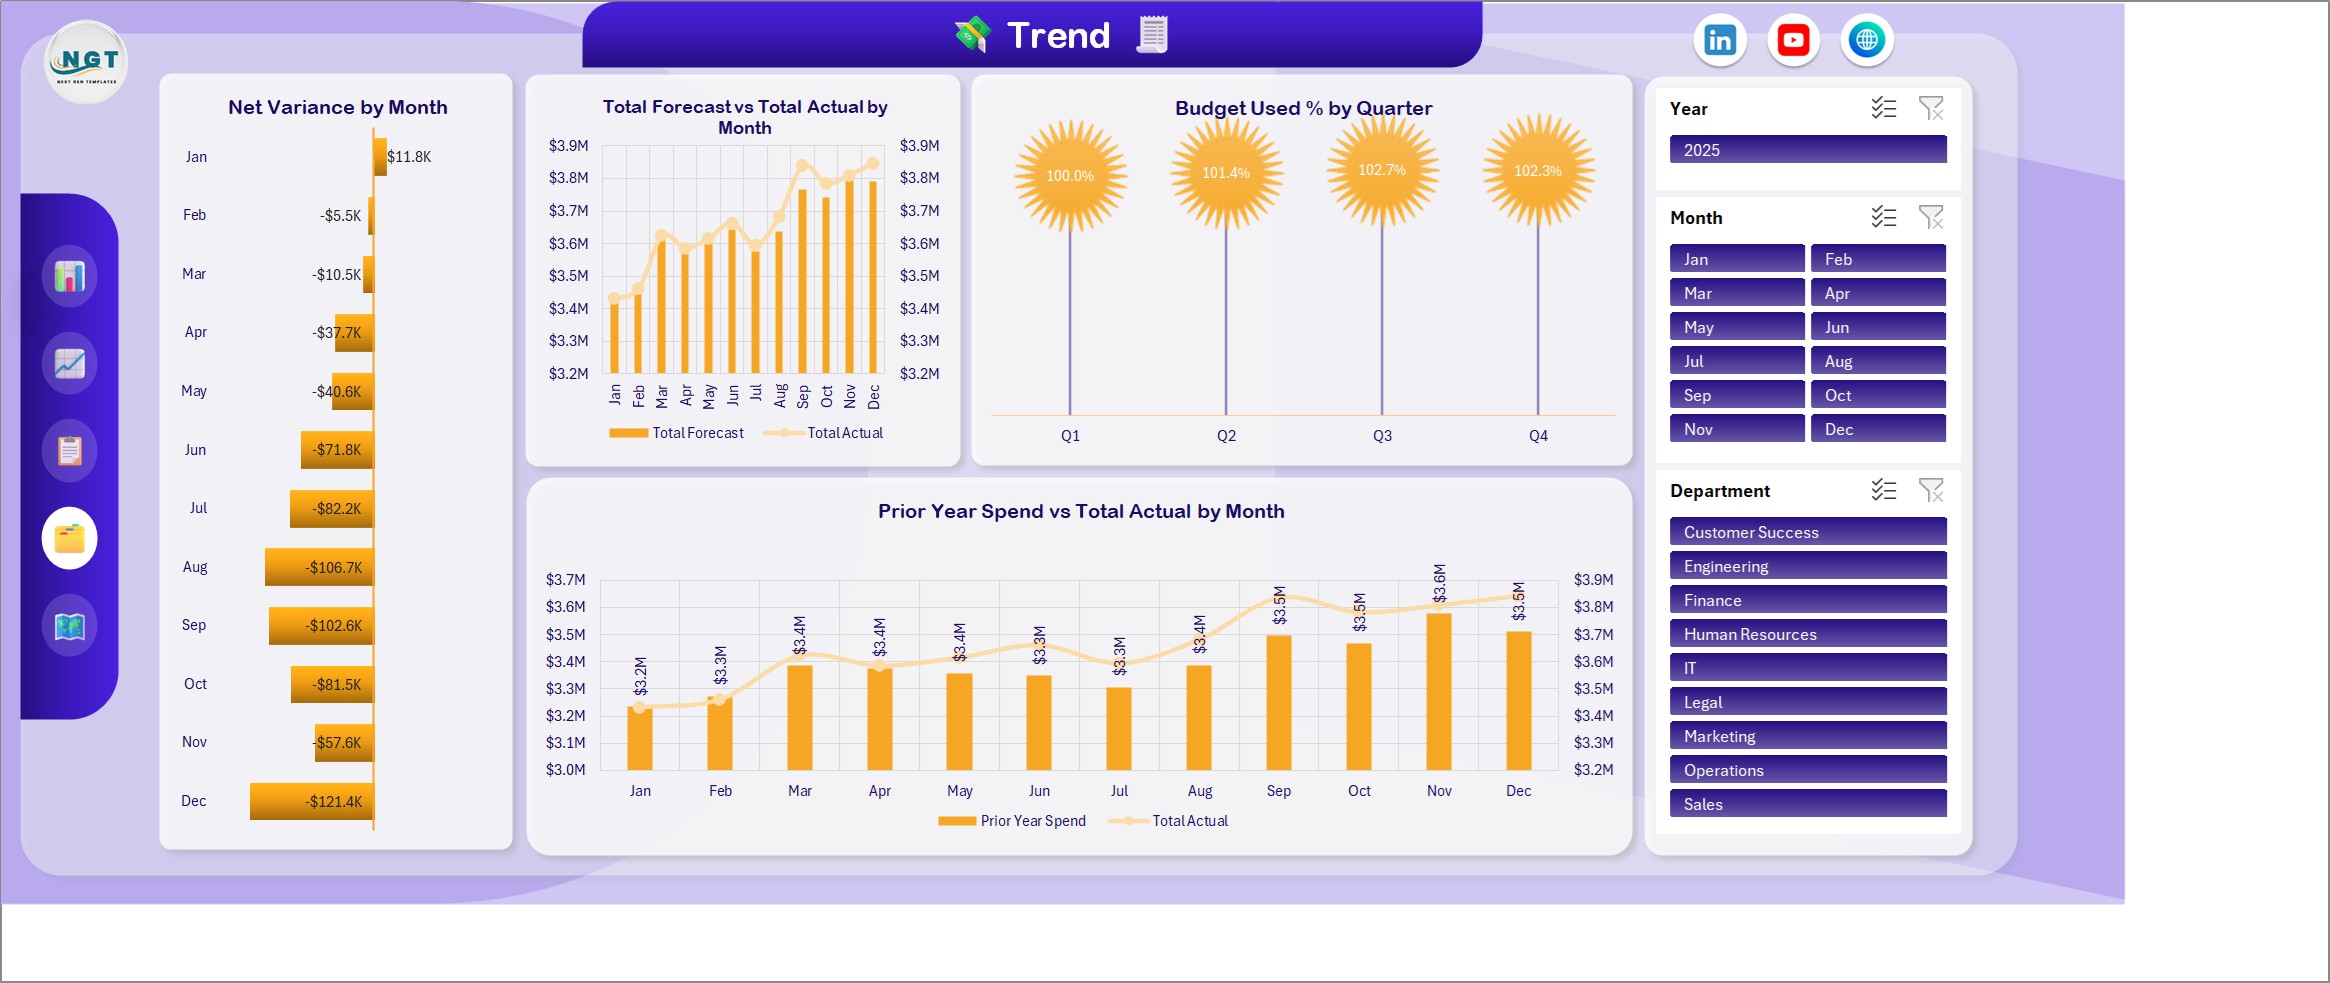
Locations Page
Budget vs actual by office, variance % by location, actual by business unit and budget lines by variance status.
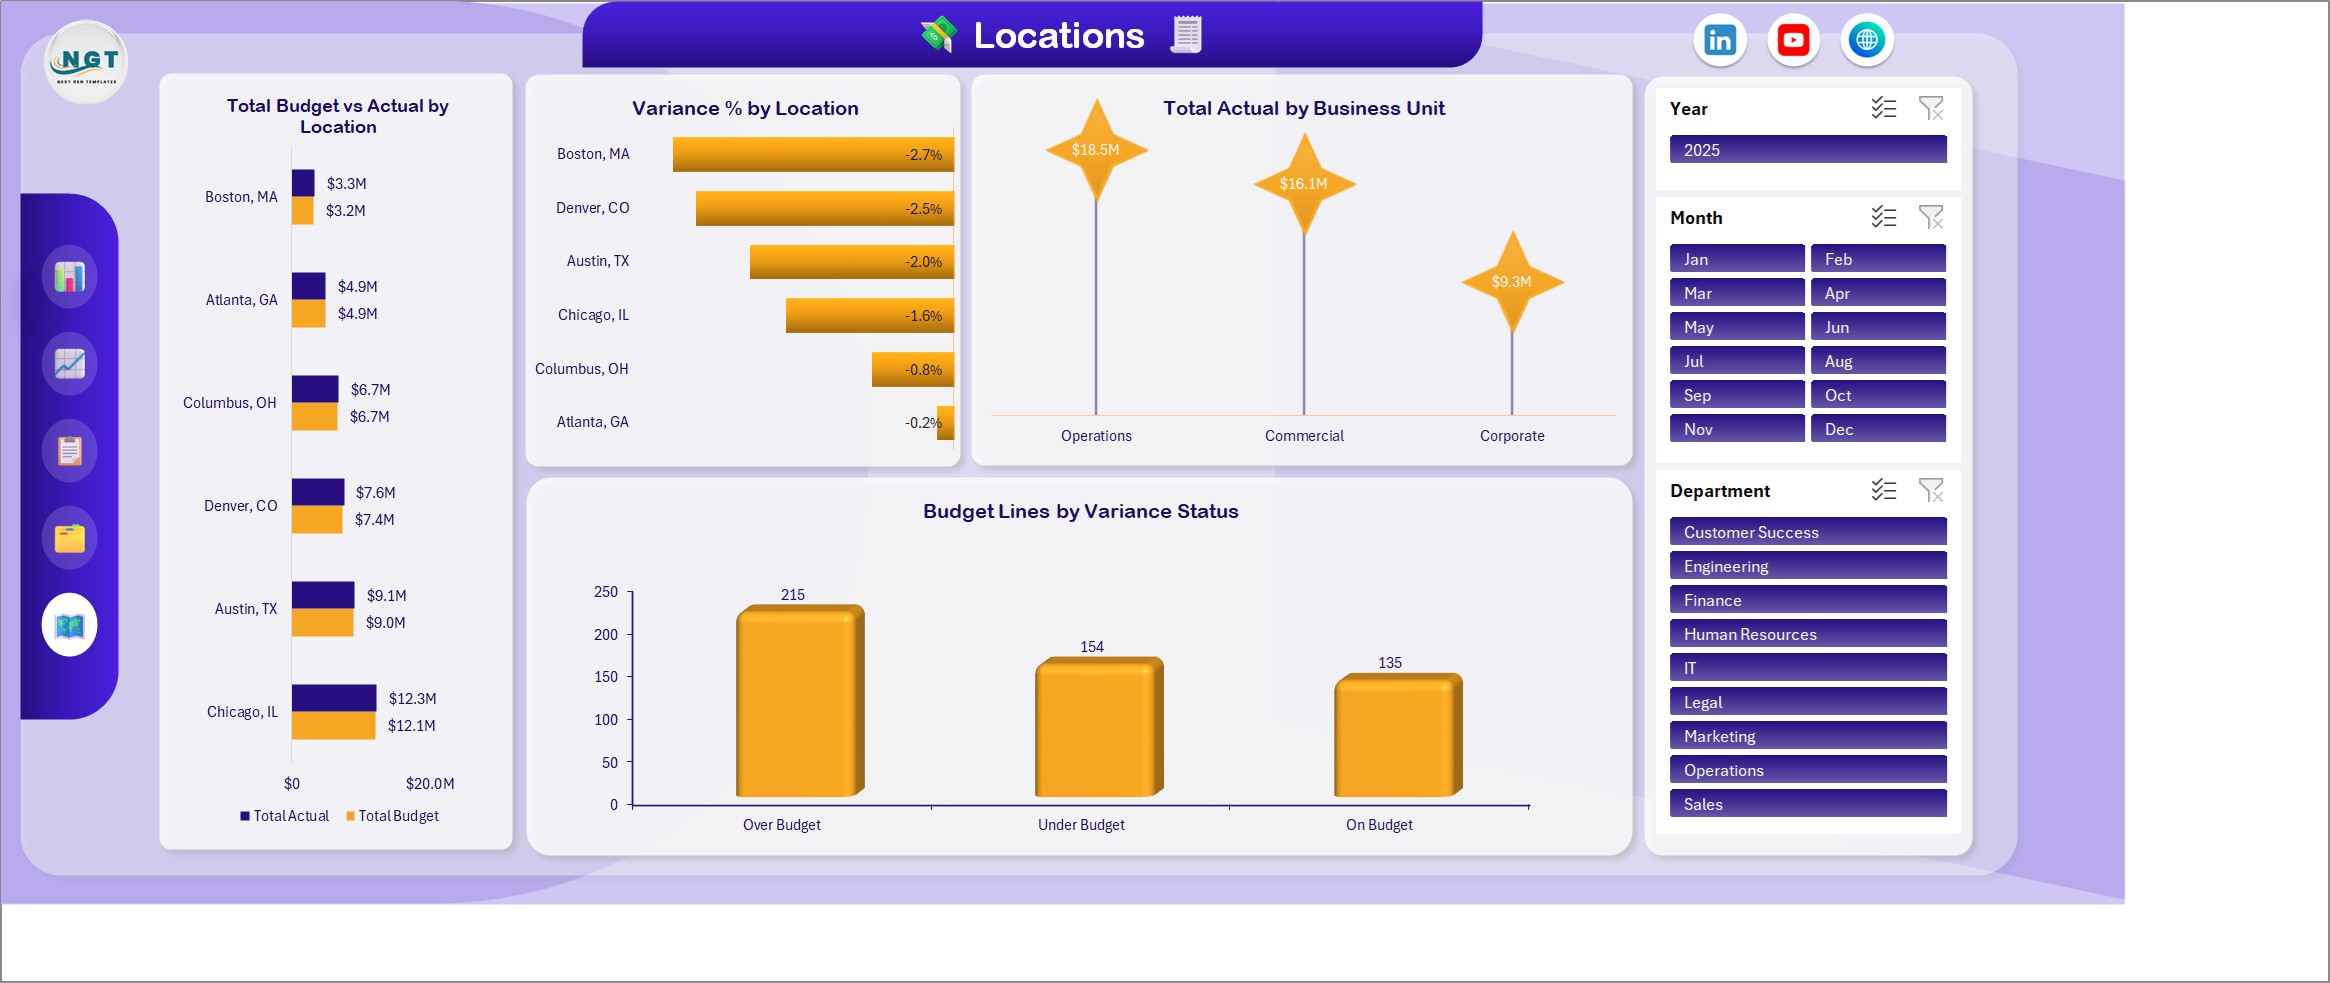
How It Works
The Data tab holds one row per budget line. Formula columns work out the variance, the variance status, the over-budget count, and the month, year and quarter. A Support tab holds the pivot tables that feed the charts. Three slicers (Year, Month and Department) filter all five pages at once, so you can look at one department or a range of months in a click.
Pros and Limits
- One screen for budget, actual, forecast, net variance and budget used %
- No macros, no add-ins, no subscription
- Works for any budget list you can paste into the Data tab
- It is not a live connector to accounting software, so you refresh it yourself
- Built for desktop Excel on Windows, Excel 2016 or later, or Microsoft 365
Frequently Asked Questions
Does it connect to my accounting or ERP software?
No. It is an add-data-and-refresh workbook. Type or paste your budget lines on the Data tab, click Refresh All, and every card, chart and slicer updates. There is no live link to QuickBooks, Xero, SAP or any other system.
Does it need macros or add-ins?
No. It uses formulas, pivot tables, charts and slicers only, so there is nothing to enable beyond opening the file.
Which Excel version do I need?
Desktop Excel for Windows, Excel 2016 or later, or Microsoft 365. The slicers and pivot tables do not work fully in Excel for the web.
How is variance calculated?
Variance = budget minus actual, so a negative number means you overspent. A line is marked On Budget when actual is within 2% of the plan; otherwise it is Over Budget or Under Budget.
What does Budget Used % show?
It is actual spend divided by budget for whatever is in view. It reacts to the Year, Month and Department slicers, so you can see it for one department or one range of months.
Is the sample data real?
No. The 504 budget lines on the Data tab are fictional. Replace them with your own and refresh.
Can I keep real financial data in it?
Yes, but an Excel file is only as private as where you store it. Keep your copy somewhere access-controlled and share it with named people only.
Get the Budget vs Actual Dashboard
Get the dashboard here: Budget vs Actual Dashboard in Excel. For a related finance view, try the Credit Recovery Agencies KPI Dashboard in Excel.