The wearable technology industry is evolving at an incredible pace. From smartwatches and fitness trackers to health monitoring devices and IoT-enabled wearables, organizations must continuously track performance across sales, operations, quality, and customer engagement. However, when KPI data is scattered across multiple spreadsheets or reported manually, teams lose visibility, and decision-making becomes slow and reactive.
That is exactly why the Wearable Tech KPI Dashboard in Google Sheets becomes an essential performance management tool.
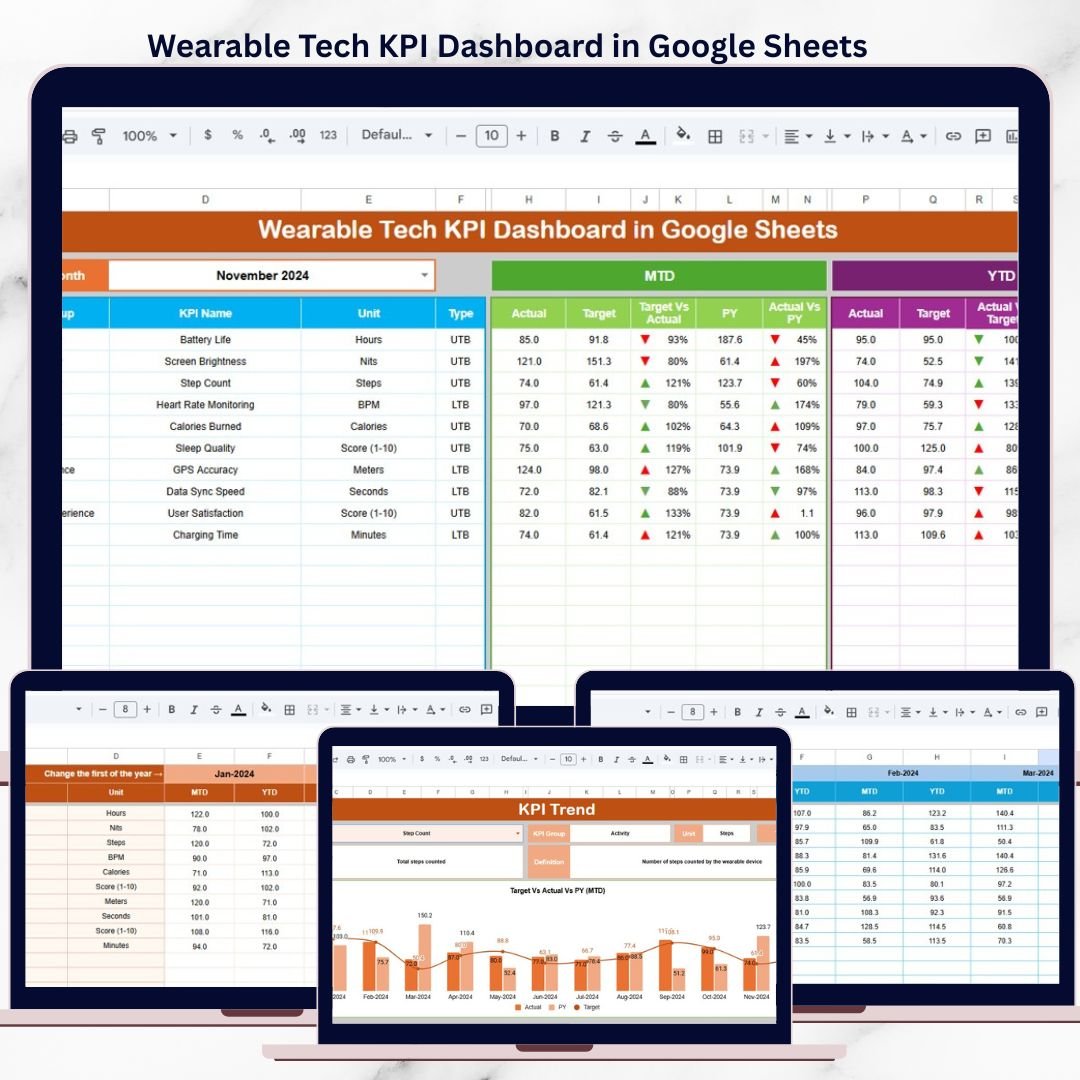
This professionally designed, ready-to-use KPI dashboard helps wearable technology companies track, analyze, and improve performance using structured KPIs, automated calculations, and intuitive visuals—all within Google Sheets. Instead of building complex reports every month, teams can rely on one centralized dashboard that updates automatically and delivers clear insights.
Because the dashboard is built entirely in Google Sheets, it is cloud-based, easy to share, and fully customizable—without requiring advanced technical skills or expensive BI platforms.
🚀 Key Features of the Wearable Tech KPI Dashboard in Google Sheets
📊 Centralized KPI Performance View
All critical wearable technology KPIs are tracked in one unified dashboard. Each KPI is supported with:
-
Unit of measurement
-
Aggregation logic
-
KPI definition
-
Performance direction (Lower the Better / Upper the Better)
This ensures consistency, clarity, and governance across teams.
📅 Dynamic Month Selector with MTD & YTD Tracking
A built-in Month Dropdown (Cell D3) allows users to switch reporting periods instantly.
When the month changes:
-
All KPI values refresh automatically
-
MTD (Month-to-Date) and YTD (Year-to-Date) values recalculate
-
Traffic-light indicators update
-
Up and down arrows reflect performance movement
This makes the dashboard ideal for both operational reviews and executive reporting.
🚦 Traffic Lights & Trend Indicators
Each KPI includes:
-
Green / Amber / Red traffic-light indicators for performance status
-
Up & Down arrows to show improvement or decline
-
Percentage variance indicators
Decision-makers can identify performance gaps at a glance.
📂 What’s Inside the Wearable Tech KPI Dashboard
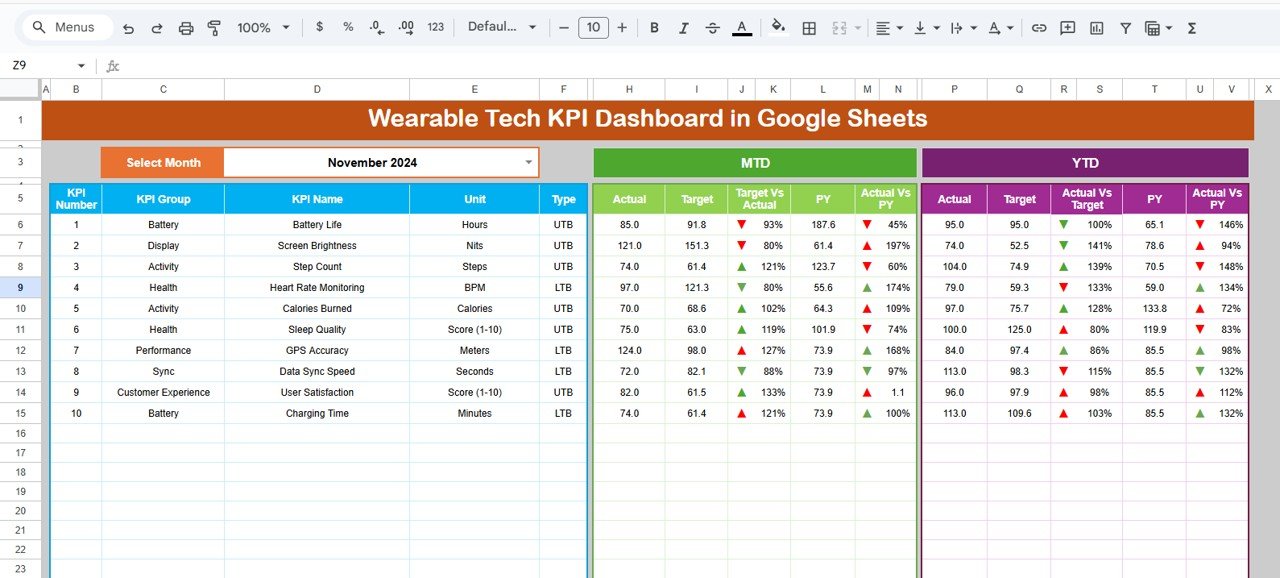
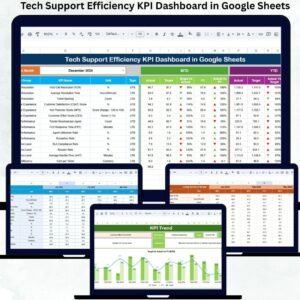
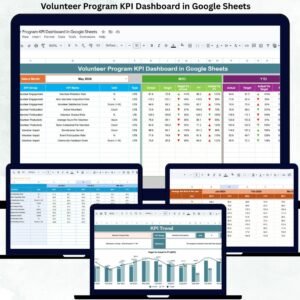
📌 Dashboard Sheet (Main Dashboard)
This is the primary performance view.
It displays:
-
KPI Name
-
MTD Actual, Target, and Previous Year values
-
Target vs Actual variance (%)
-
Previous Year vs Actual variance (%)
-
YTD Actual, Target, and Previous Year values
-
Conditional formatting with arrows and traffic lights
Perfect for leadership reviews, strategy meetings, and monthly reporting.
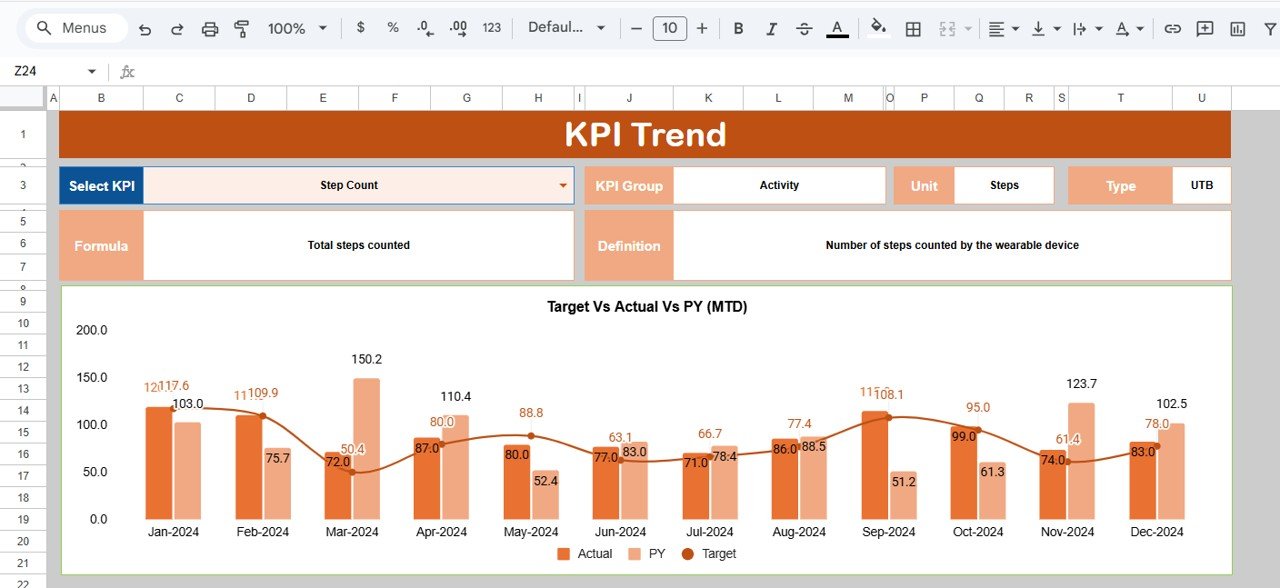
📈 KPI Trend Sheet
The KPI Trend Sheet enables detailed KPI analysis.
How it works:
-
Select a KPI from the dropdown in Cell C3
-
Automatically displays:
-
KPI Group
-
KPI Unit
-
KPI Type (Lower the Better / Upper the Better)
-
KPI Formula
-
KPI Definition
-
This sheet helps identify long-term trends and performance patterns.
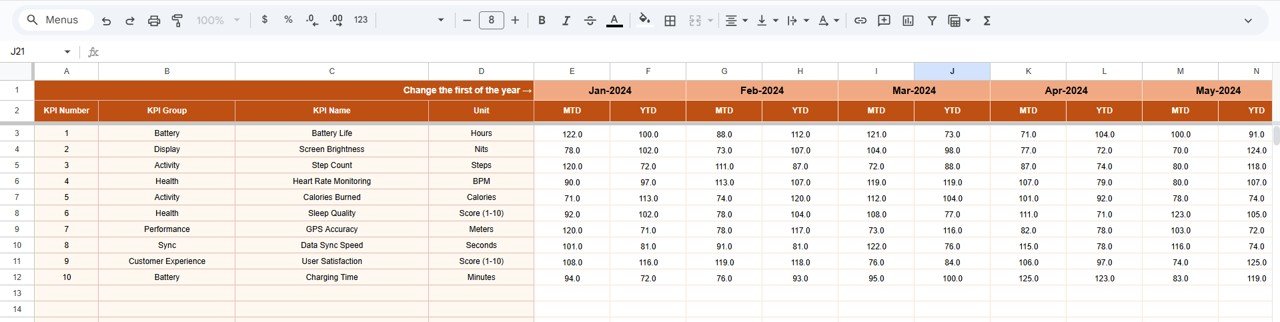
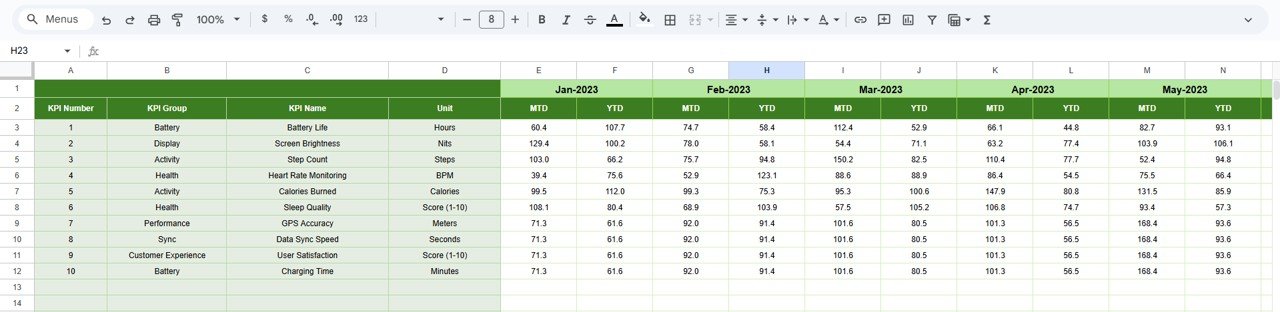
🧮 Actual Number Sheet
This sheet is used to enter real performance data.
Key features:
-
Enter MTD and YTD actual values
-
Select the first month of the year in Cell E1
-
YTD values calculate automatically
-
No complex formulas required
🎯 Target Sheet
Defines expected KPI performance.
You can:
-
Enter monthly MTD targets
-
Maintain cumulative YTD targets
-
Drive all variance and performance calculations
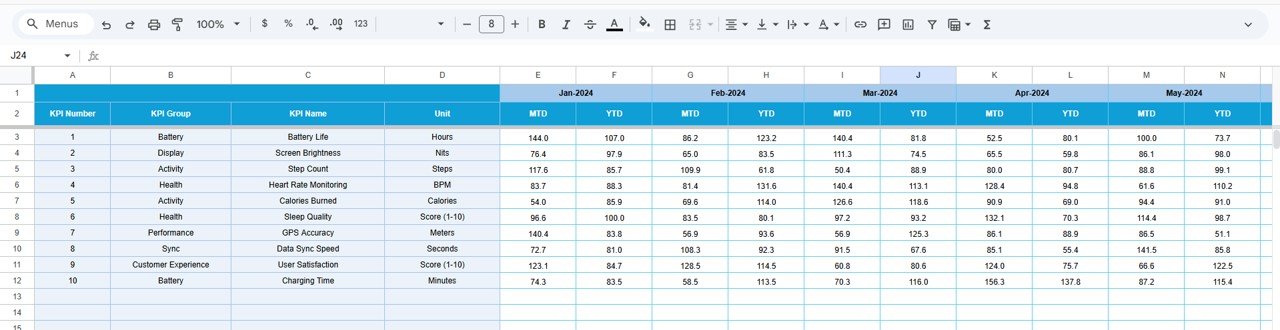
📊 Previous Year Number Sheet
Stores historical KPI data.
Purpose:
-
Enable Year-over-Year (YoY) comparison
-
Support Previous Year vs Actual analysis
-
Identify growth and seasonal patterns
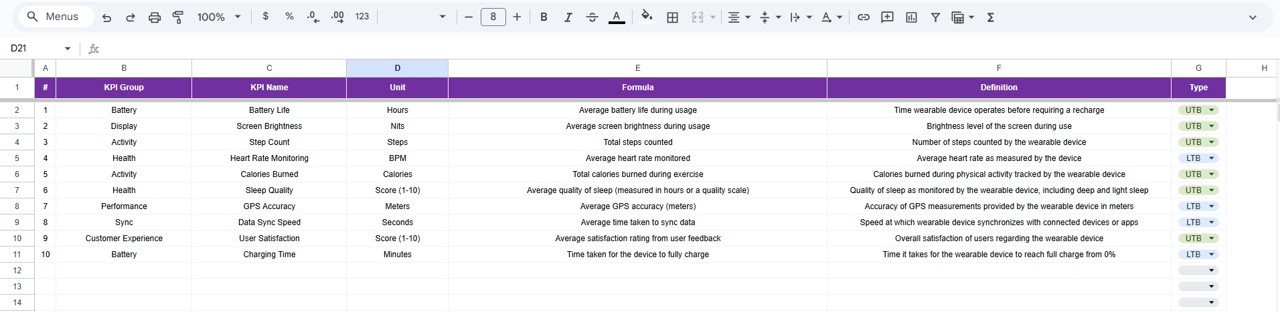
📚 KPI Definition Sheet
Acts as the KPI master reference.
Includes:
-
KPI Name
-
KPI Group
-
Unit
-
Formula
-
KPI Definition
This ensures transparency and standardization across the dashboard.
👥 Who Can Benefit from This Dashboard
-
⌚ Wearable Technology Manufacturers
-
📱 Consumer Electronics Companies
-
🧠 Product & Operations Managers
-
📊 Sales & Marketing Teams
-
👔 Strategy & Leadership Teams
### Click here to read the Detailed blog post
Watch the step-by-step video tutorial:


Reviews
There are no reviews yet.