


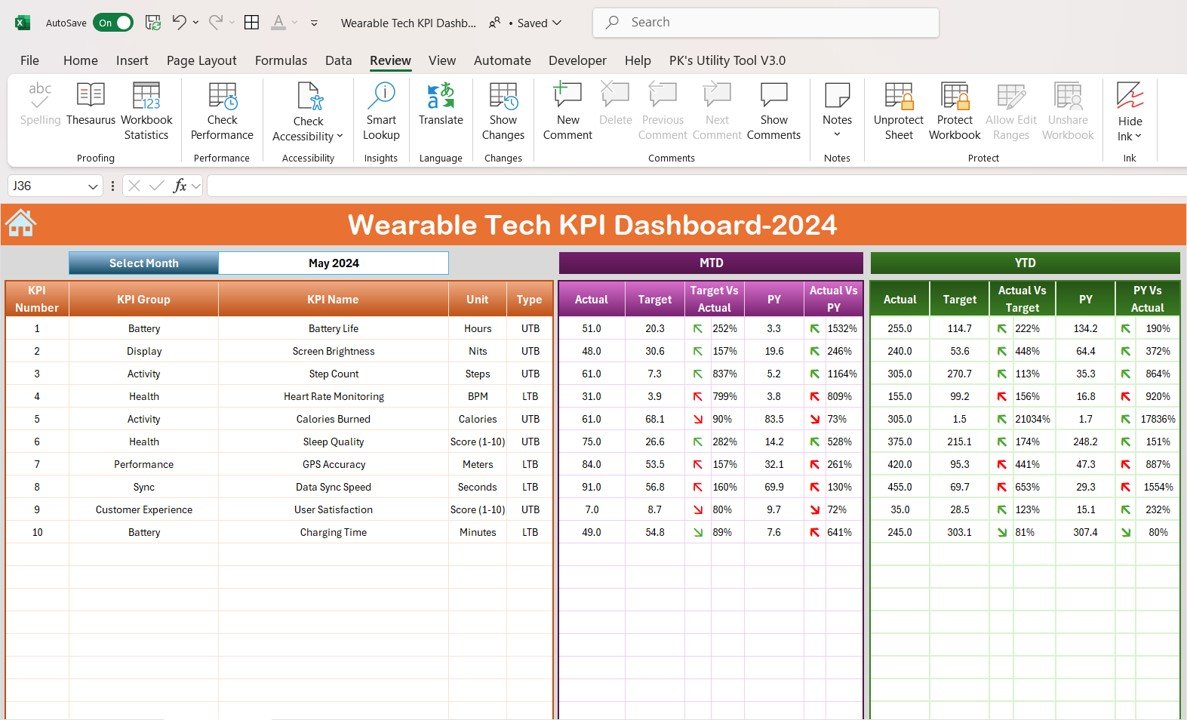
The Wearable Tech KPI Dashboard in Excel is an advanced tool designed for product managers, R&D teams, and business analysts working in the wearable technology industry. This Excel-based dashboard enables you to track key performance indicators (KPIs) related to wearable devices, including sales performance, user engagement, device usage, market trends, and customer feedback.
With real-time tracking, interactive features, and customizable options, this dashboard helps you monitor the success of wearable tech products, optimize performance, and identify areas for innovation. It ensures that you make data-driven decisions that enhance product development and meet consumer demand.
Key Features of the Wearable Tech KPI Dashboard in Excel:
📊 Sales Performance Monitoring
Track the sales of wearable devices across different markets, including regional performance, sales volume, and revenue generation.
💡 User Engagement Metrics
Monitor user engagement with wearable devices, including active users, usage frequency, and session length, to evaluate customer satisfaction and product effectiveness.
📱 Device Usage Tracking
Track key metrics such as battery life, usage time, and device health to ensure optimal performance and identify potential areas for improvement.
🔍 Market Trends Analysis
Monitor the latest trends in the wearable tech industry, including new market entrants, competitor analysis, and consumer preferences.
📝 Customer Feedback and Ratings
Track customer feedback and ratings across various platforms to identify product strengths and areas for improvement, helping to refine the user experience.
🚀 Why You’ll Love the Wearable Tech KPI Dashboard in Excel:
✅ Monitor Sales Performance – Track regional sales and revenue trends to evaluate the market success of your wearable tech products.
✅ Optimize User Engagement – Monitor active users, session length, and usage frequency to improve customer retention and product value.
✅ Enhance Device Usage – Track key device performance metrics such as battery life and usage time to ensure a smooth user experience.
✅ Analyze Market Trends – Stay updated on market trends and competitor activities to help shape product development and marketing strategies.
✅ Leverage Customer Feedback – Track customer reviews, ratings, and feedback to continuously improve the product and meet user expectations.
✅ Fully Customizable and Interactive – Fully customizable to suit your specific wearable tech product needs, with interactive charts and real-time tracking for improved decision-making.
What’s Inside the Wearable Tech KPI Dashboard in Excel:
-
Sales Performance Monitoring: Track sales data, revenue, and market performance to identify trends and opportunities for growth.
-
User Engagement Metrics: Monitor user activity and engagement with the device, including active user tracking, usage patterns, and session duration.
-
Device Usage Tracking: Track device performance indicators such as battery life, usage time, and overall device health to ensure product quality.
-
Market Trends: Stay informed about the latest trends in wearable technology, including consumer behavior, competitor movements, and industry forecasts.
-
Customer Feedback: Track and analyze customer feedback, ratings, and reviews to continuously improve your product and user experience.
-
Custom Reports: Generate customized reports that summarize sales, usage, engagement, and customer satisfaction metrics to inform business decisions.
How to Use the Wearable Tech KPI Dashboard in Excel:
1️⃣ Download the Template – Instantly access your Excel file upon purchase.
2️⃣ Input Product Data – Enter sales, user engagement, device performance, and feedback data to start tracking key KPIs.
3️⃣ Monitor Key Metrics – Use the dashboard to monitor sales performance, user engagement, and device usage in real-time.
4️⃣ Analyze Market Trends – Stay updated on market dynamics, trends, and consumer preferences to guide product development and strategy.
5️⃣ Generate Reports – Create customized reports summarizing key performance indicators such as sales, device health, and user satisfaction to support strategic decisions.
Who Can Benefit from the Wearable Tech KPI Dashboard in Excel:
-
Product Managers in Wearable Tech
-
R&D Teams
-
Marketing and Sales Teams
-
Business Analysts
-
Customer Experience Teams
-
Consumer Electronics Companies
-
Fitness and Health Companies
-
Retail and E-Commerce Teams
The Wearable Tech KPI Dashboard in Excel is the perfect tool for anyone managing wearable technology products. With features that help you track sales, monitor user engagement, and analyze market trends, this dashboard helps ensure your wearable tech products are performing optimally and meeting consumer expectations.
Click here to read the Detailed blog post
https://www.pk-anexcelexpert.com/wearable-tech-kpi-dashboard-in-excel/
Visit our YouTube channel to learn step-by-step video tutorials
Youtube.com/@PKAnExcelExpert


Reviews
There are no reviews yet.