


The Virtual Events KPI Dashboard in Excel is an invaluable tool for event planners, marketers, and business owners who host and manage virtual events. This customizable Excel dashboard allows you to track and analyze key performance indicators (KPIs) such as attendee engagement, registration numbers, event feedback, session performance, and revenue. By providing real-time insights, this tool helps you optimize virtual event planning, enhance attendee experiences, and increase ROI.
Whether you’re organizing webinars, online conferences, or virtual trade shows, this dashboard offers a comprehensive overview of your event’s performance, enabling you to identify trends, make data-driven decisions, and improve future virtual event planning. Simplify your virtual event tracking and ensure a smooth, successful event with the Virtual Events KPI Dashboard in Excel.
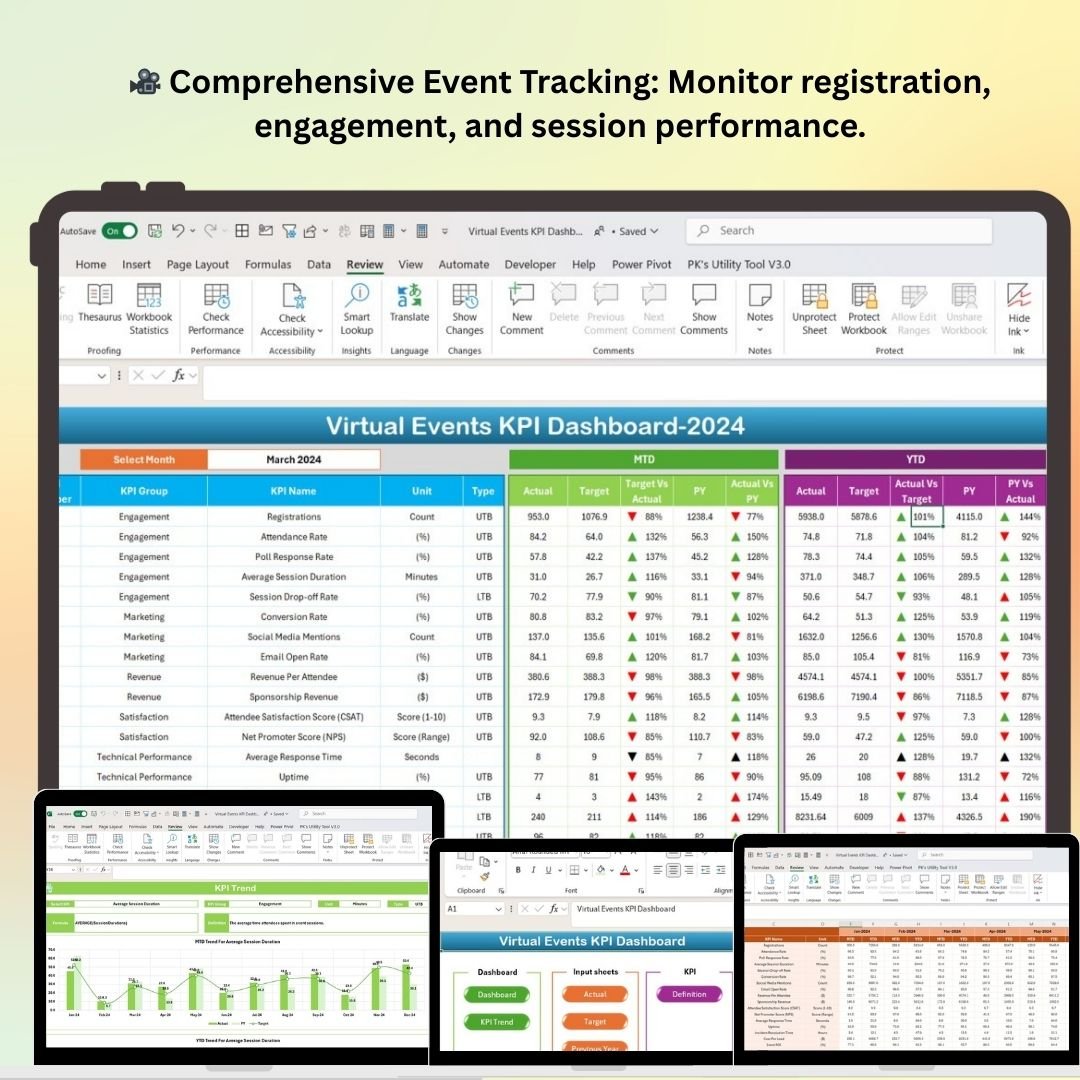
Key Features of the Virtual Events KPI Dashboard in Excel
🎥 Comprehensive Event Performance Tracking
Track essential KPIs such as attendee registration, participation rates, session feedback, engagement levels, and event revenue. Monitor the performance of each virtual event component to optimize your strategies.
⚡ Real-Time Engagement Monitoring
Monitor attendee engagement and session participation in real time. Identify popular sessions, active participants, and drop-off points to improve attendee experience and session relevance.
📈 Session & Feedback Insights
Analyze session performance, including attendee ratings, feedback scores, and overall satisfaction. Gain insights into which sessions performed best and where improvements can be made for future events.
📅 Customizable KPIs for Virtual Events
Easily adjust the dashboard to track KPIs specific to your virtual event needs, such as attendee demographics, virtual exhibit visits, session registrations, or sponsor engagement.
🖥️ Interactive & User-Friendly Interface
Designed for ease of use, the dashboard features a simple layout with interactive filters, slicers, and visual reporting tools that allow you to dive deeper into your event data and track performance metrics effectively.
Why You’ll Love the Virtual Events KPI Dashboard in Excel

✅ Track Attendee Engagement
Monitor key engagement metrics such as session participation, interaction levels, and overall attendee involvement to ensure high engagement throughout the event.
✅ Analyze Session Performance
Track the performance of each session based on attendee feedback, ratings, and participation to determine which topics resonated most with your audience.
✅ Improve Virtual Event ROI
Monitor event revenue, including ticket sales, sponsorships, and other income streams, to evaluate ROI and optimize future virtual event strategies.
✅ Enhance Attendee Experience
Utilize real-time data to address attendee concerns and improve session content, scheduling, and interactivity, ensuring a better experience for participants.
✅ Make Data-Driven Decisions
Leverage the dashboard’s insights to make informed decisions about future virtual events, including content adjustments, marketing strategies, and audience targeting.
What’s Inside the Virtual Events KPI Dashboard Template?
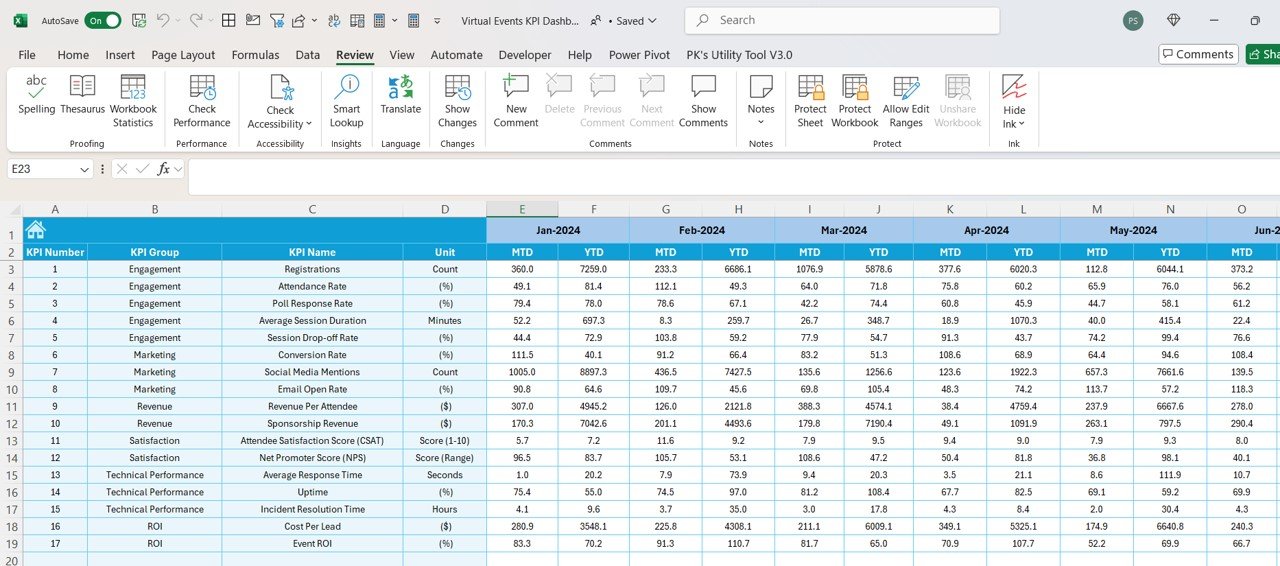
- Registration & Attendance Tracking: Monitor the number of event registrations and actual attendees for each session.
- Engagement & Interaction Metrics: Track attendee participation, session ratings, and feedback.
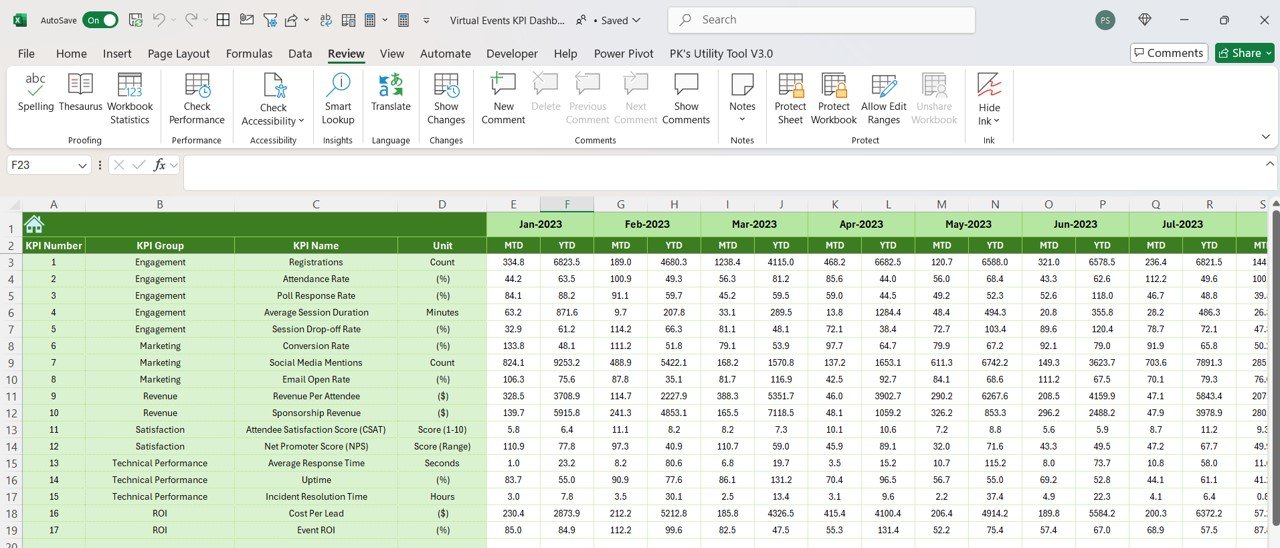
- Revenue & ROI Tracking: Monitor event-related revenue, including ticket sales, sponsorships, and merchandise.
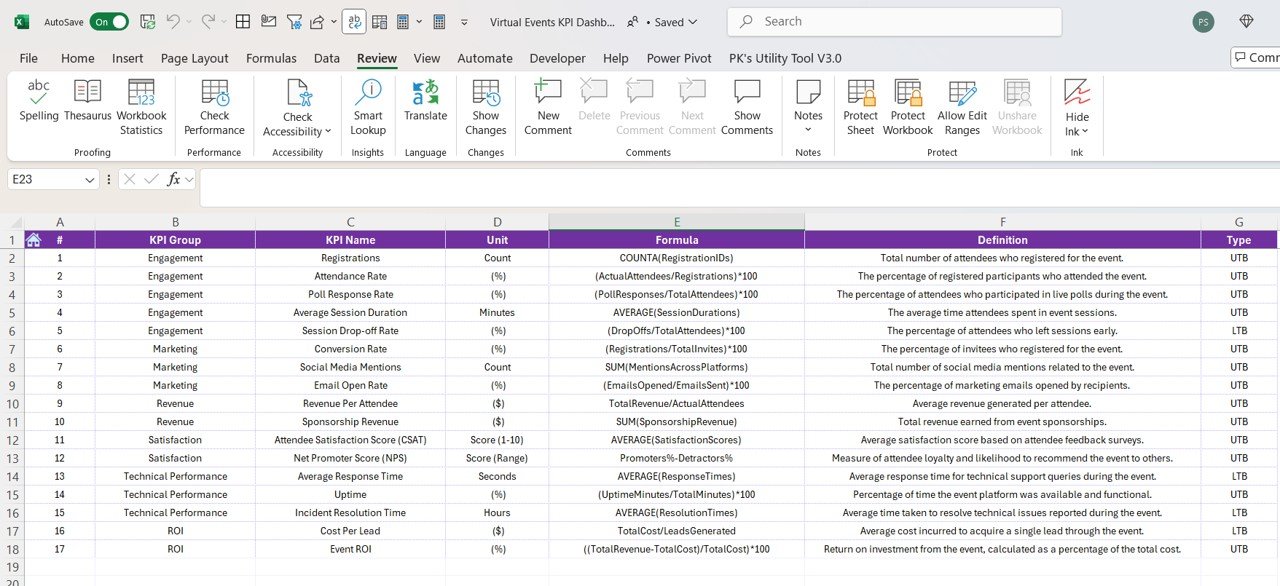
- Customizable KPIs: Adjust the dashboard to track specific metrics for your virtual events, such as sponsor engagement or virtual exhibit visits.
- Interactive Reporting: Use visual charts and filters to drill down into event data, uncover trends, and track performance across different sessions and activities.
How to Use the Virtual Events KPI Dashboard in Excel
1️⃣ Download the Template: Instantly access your Virtual Events KPI Dashboard in Excel.
2️⃣ Enter Event Data: Input data such as registration numbers, session attendance, revenue, and feedback.
3️⃣ Track & Monitor KPIs: Use the dashboard to monitor real-time performance during the event, including engagement and session effectiveness.
4️⃣ Analyze & Optimize: Leverage insights from the dashboard to improve engagement, optimize content, and maximize ROI for future virtual events.
Who Can Benefit from the Virtual Events KPI Dashboard in Excel?
🔹 Event Planners & Coordinators
🔹 Virtual Event Organizers & Hosts
🔹 Marketing Teams for Virtual Events
🔹 Business Owners & Entrepreneurs Hosting Online Events
🔹 Conference & Webinar Organizers
🔹 Anyone Managing Virtual Events & Online Conferences
Track, analyze, and optimize your virtual events with the Virtual Events KPI Dashboard in Excel. Monitor key performance metrics, improve attendee experience, and boost event ROI for successful online events.
Click here to read the Detailed blog post
Visit our YouTube channel to learn step-by-step video tutorials
Youtube.com/@PKAnExcelExpert


Reviews
There are no reviews yet.