
The streaming industry is expanding at lightning speed. Millions of users across mobile, TV, and web platforms consume content every minute. Video-on-Demand (VoD) Dashboard in Excel as user expectations grow and competition intensifies, Video-on-Demand (VoD) companies must track dozens of metrics—subscription trends, device preferences, regional behavior, user satisfaction, content performance, and profit margins. Without a proper reporting system, teams make decisions blindly, leading to lost revenue and missed opportunities.
The Video-on-Demand (VoD) Dashboard in Excel solves this challenge instantly. It brings together cost, revenue, ratings, watch duration, device usage, and region performance into one clean, interactive, and smartly designed dashboard. Video-on-Demand (VoD) Dashboard in Excel with slicers, dynamic charts, page navigation, and automated visuals, this dashboard becomes the complete analytics solution for streaming platforms of all sizes. 🚀
No advanced software. No confusing tools. Just Excel—simple, powerful, and perfect for fast, real-time decision-making.
Key Features of the Video-on-Demand (VoD) Dashboard in Excel ✨
This dashboard is packed with smart features designed for streaming analytics:
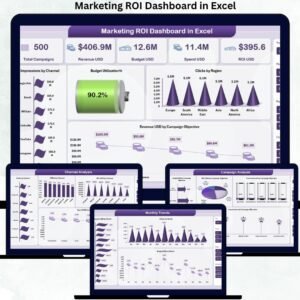
✨ Five Interactive Analysis Pages – Overview, Genre, Device, Region & Monthly Trends
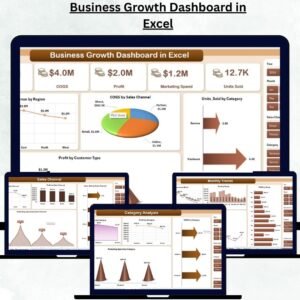
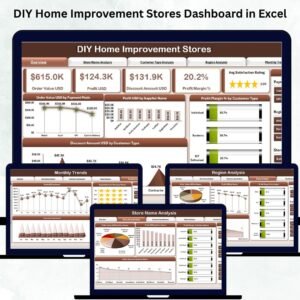
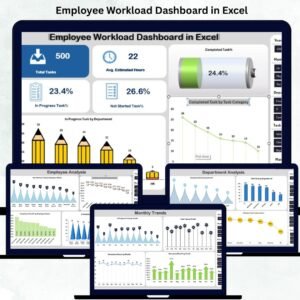
📊 KPI Cards for Instant Insights – View cost, revenue, profit & ratings at a glance
🎯 Right-Side Slicers – Filter content by region, subscription type, genre, or device
📺 Device Behavior Tracking – Analyze where users stream the most
🌎 Region Performance Analytics – Understand profitable regions and emerging markets
📈 Dynamic Trend Charts – Compare cost, rating & profit month-by-month
📘 Support & Data Sheets – Organized backend structure for clean data management
💡 Fully Customizable – Add new genres, devices, or metrics anytime
🖥️ Easy Navigation – Page navigator on the left for smooth user experience
With everything organized and automated, this dashboard becomes your streaming performance control center.
What’s Inside the VoD Dashboard in Excel 📂
This dashboard is made up of five powerful analytical pages:
📌 Overview Page
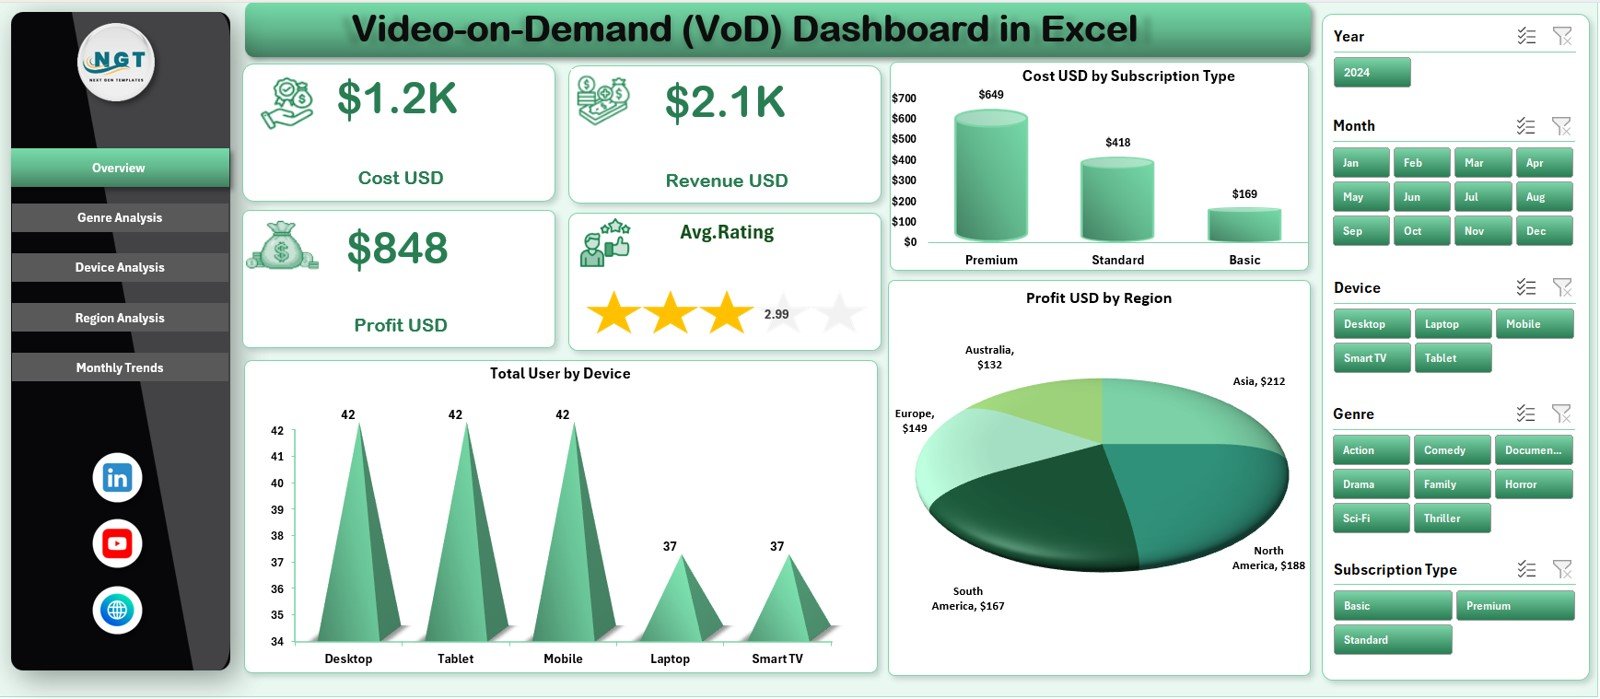
The main summary of all performance KPIs. Includes:
-
Cost USD
-
Revenue USD
-
Profit USD
-
Average Rating
-
Cost by Subscription Type
-
Total Users by Device
-
Profit by Region
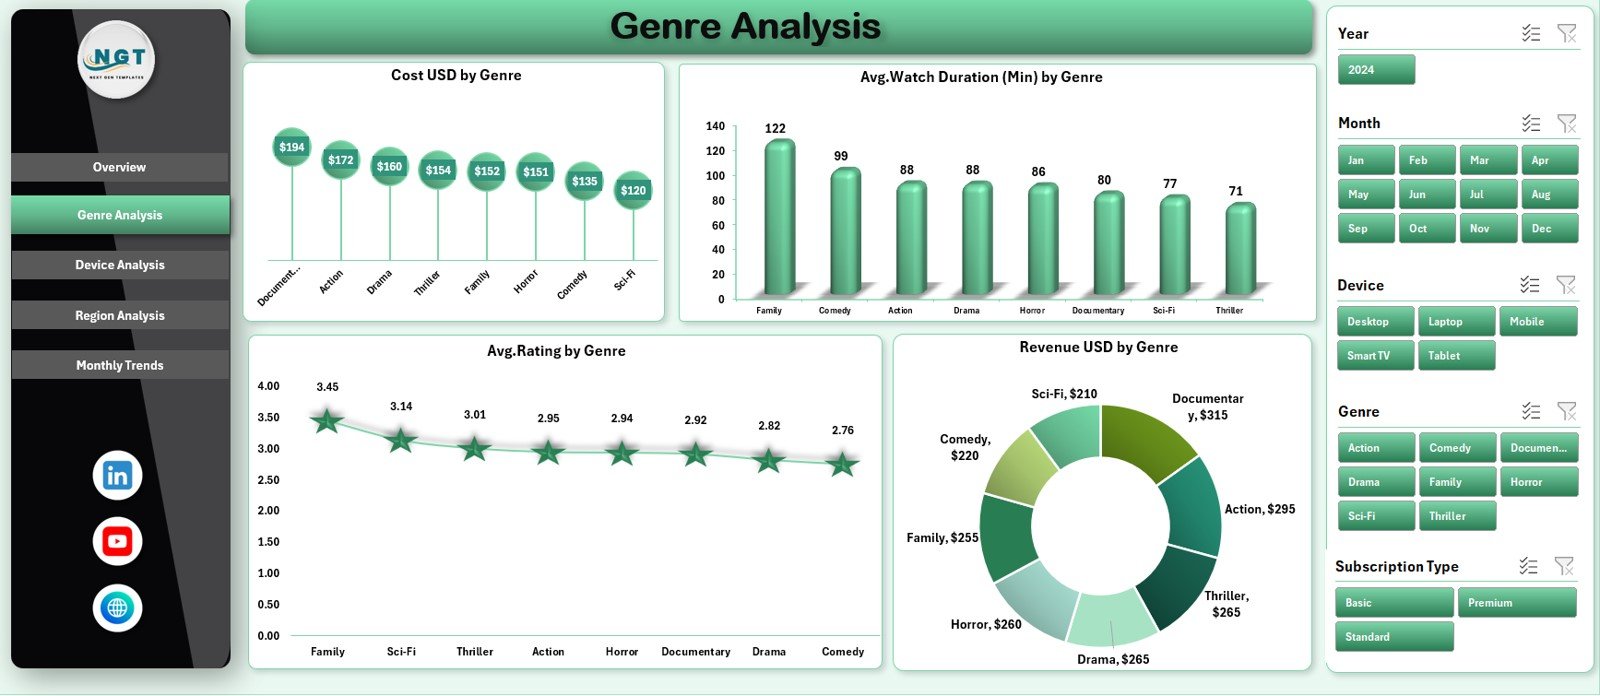
📌 Genre Analysis Page
See which content genres generate the most engagement and profit:
-
Cost by Genre
-
Watch Duration by Genre
-
Average Rating by Genre
-
Revenue by Genre
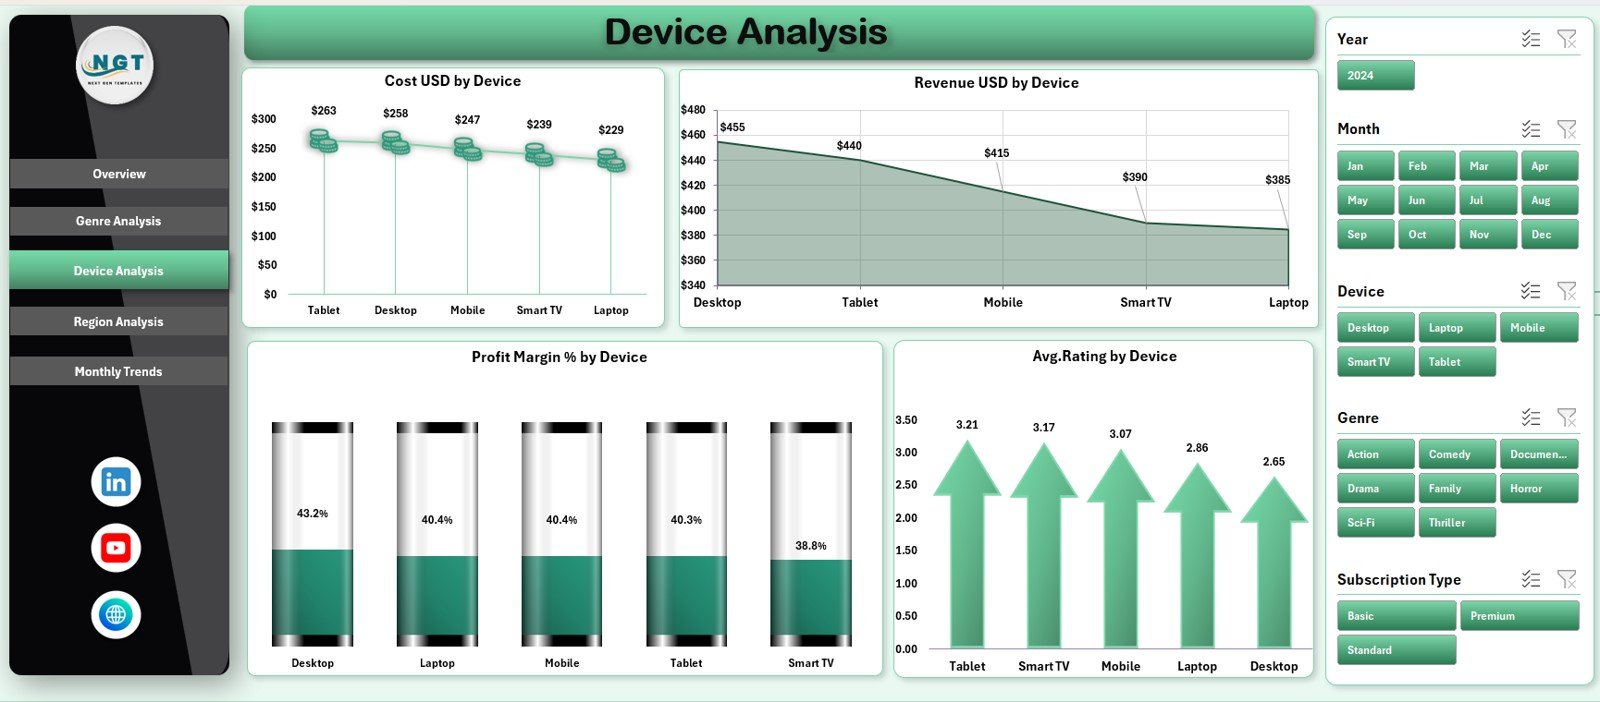
📌 Device Analysis Page
Understand how each device contributes to performance:
-
Cost by Device
-
Revenue by Device
-
Profit Margin % by Device
-
Rating by Device
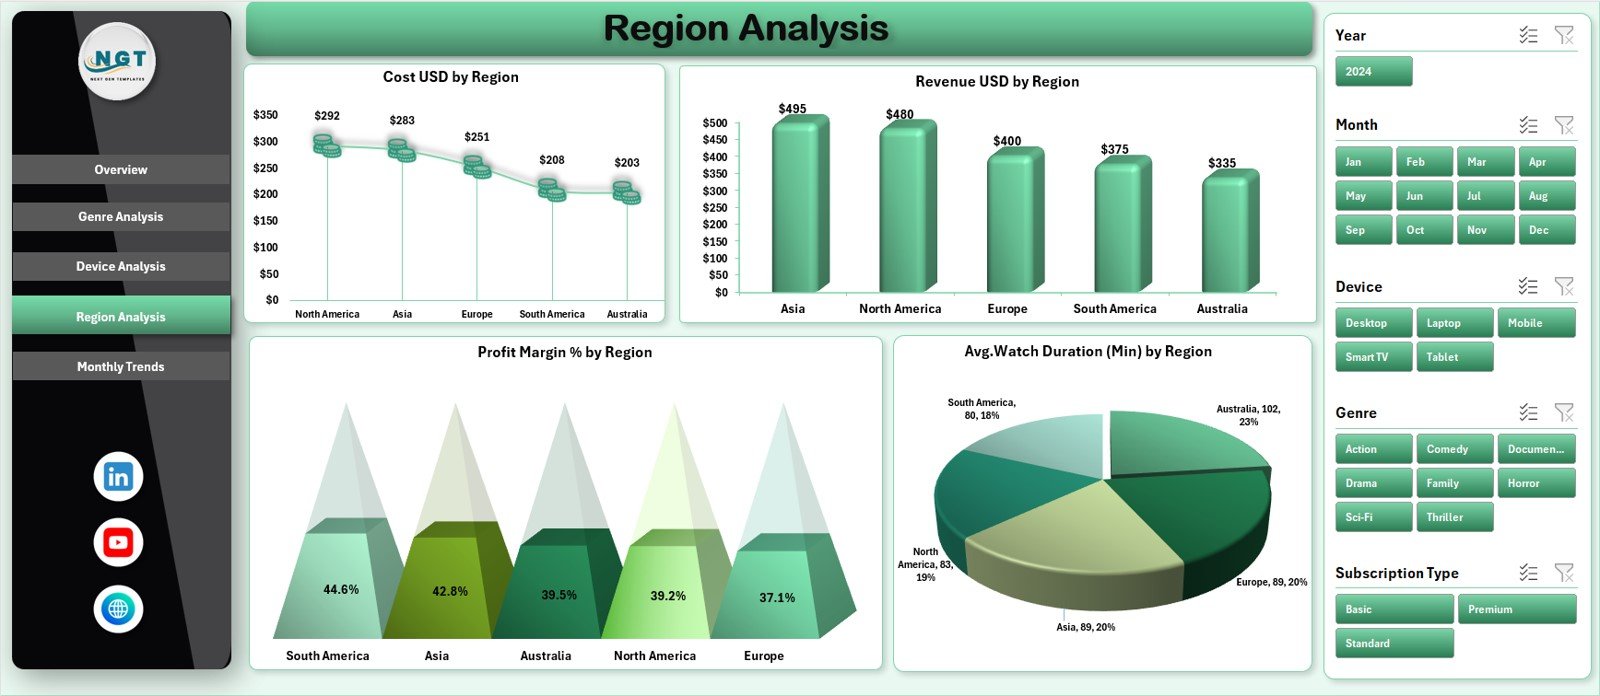
📌 Region Analysis Page
Crucial for expansion planning and market strategy:
-
Cost by Region
-
Revenue by Region
-
Profit Margin % by Region
-
Watch Duration by Region
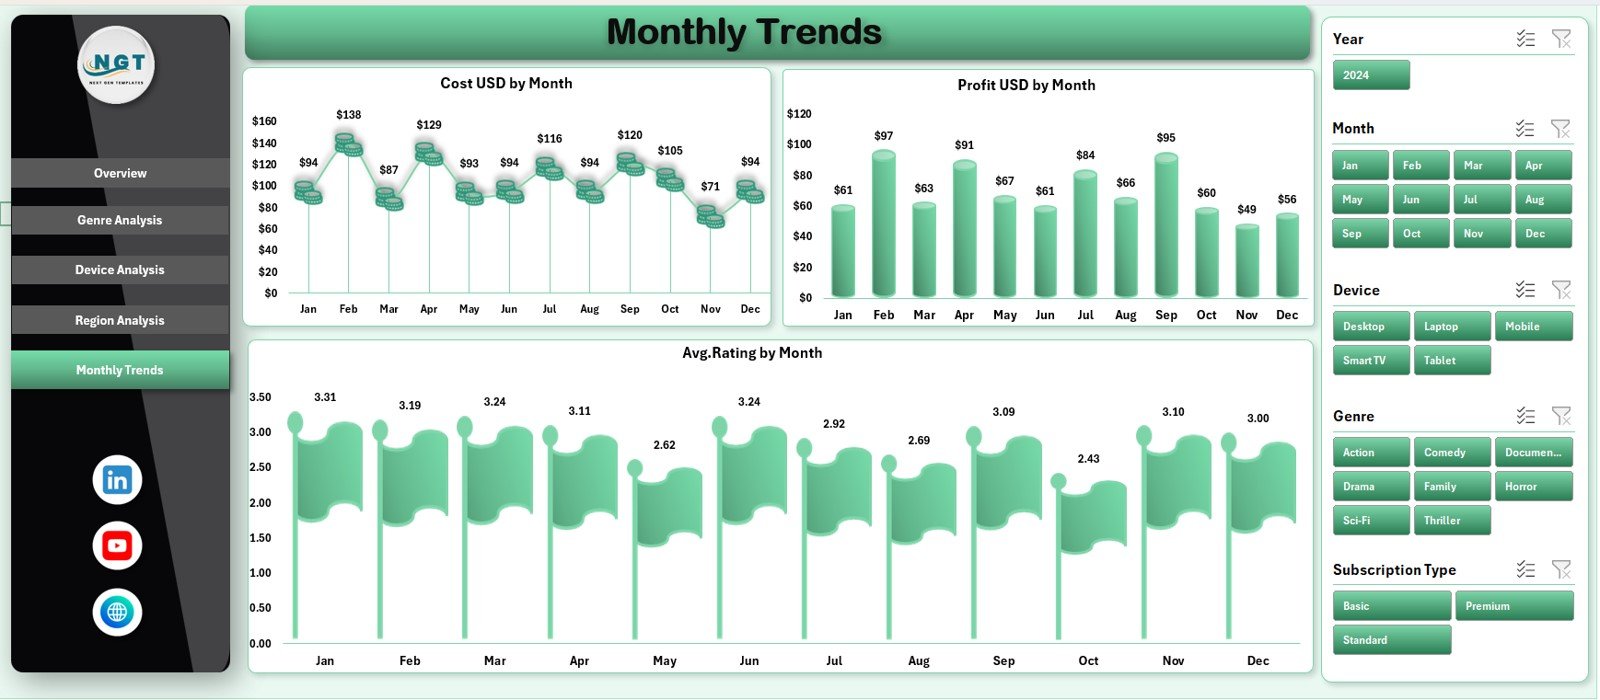
📌 Monthly Trends Page
Track growth, budget patterns, and customer satisfaction over time:
-
Cost by Month
-
Profit by Month
-
Average Rating by Month
Plus:
✔ Support Sheet – Internal calculations
✔ Data Sheet – Clean storage for all VoD metrics
Everything works together to provide a complete 360° view of platform performance.
How to Use the Video-on-Demand (VoD) Dashboard in Excel 🛠️
Using the dashboard is simple and fast:
1️⃣ Open the Data Sheet and enter updated values
2️⃣ Refresh the dashboard (Excel auto-updates)
3️⃣ Use slicers to filter by genre, device, region, or subscription type
4️⃣ Explore charts and KPI cards on each page
5️⃣ Compare cost, revenue, rating & profitability instantly
6️⃣ Use Monthly Trends for forecasting and budgeting
Zero coding. Zero complexity. Just clear analytics for better decisions. ⚡
Who Can Benefit from This VoD Dashboard? 👥
This dashboard is ideal for all streaming professionals:
🎬 VoD Platforms – Track real-time performance
📈 Business Analysts – Study user behavior & trends
💰 Finance Teams – Monitor cost, revenue & profit margins
🎥 Content Strategy Teams – Identify winning genres
🛠️ Technical Teams – Improve device performance
🌎 Marketing Teams – Analyze region-specific user behavior
If your platform wants stronger visibility, faster reporting, and smarter decision-making—this dashboard is the perfect fit.


Reviews
There are no reviews yet.