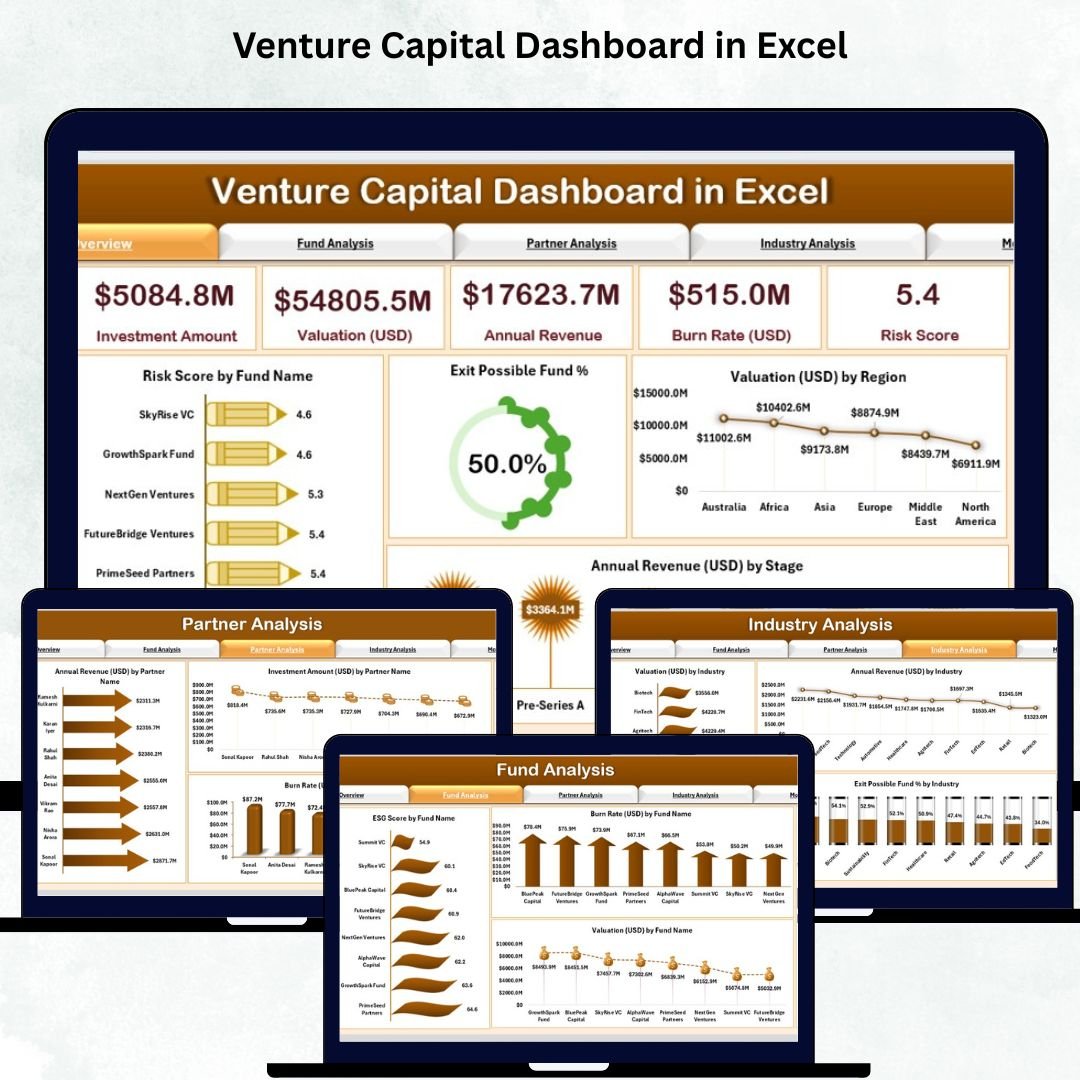
Managing venture capital data shouldn’t feel overwhelming—but for most teams, it does. Scattered spreadsheets, manual reports, inconsistent updates, and lack of visibility make fund tracking complex and slow. The Venture Capital Dashboard in Excel transforms this entire workflow into a powerful, visual, and fast-performing analytics system. It brings all portfolio KPIs—valuations, industry trends, partner performance, exit probability, burn rates, and monthly movements—into one clean dashboard you can use with confidence.
This ready-to-use Excel dashboard gives venture capital professionals everything they need to analyze performance instantly. With dynamic slicers, automated visuals, and professional-grade charts, you can make decisions faster, improve portfolio strategy, and present insights like a top-tier VC analyst.
✨ Key Features of the Venture Capital Dashboard in Excel
This dashboard is packed with powerful features designed specifically for VC teams and investment professionals.
📊 5 Performance Cards for Instant Visibility
You instantly see essential KPIs such as:
-
⭐ Risk Score
-
💼 Exit Possible Fund %
-
💲 Valuation (USD)
-
🌍 Revenue by Region
-
📈 Industry Performance Indicators
🎛 Smart Slicers for Fast Filtering
Switch views by:
-
Fund Name
-
Partner
-
Industry
-
Stage
-
Month
-
Region
📉 Advanced Charts & Visuals
Interactive charts help you compare:
-
Valuation trends
-
ESG score
-
Burn rate
-
Revenue by stage
-
Exit probability by industry
📁 Page Navigator
Jump between pages with a single click—no scrolling or searching for sheets.
📦 What’s Inside the Venture Capital Dashboard
This dashboard contains five powerful analytical pages that give you a complete 360° view of the venture capital ecosystem.
1️⃣ Overview Page
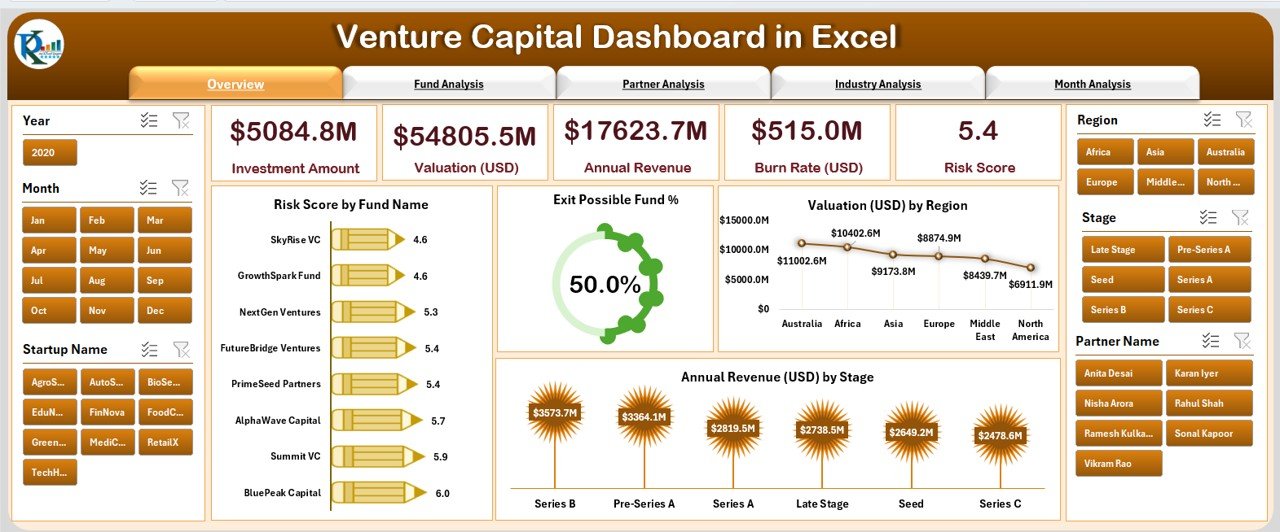
Your high-level snapshot of the full portfolio.
You’ll see:
-
Risk Score by Fund Name
-
Exit Possible Fund %
-
Valuation by Region
-
Annual Revenue by Stage
This page helps you understand fund health instantly.
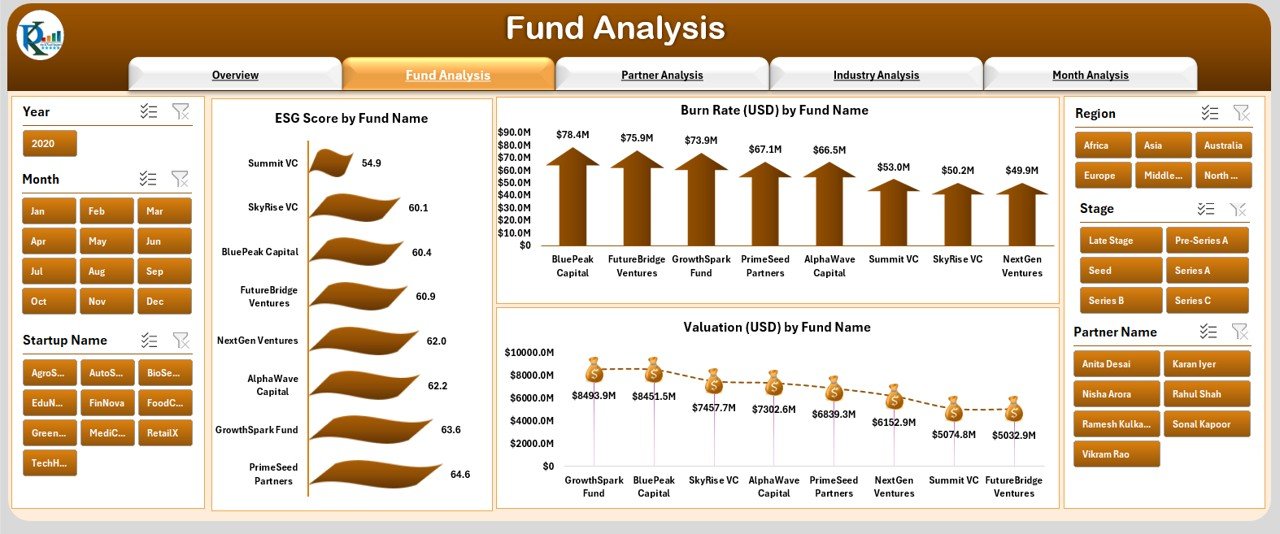
2️⃣ Fund Analysis Page
Dive deeper into fund-level metrics.
Charts include:
-
ESG Score by Fund
-
Burn Rate by Fund
-
Individual Fund Valuation
Perfect for tracking responsible investing metrics, cost movement, and valuation growth.
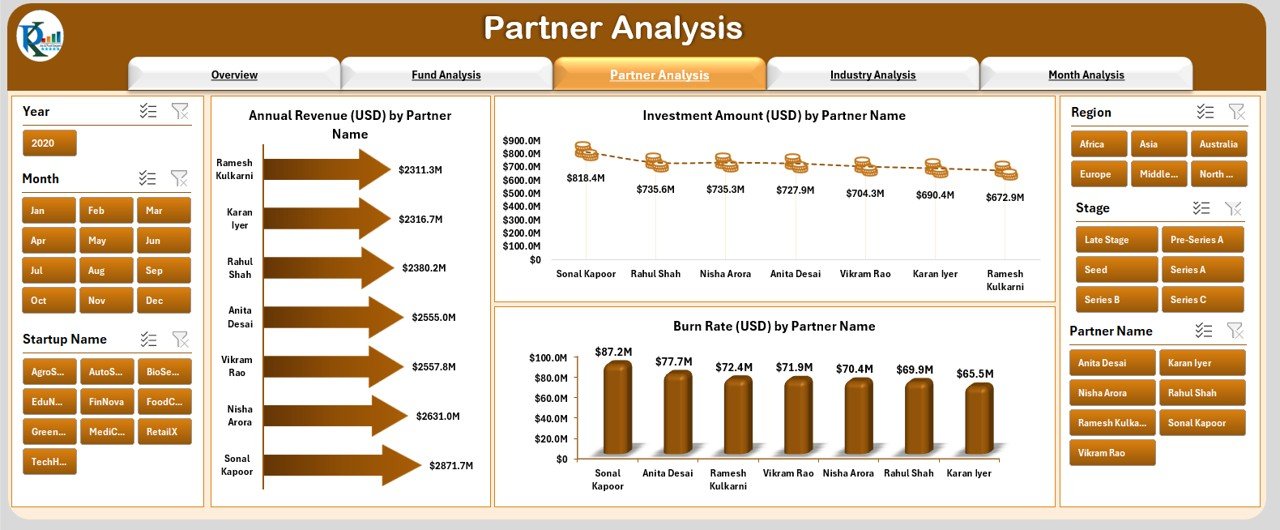
3️⃣ Partner Analysis Page
See how every partner contributes financially.
Includes:
-
Annual Revenue by Partner
-
Investment Amount by Partner
-
Burn Rate by Partner
Essential for partner reviews, compensation planning, and workload distribution.
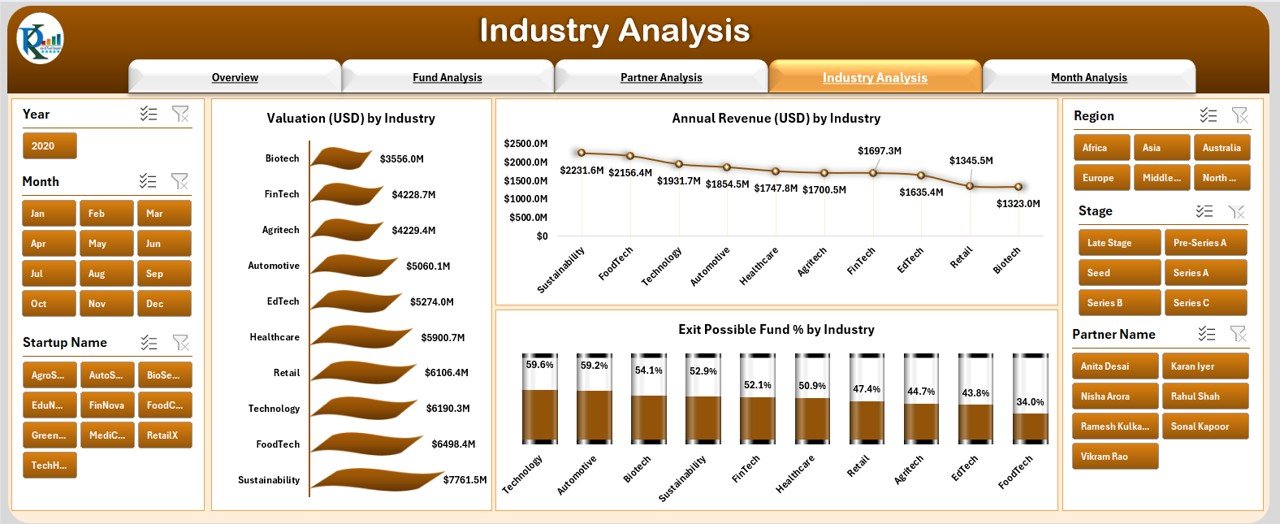
4️⃣ Industry Analysis Page
Understand industry-level trends across your portfolio.
Charts show:
-
Valuation by Industry
-
Revenue by Industry
-
Exit Possible Fund % by Industry
Excellent for spotting high-growth sectors and future investment opportunities.
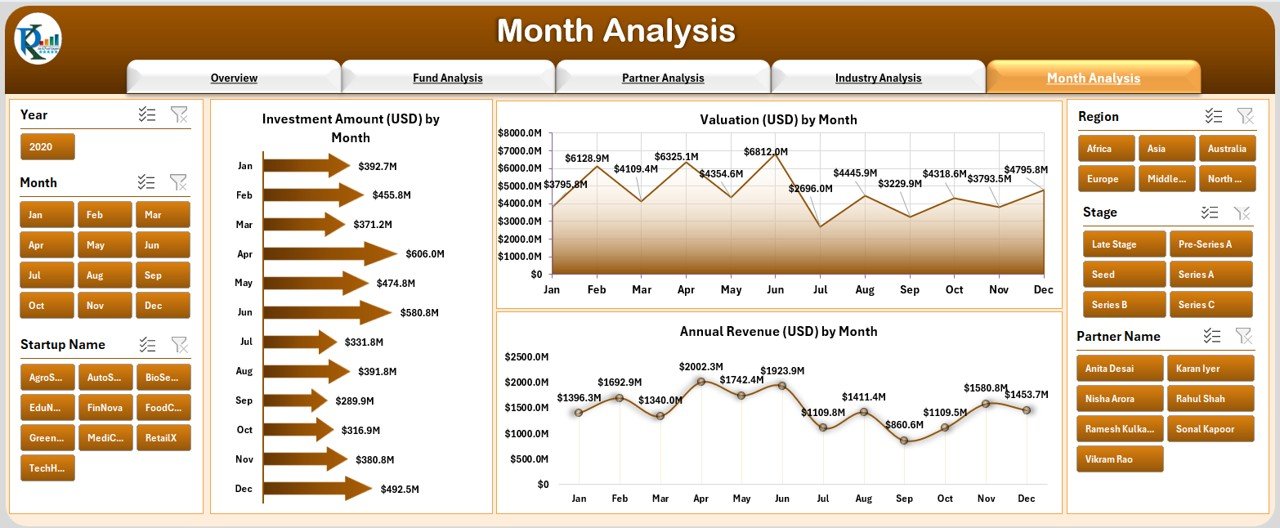
5️⃣ Month Analysis Page
Track performance movements across months.
See:
-
Investment Amount by Month
-
Valuation by Month
-
Revenue by Month
Useful for forecasting, budgeting, and trend analysis.
🛠 How to Use the Venture Capital Dashboard in Excel
Using this dashboard is extremely simple:
-
Update the Data Sheet with fund details, valuations, ESG scores, investment amounts, partners, industries, and monthly metrics.
-
The dashboard refreshes automatically—no manual updates required.
-
Use slicers to filter by fund, partner, industry, stage, or month.
-
Navigate through pages using the left-side menu.
-
Present insights directly to investors, partners, or leadership in meetings.
👥 Who Can Benefit from This Venture Capital Dashboard?
This template is built for every role inside the VC ecosystem:
-
🚀 Venture Capital Analysts – Fast analysis & reporting
-
💼 Fund Managers – Clear insights for investment decisions
-
📊 Investors & LPs – Transparent fund performance
-
🧮 Financial Consultants – Portfolio review & valuation analysis
-
🧩 Startup Incubators – Tracking multiple industries & partners
-
🏢 Private Equity Teams – Deal evaluation & trend forecasting
If you manage investments, this dashboard becomes your most important analytical partner.
### Click hare to read the Detailed blog post
Visit our YouTube channel to learn step-by-step video tutorials
👉 Youtube.com/@PKAnExcelExpert


Reviews
There are no reviews yet.