Managing vacation rentals is no longer simple. Competition is rising. Guest expectations are increasing. Pricing changes weekly. If you still depend on scattered spreadsheets, you are leaving money on the table.
That is exactly why the Vacation Rentals KPI Dashboard in Excel is a game-changing solution.
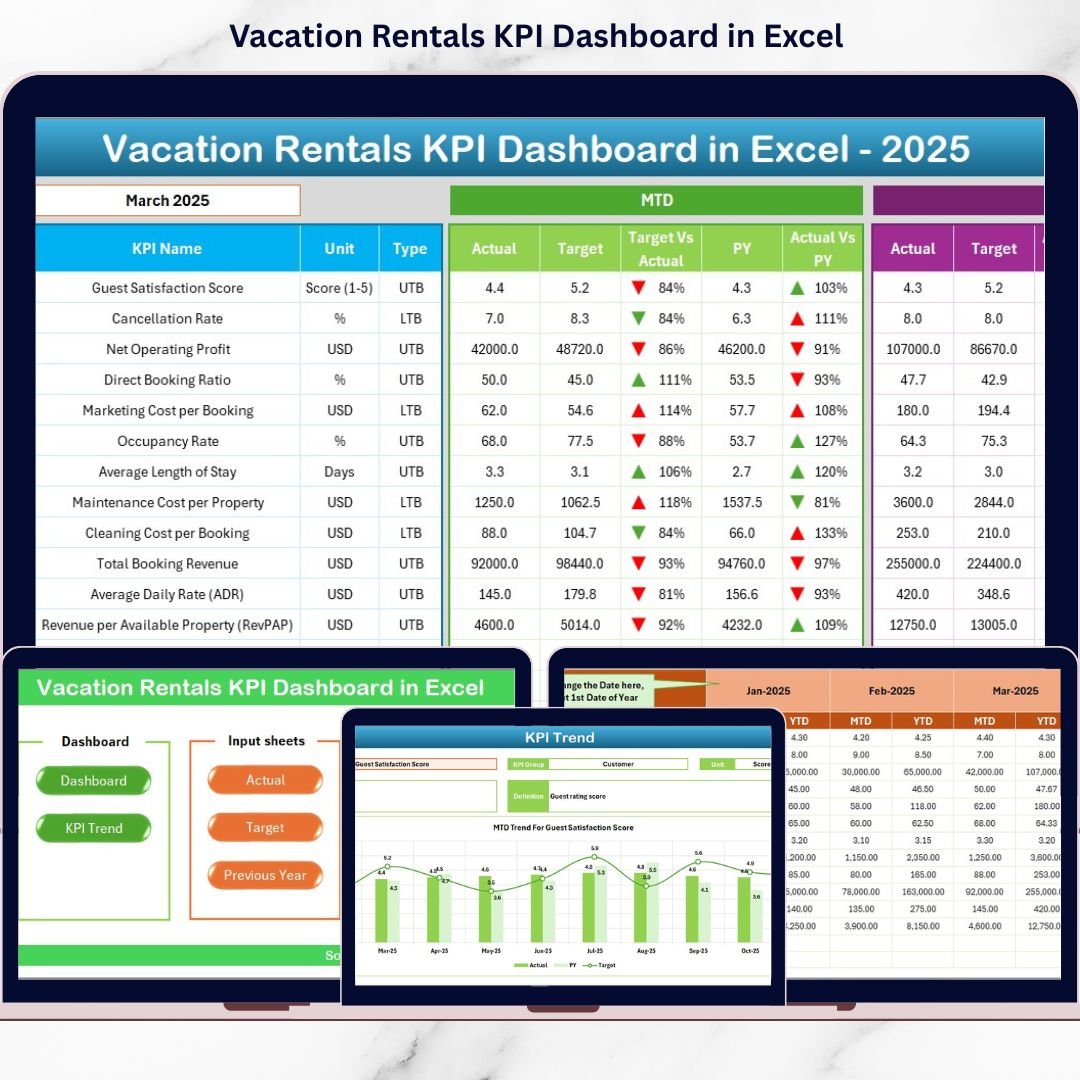
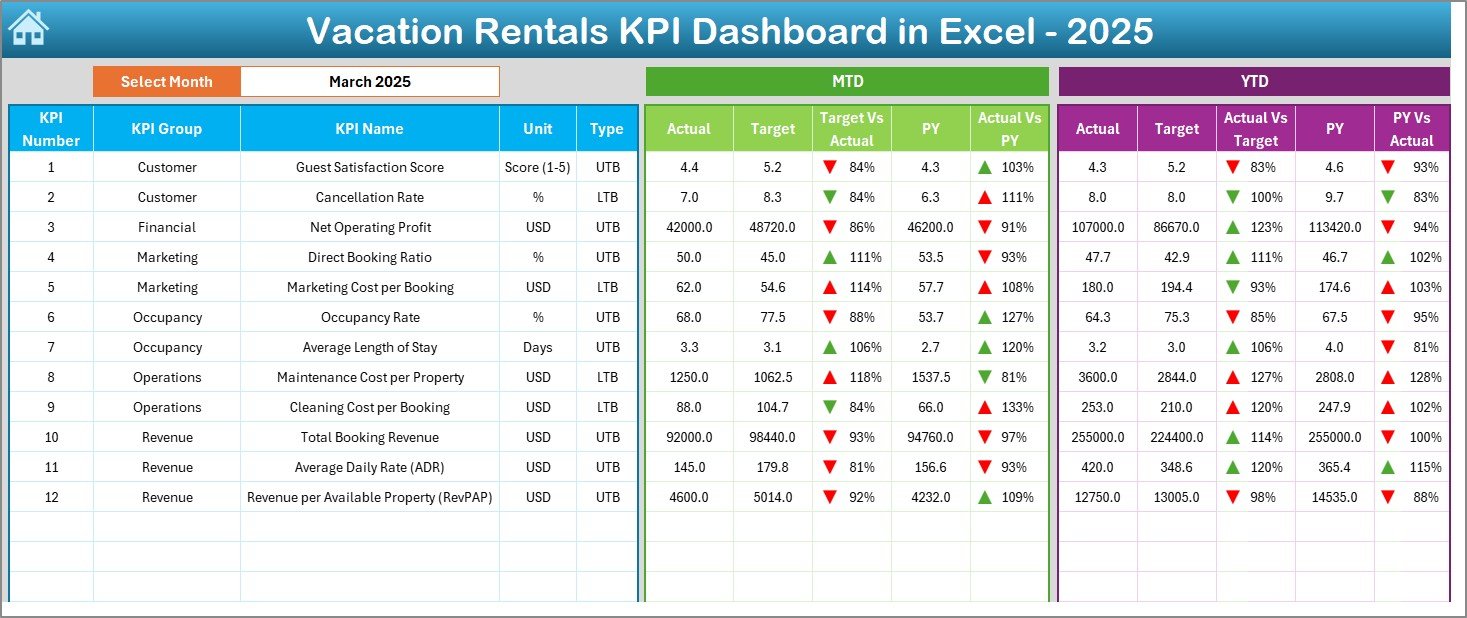
This ready-to-use Excel dashboard transforms raw rental data into powerful, easy-to-read insights. Instead of checking multiple files, you get one structured system that tracks occupancy, revenue, ADR, RevPAR, cancellation rates, and more — all in one place.
It allows you to monitor MTD, YTD, Target vs Actual, and Previous Year comparisons instantly. As a result, you make smarter and faster decisions.
🚀 Key Features of Vacation Rentals KPI Dashboard in Excel
📊 Dynamic Month Selection – Select any month from the dropdown and watch the entire dashboard update instantly.
📈 MTD & YTD Performance Tracking – Monitor real-time progress against targets and previous year performance.
🎯 Target vs Actual Comparison – Instantly see if you are meeting revenue and occupancy goals.
📉 Conditional Formatting Arrows – Green and red indicators highlight performance improvement or decline.
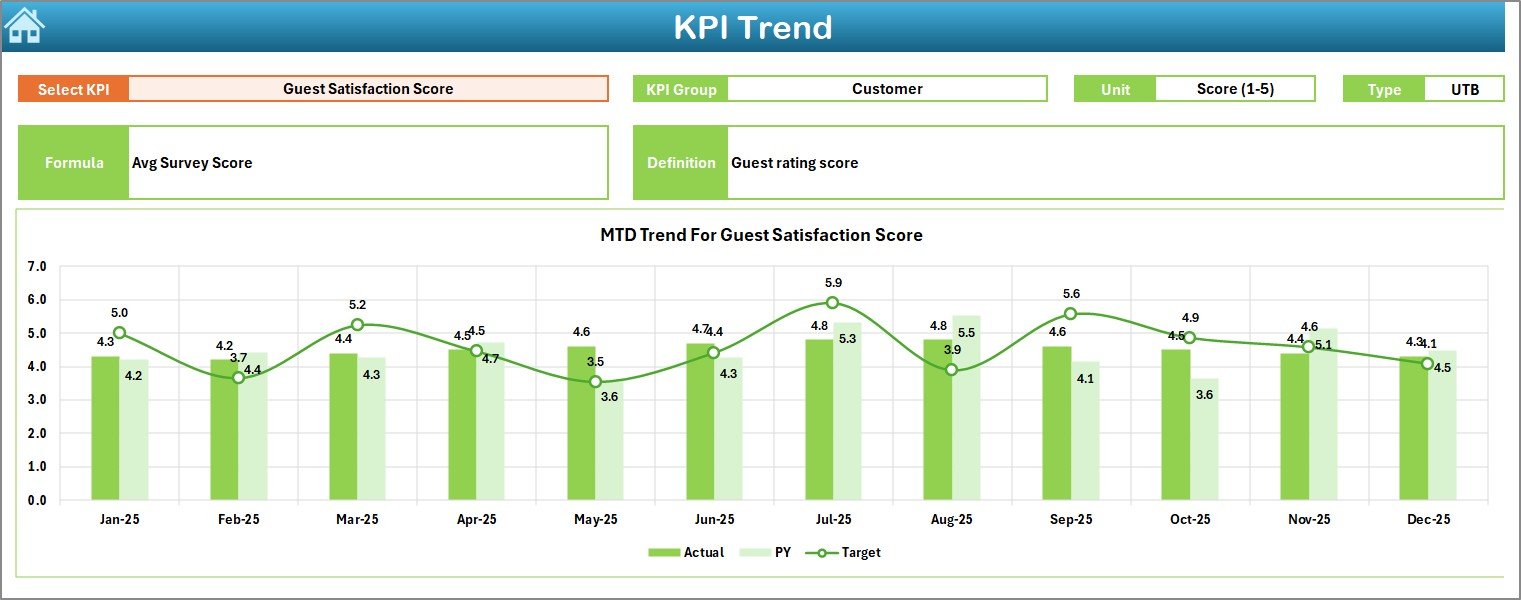
📊 Interactive Trend Charts – Visual MTD and YTD trend charts for proactive decision-making.
📂 7 Structured Worksheets – Clean layout with separate sheets for inputs, targets, historical data, and KPI definitions.
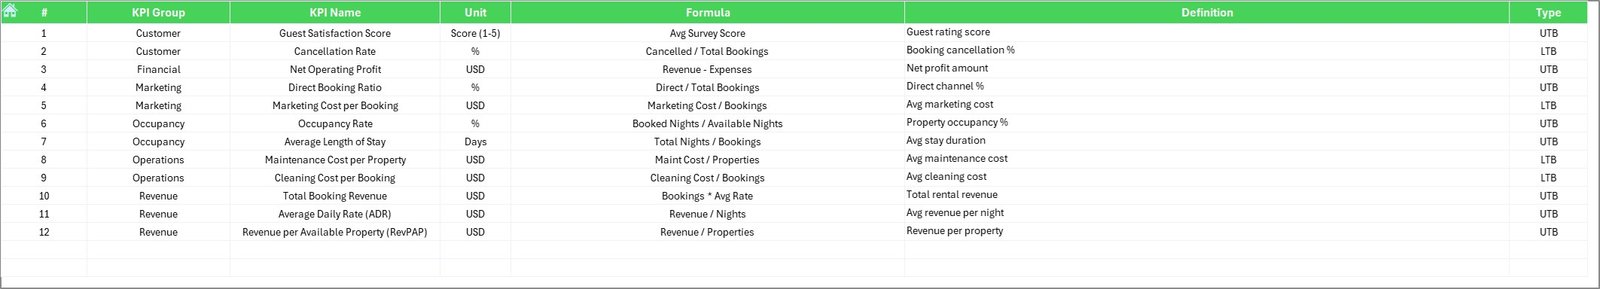
🔍 KPI Drill-Down Analysis – Select any KPI and review its formula, type (UTB/LTB), and definition.
📦 What’s Inside the Vacation Rentals KPI Dashboard in Excel
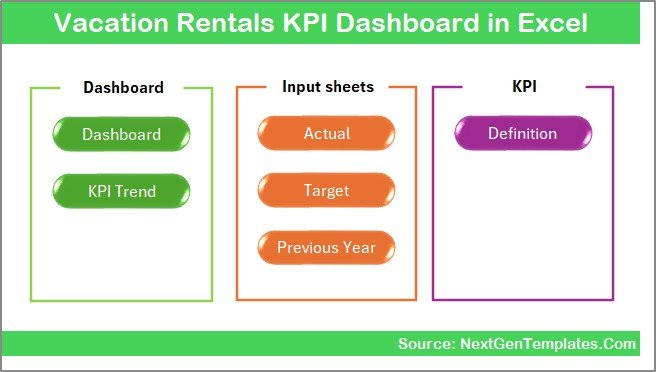
You get a professionally structured Excel system including:
✔️ Summary Page – Navigation center with quick-access buttons
✔️ Main Dashboard Sheet – Core performance overview
✔️ Trend Analysis Sheet – KPI-level trend charts
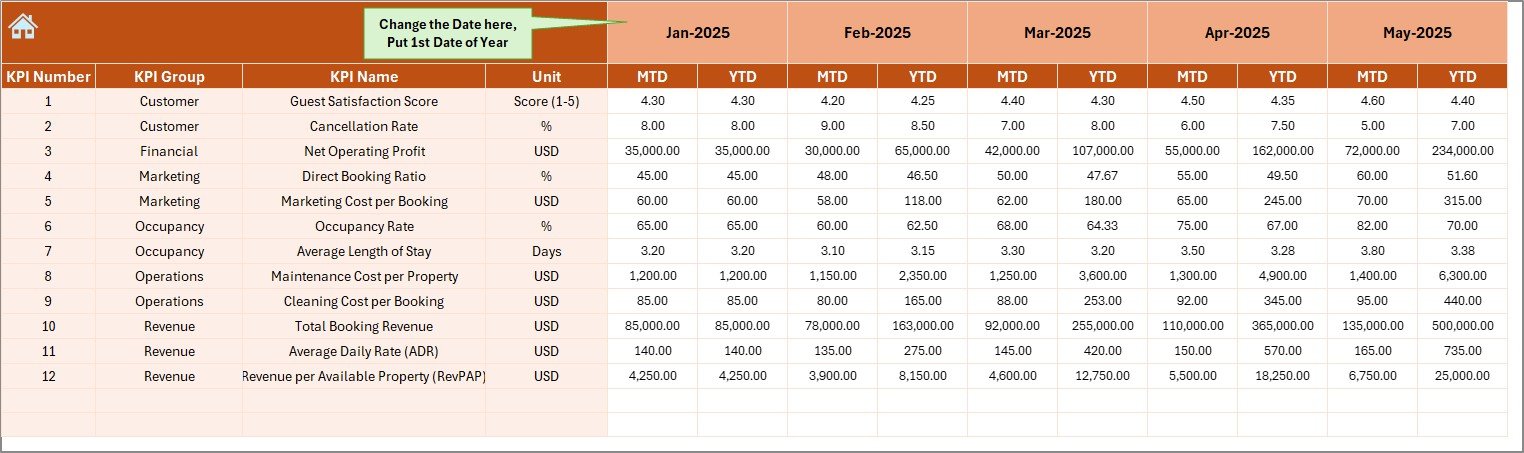
✔️ Actual Numbers Input Sheet – Monthly data entry section
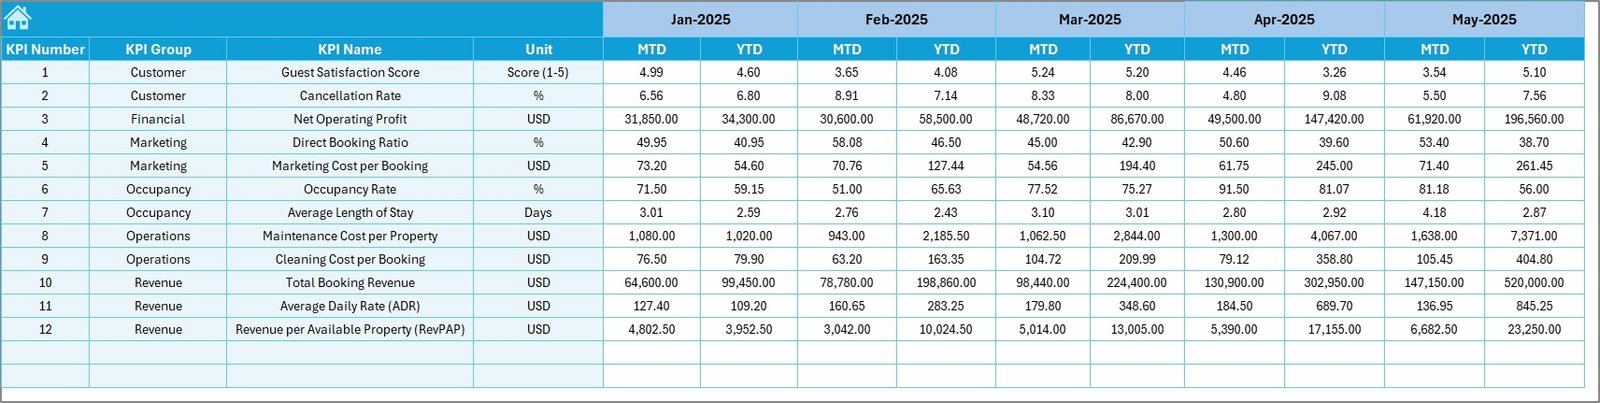
✔️ Target Sheet – MTD and YTD target setup
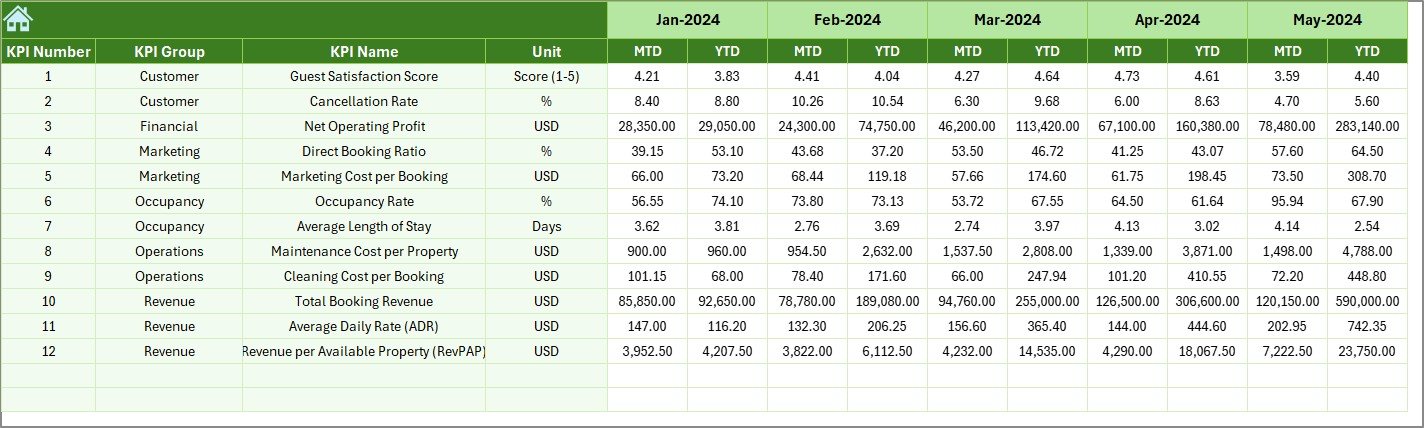
✔️ Previous Year Sheet – Historical performance comparison
✔️ KPI Definition Sheet – Organized KPI library
All sheets connect dynamically. Once you enter data correctly, everything updates automatically.
🛠️ How to Use the Vacation Rentals KPI Dashboard
Using this dashboard is simple:
1️⃣ Enter the starting month of your financial year.
2️⃣ Input monthly actual numbers.
3️⃣ Add targets and previous year data.
4️⃣ Select the desired month from the dropdown.
5️⃣ Review MTD, YTD, and comparison results instantly.
Because the dashboard uses structured formulas and conditional formatting, you eliminate manual calculations.
🎯 Who Can Benefit from This Vacation Rentals KPI Dashboard
This dashboard is ideal for:
🏡 Airbnb Hosts
🏢 Vacation Rental Managers
🏨 Resort Operators
📊 Hospitality Consultants
💼 Short-Term Rental Investors
🏠 Property Management Agencies
If you manage one property or multiple listings, this tool helps you stay in control.
💡 Why This Dashboard Boosts Profitability
This dashboard does more than show numbers.
It helps you:
✔️ Identify low occupancy months early
✔️ Detect rising cancellation trends
✔️ Monitor ADR and RevPAR performance
✔️ Compare current year with previous year
✔️ Control cleaning and maintenance costs
✔️ Adjust pricing strategies proactively
Instead of reacting late, you act in advance.
That means better revenue control and higher profitability.
🏆 Why Choose Excel for KPI Tracking?
Excel remains powerful and flexible. It supports:
✔️ Dynamic formulas
✔️ Conditional formatting
✔️ Trend charts
✔️ Easy customization
✔️ No subscription dependency
✔️ Offline access
You do not need advanced Excel skills. Basic knowledge is enough.
If you want structured reporting, clear performance visibility, and smarter decision-making, this dashboard gives you everything in one organized system.
Stop guessing. Start managing your vacation rentals like a professional.
Click here to read the Detailed blog post
Watch the step-by-step video tutorial: