Managing vacation rentals is no longer just about welcoming guests—it’s about balancing occupancy, maximizing revenue, and ensuring guest satisfaction in a highly competitive travel market. The Vacation Rental KPI Dashboard in Power BI is the ultimate solution for property managers, agencies, and individual hosts who want to track performance with accuracy and ease.
Powered by a structured Excel input and designed in Power BI, this ready-to-use dashboard consolidates all the key KPIs—occupancy rate, ADR, cancellations, repeat guests, and more—into a single interactive platform. Instead of working with static spreadsheets, you’ll gain real-time insights and visual clarity to make data-driven decisions that boost profitability and enhance guest experience.
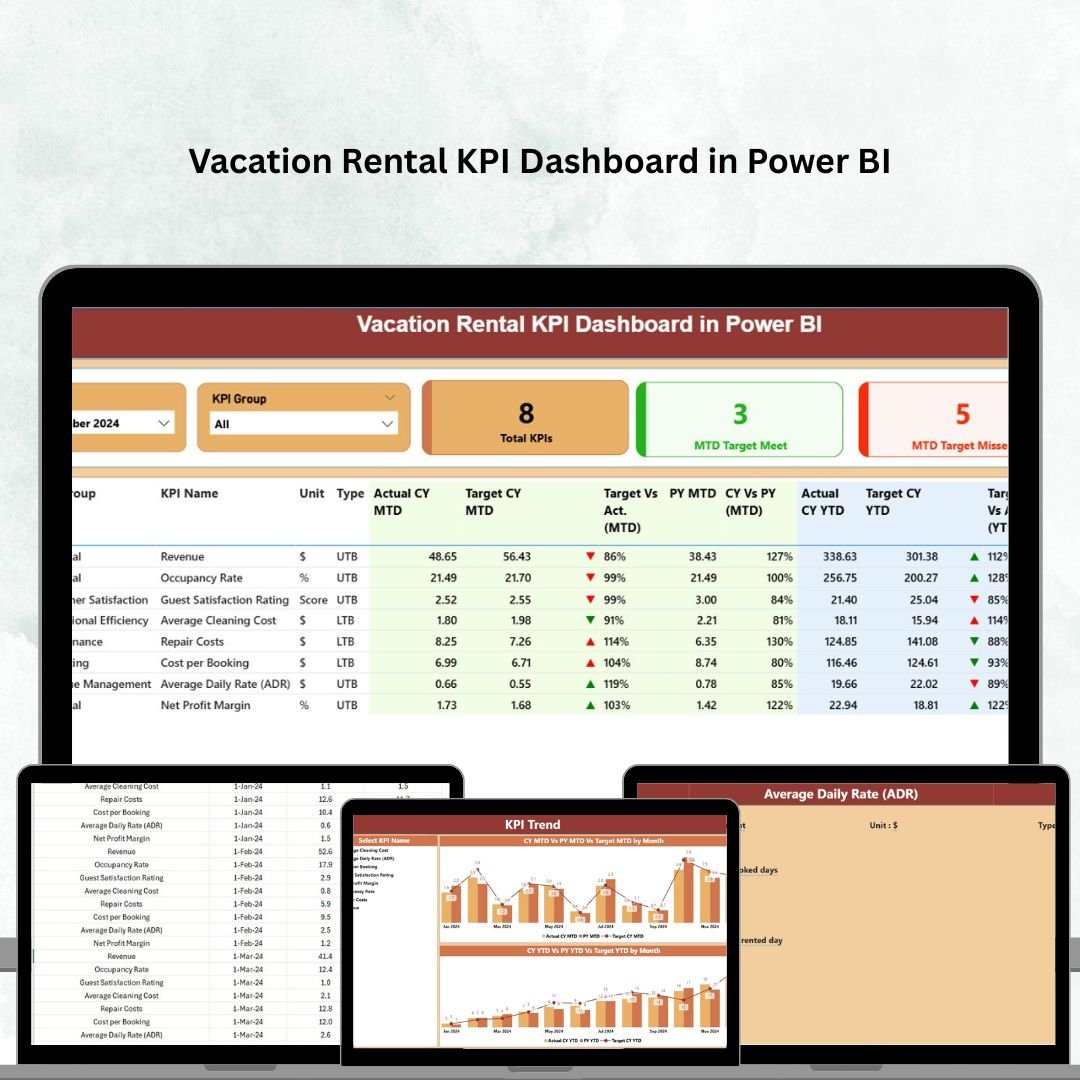
✨ Key Features of the Vacation Rental KPI Dashboard
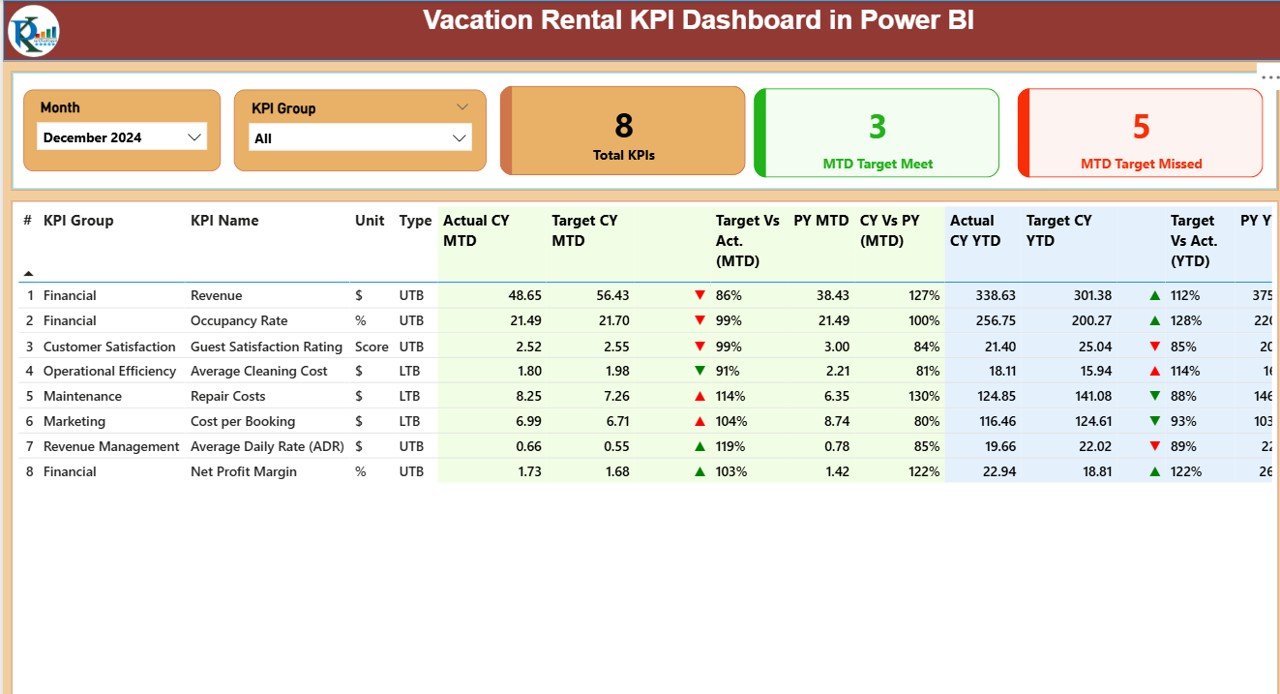
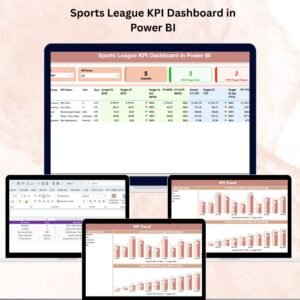
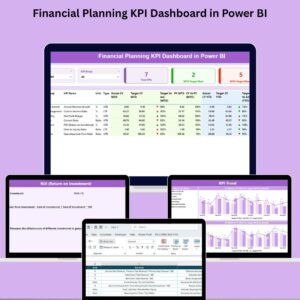
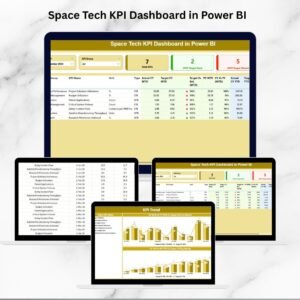
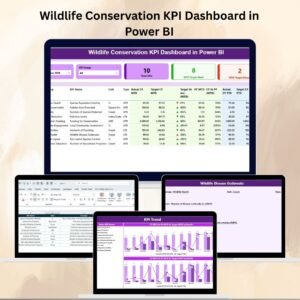
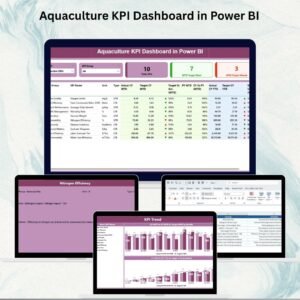
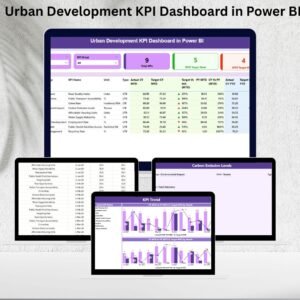
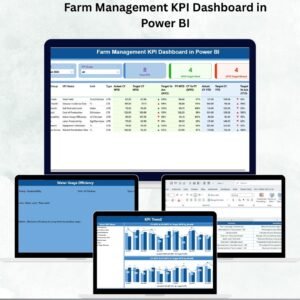
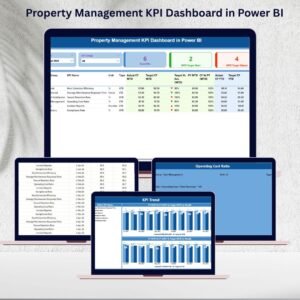
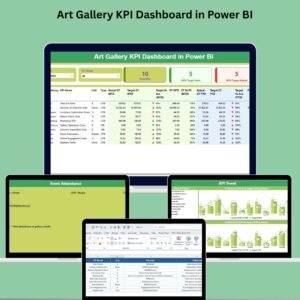
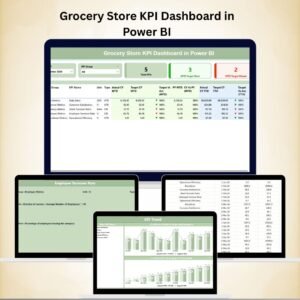
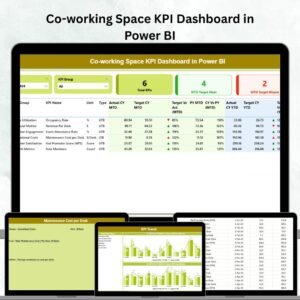
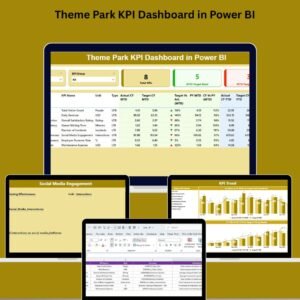
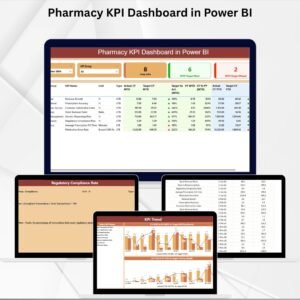
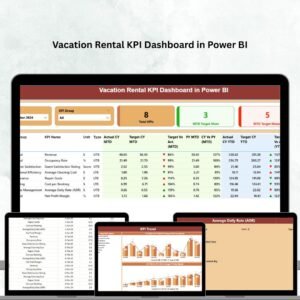
✅ Summary Page – Quick snapshot of your business with KPI Group slicers, highlight cards, and a detailed KPI table.
✅ Interactive Cards – Track total KPIs, MTD target met, and MTD target missed at a glance.
✅ Detailed KPI Table – Includes KPI Number, Name, Unit, Type (UTB/LTB), Actual vs Target values, performance %, and ▲ ▼ indicators.
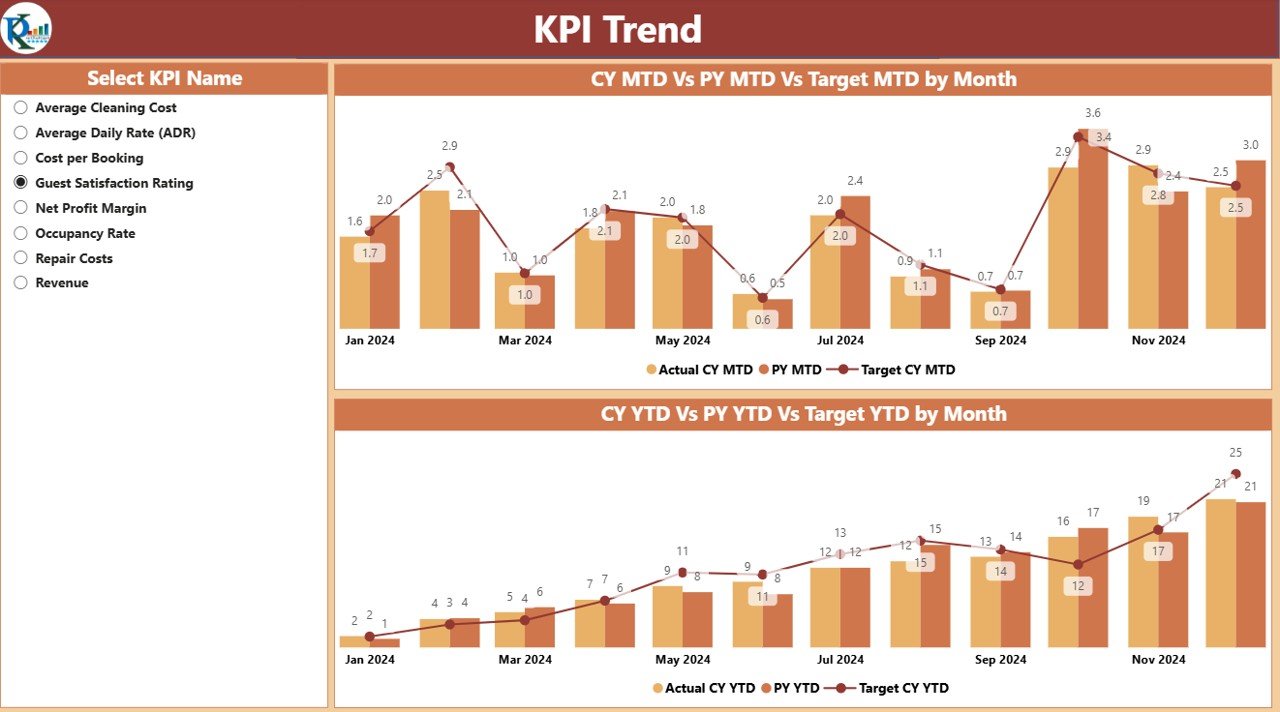
✅ KPI Trend Page – Combo charts for MTD and YTD trends, comparing Current Year, Previous Year, and Target.
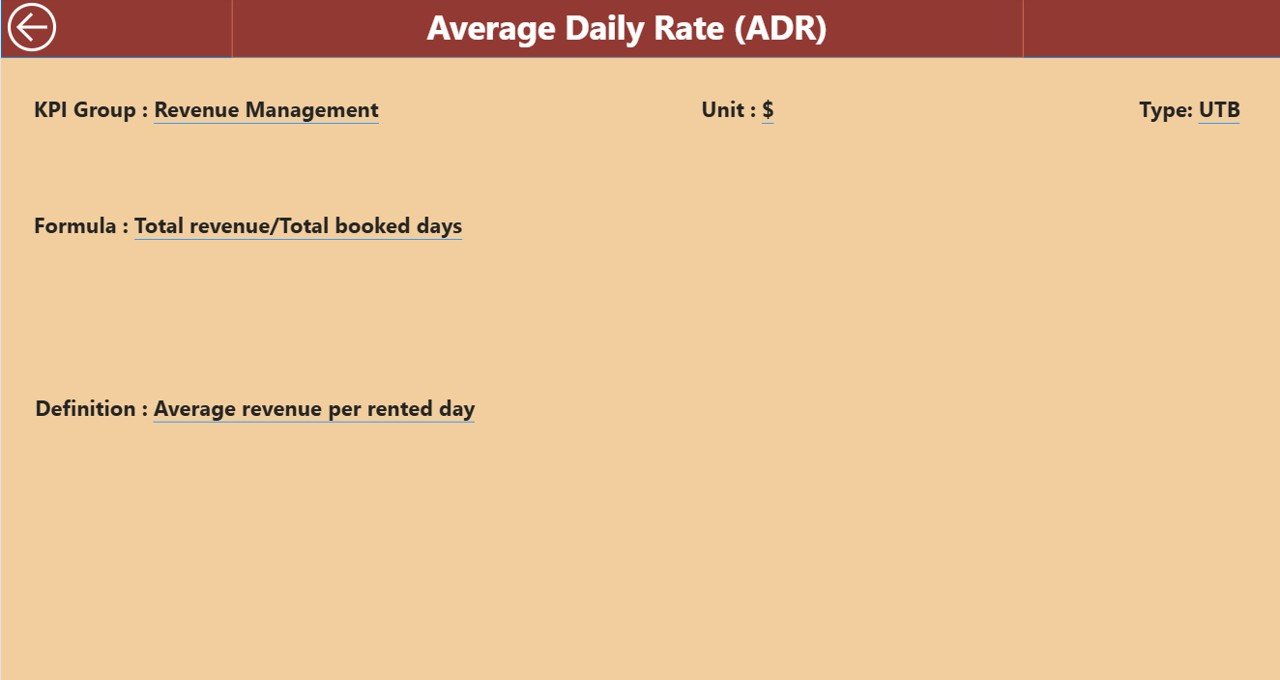
✅ KPI Definition Page – Built-in glossary with KPI formulas, definitions, and units for transparency.
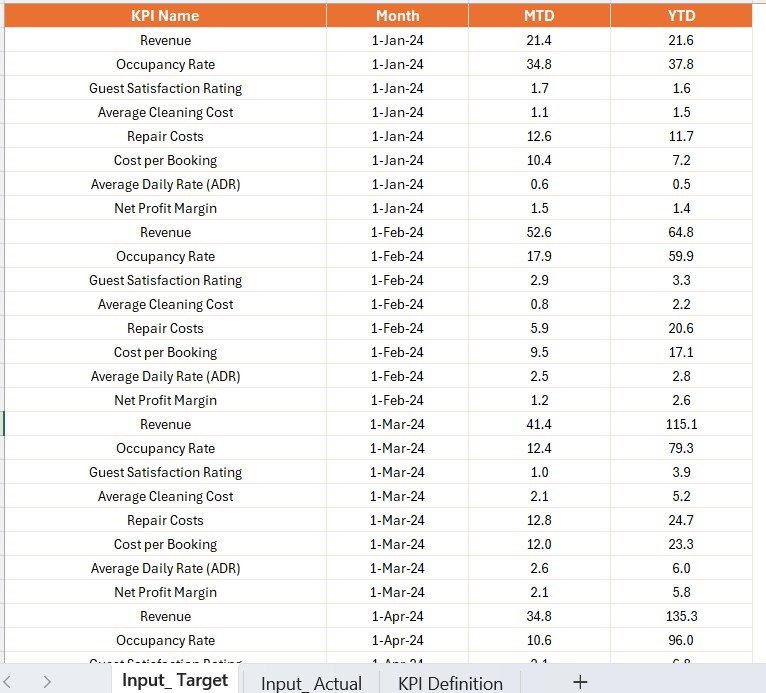
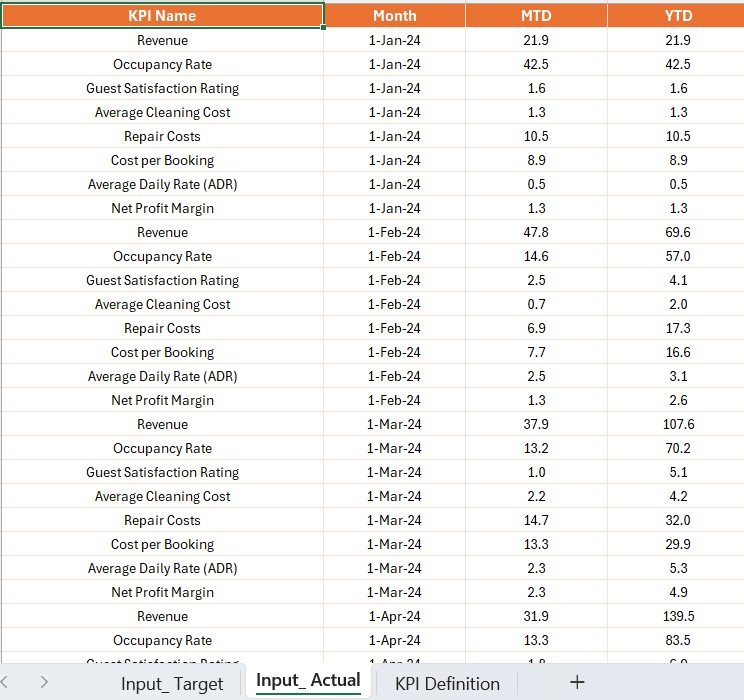
✅ Excel Data Source Integration – Structured sheets (Input_Actual, Input_Target, KPI Definition) make updating simple.
✅ Scalable & Flexible – Perfect for managing 5 rentals or scaling up to 500 properties.
✅ Real-Time Insights – Refresh Power BI with updated Excel data for instant performance monitoring.
📂 What’s Inside the Dashboard
This professional solution is designed with three core Power BI pages:
-
Summary Page 📊 – KPI slicers, highlight cards, detailed KPI table with targets vs actuals, and YoY comparisons.
-
KPI Trend Page 📈 – Visualize trends over time with combo charts for MTD and YTD numbers. Spot seasonal highs, lows, and booking cycles.
-
KPI Definition Page 📖 – Ensure consistency and clarity with formulas and definitions. Drill-through from the summary and return easily.
Behind the scenes, the dashboard is powered by an Excel file with three structured worksheets:
-
Input_Actual: Actual KPI values by month.
-
Input_Target: Target KPI values by month.
-
KPI Definition: Complete reference for all KPIs.
🛠️ How to Use the Vacation Rental KPI Dashboard
-
Update Excel Data – Enter monthly Actual and Target values.
-
Refresh Power BI – Import Excel and update visuals instantly.
-
Review Summary Page – Track performance vs target with color-coded indicators.
-
Analyze Trends – Use combo charts to spot seasonality and long-term growth.
-
Check KPI Definitions – Ensure consistent understanding across the team.
-
Take Action – Adjust pricing, optimize occupancy, or improve guest satisfaction based on data.
👥 Who Can Benefit from This Dashboard?
🏠 Individual Hosts – Manage performance across a few properties.
🏢 Property Management Companies – Track occupancy, revenue, and guest satisfaction across multiple clients.
🌍 Vacation Rental Agencies – Monitor listings on Airbnb, Vrbo, or Booking.com.
🏖️ Resort Managers – Oversee multiple units with one consolidated view.
🏘️ Corporate Housing Providers – Manage occupancy, cancellations, and repeat guests.


Reviews
There are no reviews yet.