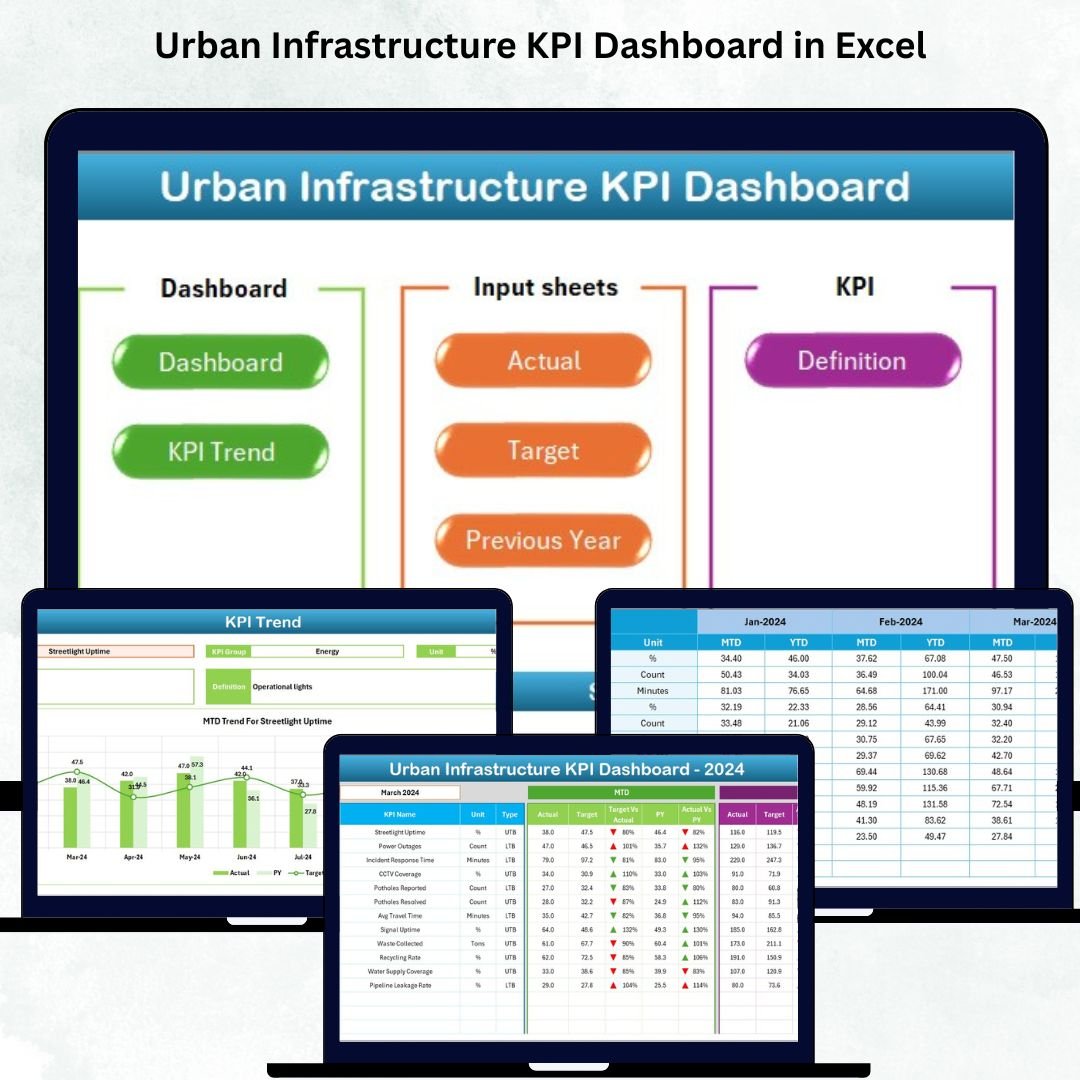

Managing a city is a massive responsibility. Roads, transport, water supply, waste management, power distribution, and community services all need continuous monitoring to keep a city safe, clean, and livable. But when performance data is scattered across spreadsheets and manual reports, city teams struggle to identify issues early, track progress, or make informed decisions. That’s why we created the Urban Infrastructure KPI Dashboard in Excel — a powerful, ready-to-use solution that brings all your key metrics into one simple, dynamic, and interactive dashboard.
This dashboard gives city managers, municipal corporations, engineering teams, and consultants a complete view of monthly and yearly performance. You can track MTD & YTD numbers, compare targets, view previous-year data, and analyze trends for any KPI with just a few clicks. Since the entire system runs in Excel, it remains cost-effective, beginner-friendly, and fully customizable.
⭐ Key Features of the Urban Infrastructure KPI Dashboard in Excel
✨ 7 Fully Designed Worksheets
Every sheet has a purpose—Dashboard, Monthly Inputs, Targets, Trends, Definitions, and more.
🏙 Complete MTD & YTD Tracking
View actual, target, and historical performance all in one place.
📊 Interactive KPI Trends
Analyze MTD and YTD performance patterns using dynamic trend charts.
🎯 Target Comparison with Icons
Automatic up/down arrows show whether performance meets your target.
🔽 Dropdown Month Selection
Choose any month and the entire dashboard updates instantly.
🧭 Easy Home Navigation Page
One-click buttons make it beginner-friendly for all users.
📁 Excel-Driven Data Structure
Update Actuals, Targets, Previous Year, and Definition Sheets — Excel handles the rest.
📝 Fully Customizable KPIs
Add or modify KPIs anytime without affecting the dashboard logic.
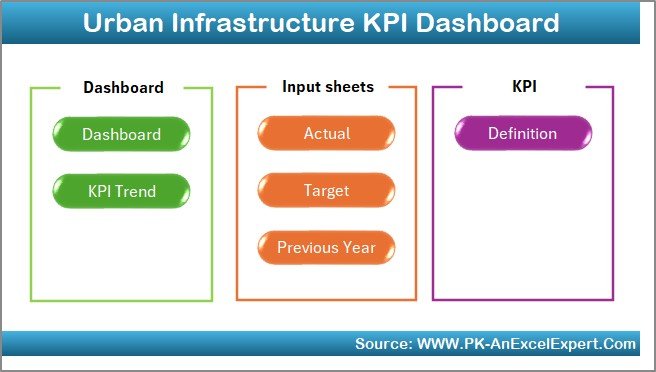
⭐ What’s Inside the Urban Infrastructure KPI Dashboard
This dashboard is built using 7 organized and easy-to-use worksheets, each created for smooth data entry and analysis.
📌 1. Home Sheet – Easy Navigation for All Users
This sheet contains navigation buttons that allow users to jump between Dashboard, Actuals, Targets, KPI Definitions, and Trends. Perfect for beginners and large teams.
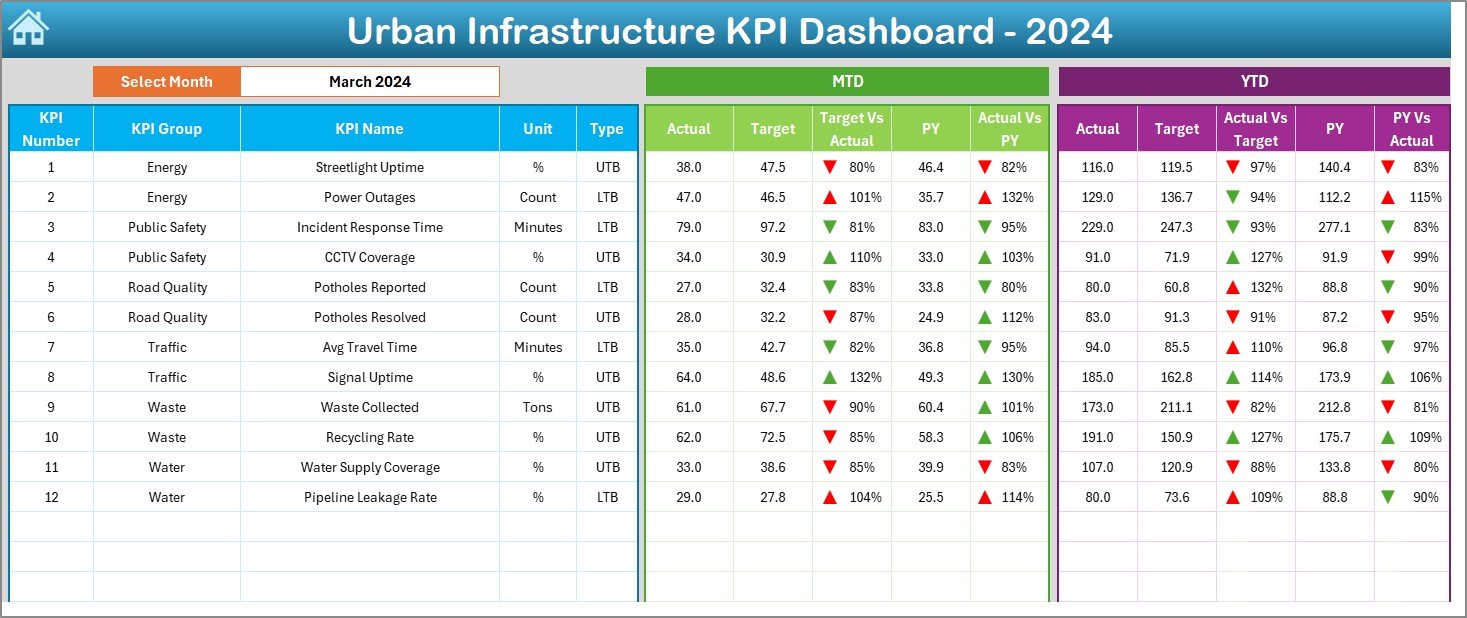
📌 2. Dashboard Sheet – The Main Performance View
This is the heart of the file. It shows:
-
🔹 Month-to-Date (MTD) Actual, Target & Previous Year
-
🔹 Year-to-Date (YTD) Actual, Target & Previous Year
-
🔹 Performance comparisons
-
🔹 Conditional arrows that show improvement or decline
Selecting a month (cell D3) updates the entire dashboard instantly.
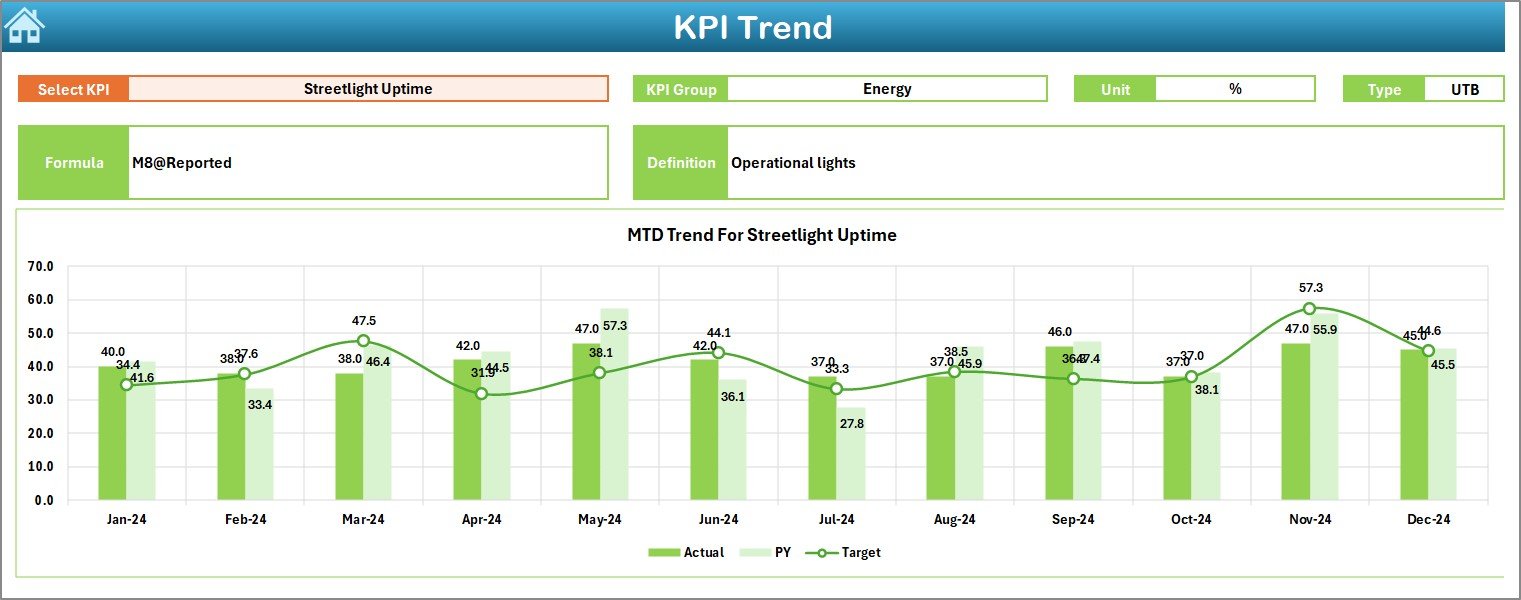
📌 3. KPI Trend Sheet – Deeper KPI Analysis
Here, you pick any KPI from the dropdown (cell C3) and see:
-
KPI Group
-
KPI Unit
-
KPI Type (UTB/LTB)
-
KPI Formula
-
KPI Definition
Below this, two trend charts display:
-
📈 MTD Trends
-
📉 YTD Trends
Perfect for review meetings and long-term planning.
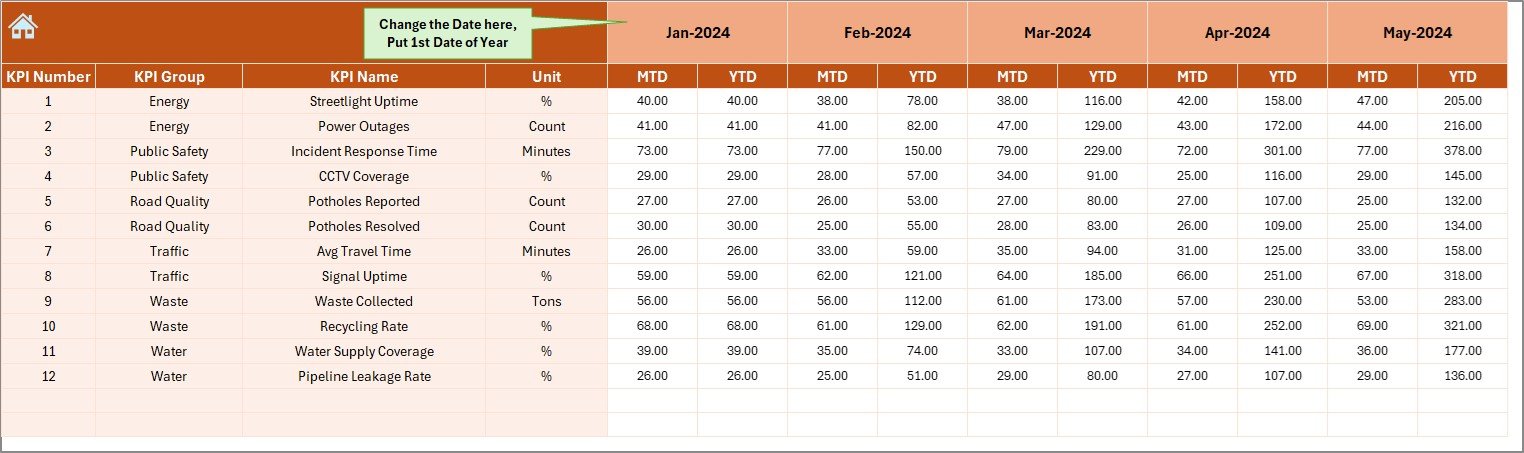
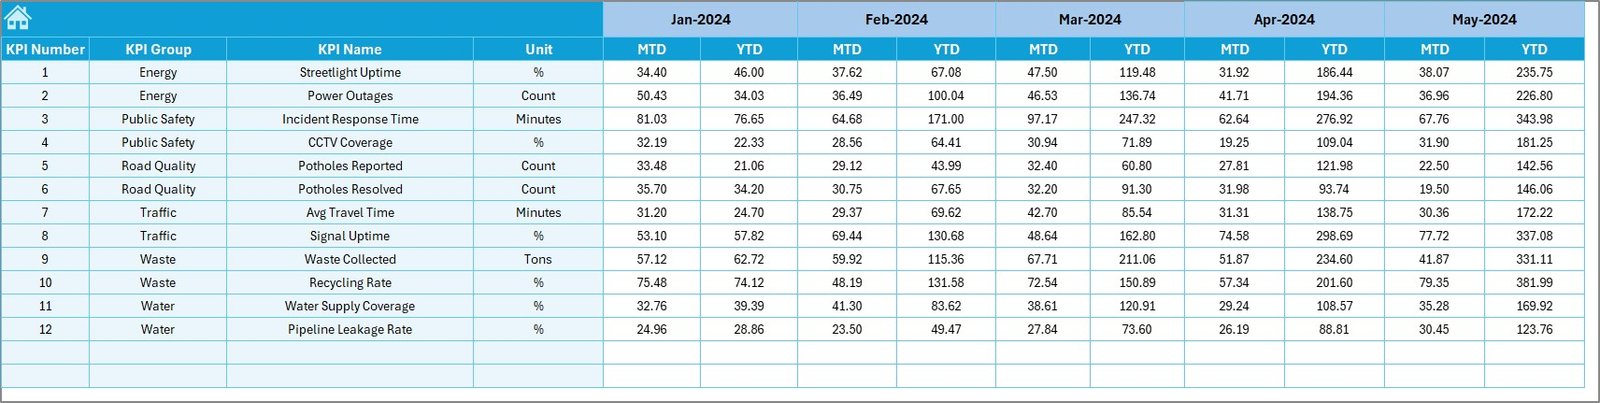
📌 4. Actual Numbers Sheet – Monthly Data Entry
Enter monthly performance data easily. Once you enter the first month of the year, the sheet auto-adjusts itself.
📌 5. Target Sheet – Set Monthly & Yearly Goals
Enter MTD and YTD targets for each KPI. This supports smart planning and forecasting.
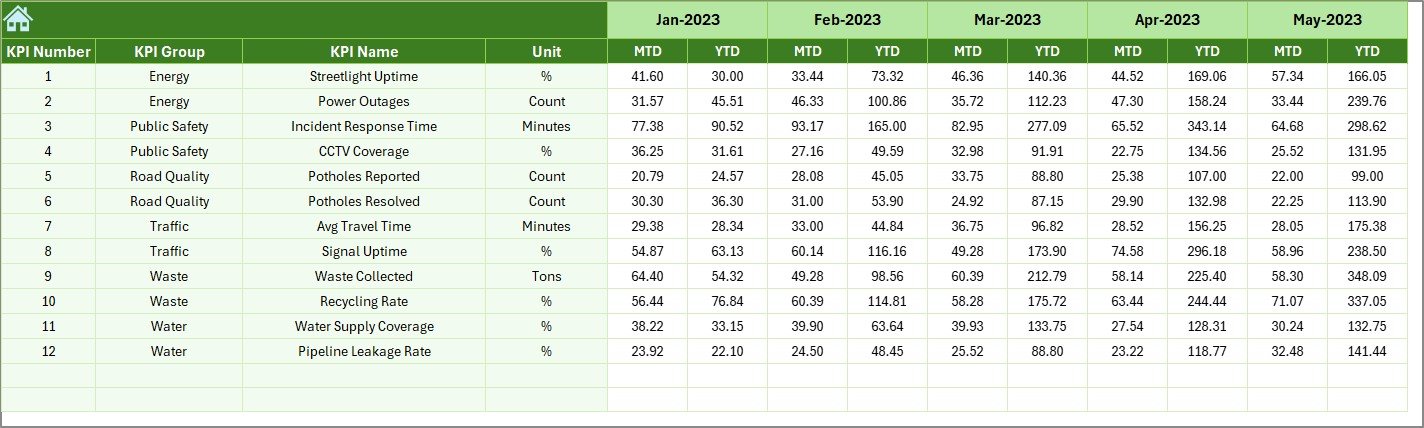
📌 6. Previous Year Numbers Sheet – Historical Comparison
Compare current performance with last year’s results. Helps identify growth or decline.
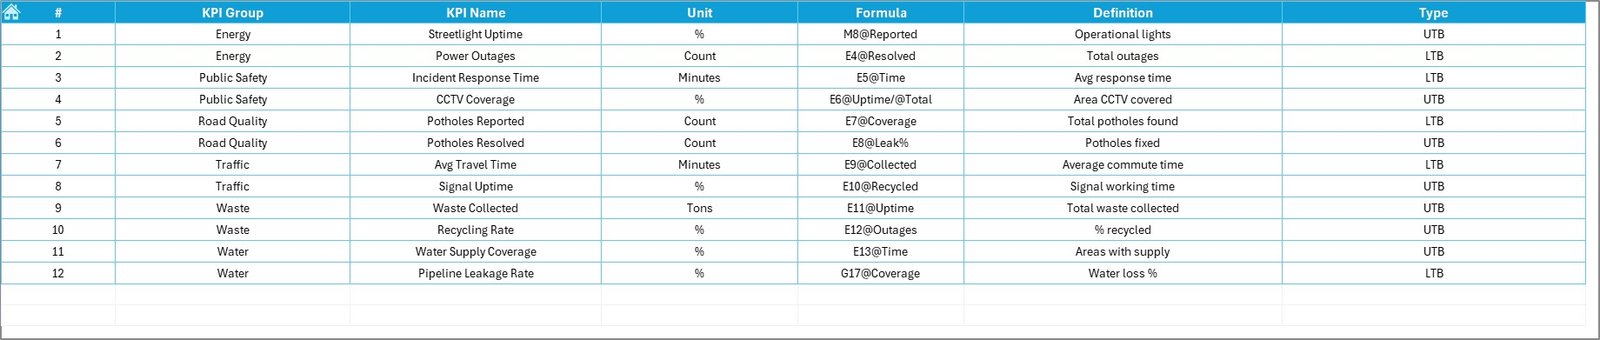
📌 7. KPI Definition Sheet – KPI Clarity
Store KPI details such as:
-
KPI Group
-
Unit
-
Formula
-
Meaning
-
Data Logic
Ensures team-wide clarity and standardization.
⭐ How to Use the Urban Infrastructure KPI Dashboard in Excel
Using this dashboard is extremely simple. No advanced Excel skills needed.
🟦 Step 1: Enter KPI definitions in the KPI Definition Sheet
🟦 Step 2: Enter monthly targets in the Target Sheet
🟦 Step 3: Add previous year data for reference
🟦 Step 4: Enter current year performance in the Actuals Sheet
🟦 Step 5: Go to the Dashboard and select the month
🟦 Step 6: Review MTD & YTD charts, trends, and comparisons
🟦 Step 7: Go to the KPI Trend Sheet to study detailed performance
Everything updates automatically once the data is entered.
⭐ Who Can Benefit from This Urban Infrastructure KPI Dashboard
🏛 Municipal Corporations
Track department-wise KPIs for water, waste, roads, transport, and power.
🏗 Public Works Departments
Monitor project timelines, completion rates, and efficiency scores.
🚦 Smart City Mission Teams
Use it to measure digital infrastructure and real-time service performance.
🌍 Urban Planners & Consultants
Present trends and insights during planning and review meetings.
🚮 Waste Management Teams
Track waste collection, segregation, and recycling efficiency.
💡 Utilities & Energy Departments
Monitor outage duration, power efficiency, and supply consistency.
This template is useful for any city department that manages infrastructure performance.


Reviews
There are no reviews yet.