


🌆 Urban development is the backbone of modern cities. From infrastructure growth to sustainability and budget planning, city authorities face enormous challenges. Without a structured reporting tool, tracking performance and making data-driven decisions becomes overwhelming.
That’s where the Urban Development KPI Dashboard in Power BI 🚀 makes all the difference.
This interactive, Excel-powered Power BI dashboard consolidates city development data into one easy-to-use visualization tool. It allows administrators, policymakers, and consultants to track housing projects, infrastructure expansion, budget utilization, and environmental KPIs in real time. Instead of juggling multiple spreadsheets, you’ll have one central platform to evaluate month-to-date (MTD) and year-to-date (YTD) progress.
🌟 Key Features of Urban Development KPI Dashboard in Power BI
-
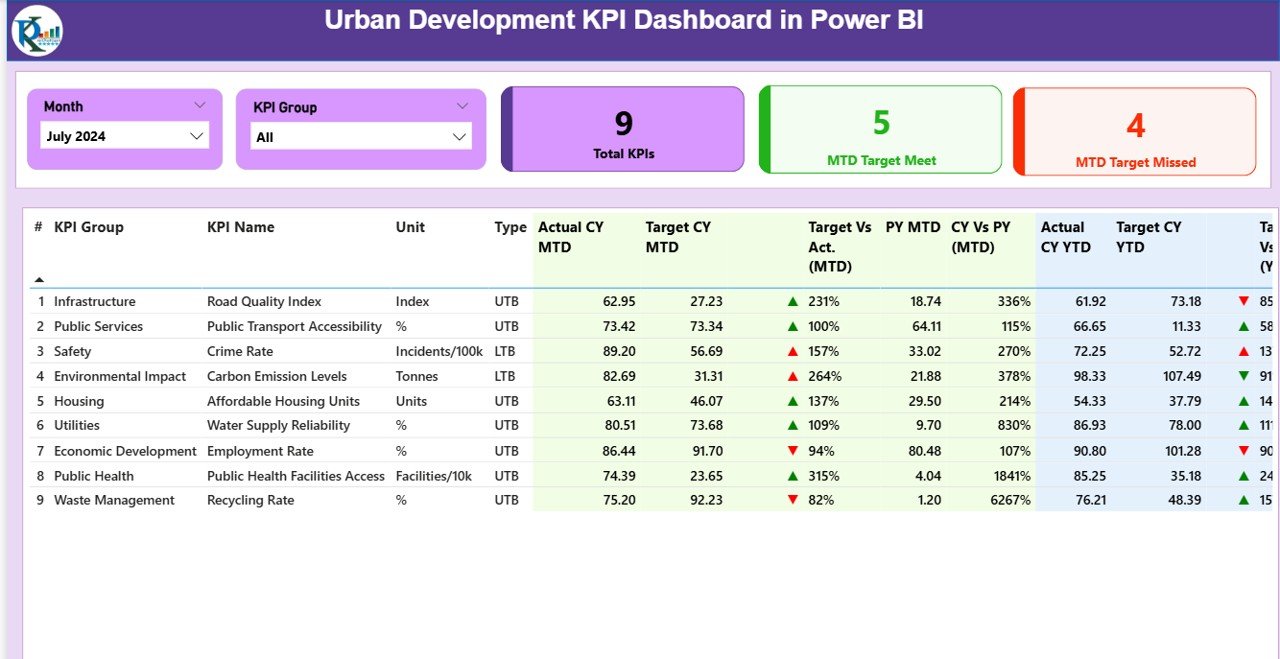
📊 Summary Page: Instantly review total KPIs, MTD targets met/missed, and detailed performance tables with variance icons (green ▲ or red ▼). Includes comparisons with previous year data for better context.
-
📈 KPI Trend Page: Analyze performance trends over time using combo charts. Compare actuals, targets, and previous year values for both MTD and YTD.
-
📑 KPI Definition Page: A drill-through page with KPI formulas, definitions, and calculation methods. Ensures everyone measures performance consistently.
-
🔗 Excel Data Integration: Connects seamlessly to structured Excel sheets for Actuals, Targets, and KPI Definitions. Refresh Power BI to instantly update results.
-
🎯 Visual Insights: Icons, slicers, and conditional formatting make complex datasets easy to interpret.
-
⚡ User-Friendly Navigation: Intuitive layout with drill-through and slicers for filtering by month or KPI group.
📦 What’s Inside the Urban Development KPI Dashboard
When you download this product, you’ll get:
-
✅ A Power BI file with three analytical pages—Summary, KPI Trend, and KPI Definition.
-
✅ An Excel data source with three sheets:
-
Input_Actual: Records MTD and YTD actual KPI values.
-
Input_Target: Stores target values for each KPI.
-
KPI Definition: Includes KPI number, group, unit, formula, and type (UTB/LTB).
-
-
✅ Built-in variance analysis, icons, and charts for at-a-glance performance.
-
✅ A ready-to-use framework that can be customized for housing, infrastructure, environment, or budget-specific KPIs.
🛠 How to Use the Urban Development KPI Dashboard
-
Update Excel Data: Enter monthly actuals and targets into the structured sheets.
-
Refresh Power BI: Load the updated Excel file to refresh visuals instantly.
-
Navigate Pages: Use slicers on the Summary and Trend pages to filter by month or KPI group.
-
Analyze Trends: Compare current vs previous year performance for better forecasting.
-
Drill Through: Click into the KPI Definition page to understand formulas and measurement criteria.
-
Take Action: Use insights to optimize policies, budgets, and infrastructure projects.
💡 No coding required—just update Excel regularly and let Power BI visualize the results!
👥 Who Can Benefit from This Dashboard
The Urban Development KPI Dashboard in Power BI is designed for:
-
🏙 City Planners: Monitor housing growth, transportation, and infrastructure KPIs.
-
🏛 Government Officials: Ensure policy compliance and track budget utilization.
-
📊 Consultants: Deliver structured insights for urban development projects.
-
🌱 NGOs & Environmental Bodies: Track sustainability and environmental KPIs.
-
🏗 Construction Firms: Align urban projects with regulatory targets.
-
📈 Investors & Donors: Gain transparency on development progress before funding decisions.
If your goal is to create smarter, greener, and more efficient cities, this dashboard is the ultimate solution.


Reviews
There are no reviews yet.