Transportation businesses move at full speed every day. Deliveries must arrive on time. Fuel prices fluctuate constantly. Driver performance impacts customer satisfaction. Meanwhile, operating costs continue to rise.
If you still monitor performance using manual spreadsheets, you are reacting instead of leading.
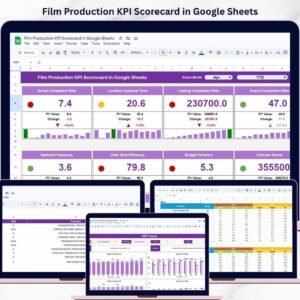
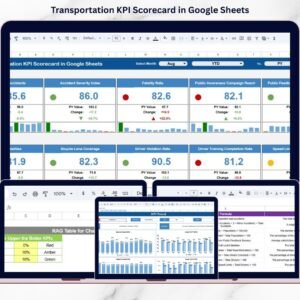
Now imagine tracking On-Time Delivery %, Fuel Efficiency, Cost per KM, Revenue, Maintenance Cost, Accident Rate, MTD vs Target, and YTD Growth — all inside one dynamic scorecard.
That is exactly what the Transportation KPI Scorecard in Google Sheets delivers.
This ready-to-use template gives you structured KPI monitoring with automatic month selection, traffic light indicators, percentage change arrows, and real-time collaboration.
Stop guessing. Start controlling your transportation performance.
🚀 Key Features of Transportation KPI Scorecard in Google Sheets
📊 10 Structured Transportation KPIs
📅 Monthly (MTD) & Year-to-Date (YTD) Views
🚦 Traffic Light Performance Indicators
🔼 Up & Down Arrows for % Change
📈 Trend Analysis Charts
🔎 Dynamic Month Dropdown
👥 Real-Time Collaboration
⚙ Automated KPI Calculations
🎯 Target vs Actual Comparison
Because it is built in Google Sheets, your operations and finance teams can update and review performance together in real time.
📦 What’s Inside the Transportation KPI Scorecard in Google Sheets
This scorecard includes structured sheets designed for complete performance control:
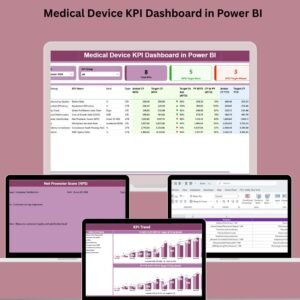
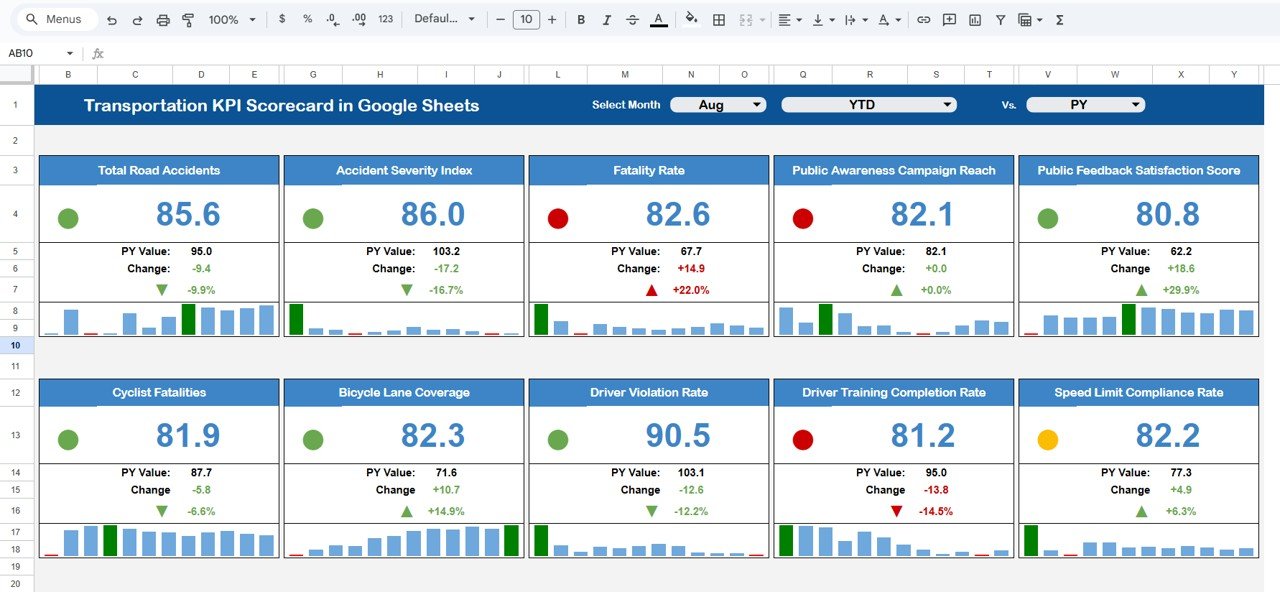
1️⃣ Main Dashboard Sheet – Central Performance View
This is the heart of the scorecard.
You can:
-
Select any month from the dropdown
-
Toggle between MTD and YTD view
-
Instantly see traffic light indicators
-
Monitor % change arrows
Green means strong performance.
Yellow signals caution.
Red highlights immediate action required.
Managers can identify weak areas in seconds.
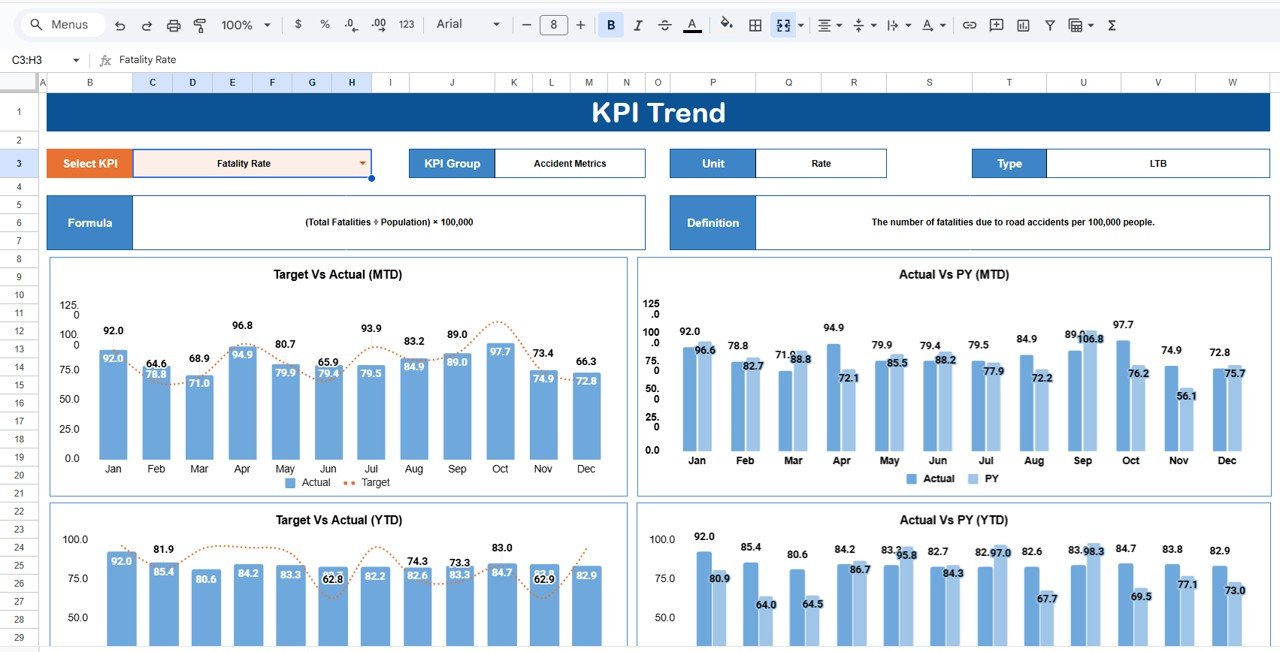
2️⃣ Trend Sheet – KPI Growth Analysis
Select a KPI from dropdown (Cell C3) and view:
-
KPI Group
-
Unit
-
KPI Type (Lower the Better / Upper the Better)
-
Formula
-
Definition
-
Monthly Trend Chart
This helps you analyze long-term behavior instead of relying on one month’s data.
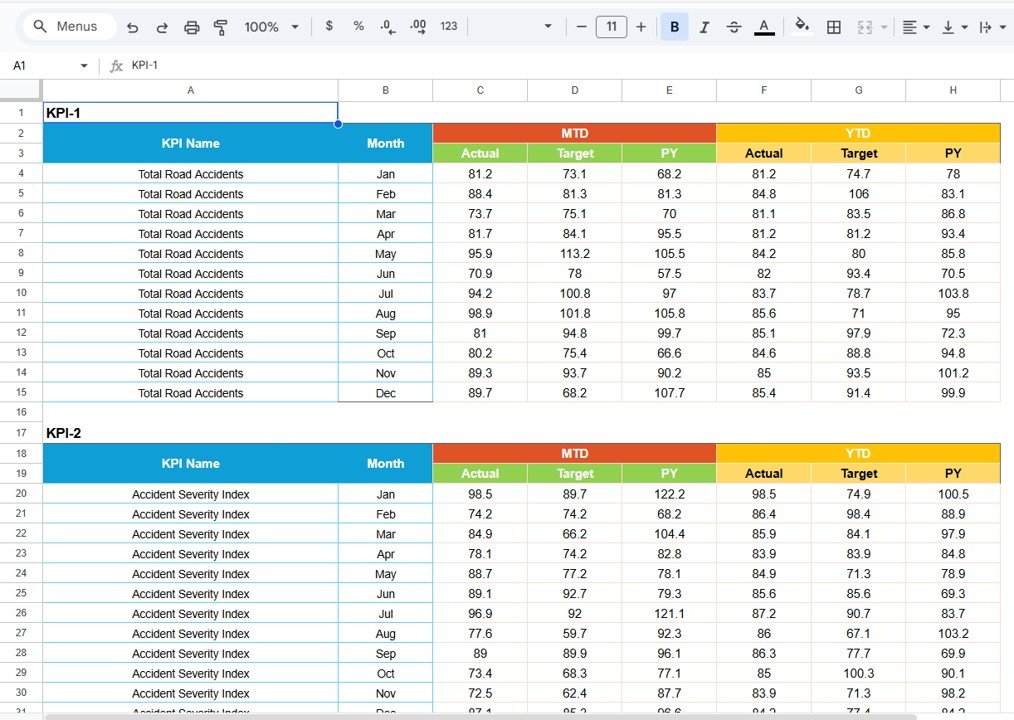
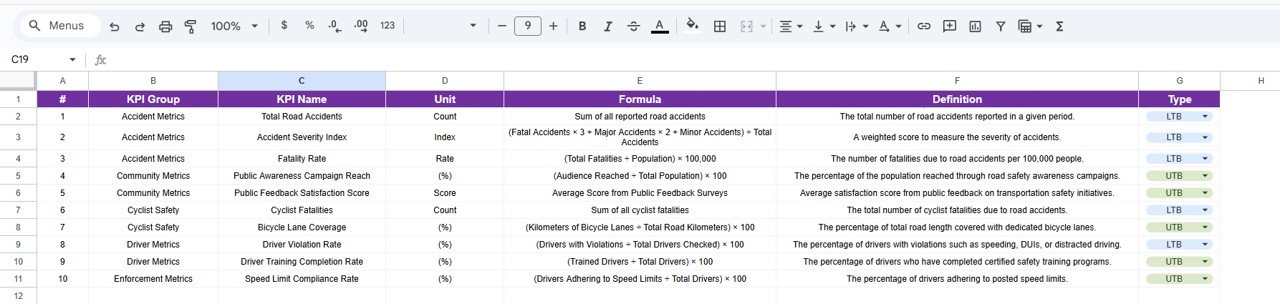
3️⃣ KPI Definition Sheet – KPI Master Logic
Maintain clear KPI documentation including:
-
KPI Name
-
KPI Group
-
Unit
-
Formula
-
Definition
This ensures transparency and consistent understanding across teams.
4️⃣ Data Input Sheet – Raw Data Entry
Enter monthly operational data such as:
-
Total Deliveries
-
On-Time Deliveries
-
Fuel Consumed
-
Distance Covered
-
Operating Cost
-
Revenue
-
Maintenance Cost
-
Accident Count
The dashboard calculates KPI values automatically.
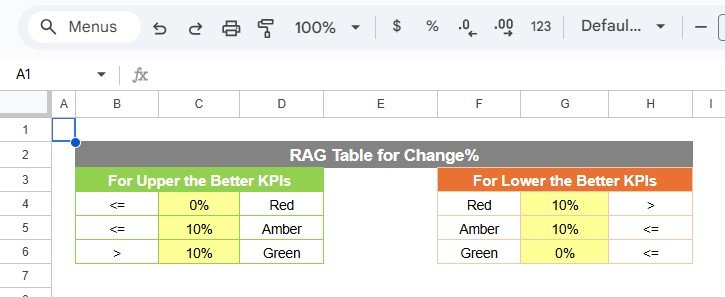
5️⃣ Colour Settings Sheet – Indicator Logic Control
This sheet controls:
🚦 Traffic Light Rules
🔼 Arrow Direction Logic
Green when target met.
Yellow for slight deviation.
Red for significant gaps.
Thus, visual indicators always reflect KPI logic correctly.
🛠 How to Use the Transportation KPI Scorecard in Google Sheets
Using this scorecard is simple:
1️⃣ Enter monthly operational data
2️⃣ Define KPI structure in KPI Definition sheet
3️⃣ Select month from dropdown
4️⃣ Switch between MTD and YTD view
5️⃣ Analyze traffic lights and trend charts
No advanced technical skills required.
👥 Who Can Benefit from This Transportation KPI Scorecard in Google Sheets
🚚 Logistics Companies
📦 Courier & Delivery Services
🚛 Freight Operators
🏗 Distribution Networks
🚗 Fleet Transport Businesses
📊 Operations Managers
💰 Finance & Cost Control Teams
If you manage fleet operations, delivery performance, or transportation cost, this scorecard becomes your control system.
By using this scorecard, you:
✔ Monitor delivery performance instantly
✔ Track fuel efficiency clearly
✔ Control operating and maintenance costs
✔ Reduce accident risks
✔ Compare monthly and yearly growth
✔ Improve service quality
✔ Increase operational efficiency
Instead of preparing manual reports, you focus on optimizing routes, cost, and performance.
This is not just a Google Sheet. It is a complete transportation performance management tool designed for modern logistics businesses.
If you want better visibility, stronger cost control, and higher service reliability — this scorecard gives you the structure you need.
📖 Click here to read the Detailed blog post
Watch the step-by-step video tutorial: