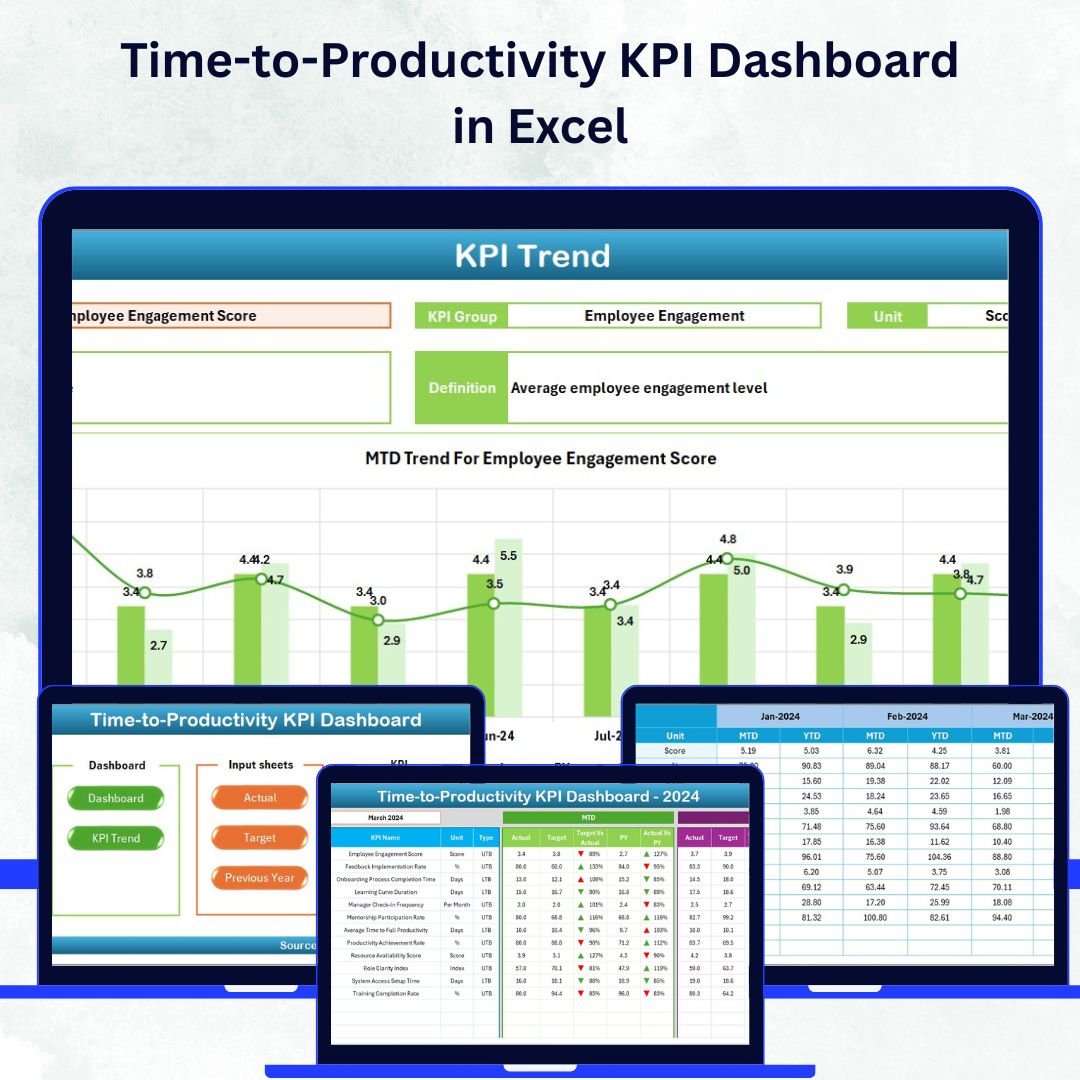

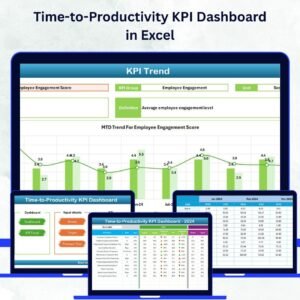
Boost your organization’s efficiency and track workforce performance like never before with the Time-to-Productivity KPI Dashboard in Excel .
This ready-to-use, interactive dashboard empowers HR teams, department heads, and business leaders to measure how quickly employees or projects reach full productivity. Built entirely in Microsoft Excel, it transforms raw performance data into actionable insights that drive faster, smarter decisions.
With this Excel-based solution, you can visualize trends, compare month-to-date (MTD) and year-to-date (YTD) performance, and identify areas for improvement — all without using complex software or coding.
💡 Key Features of Time-to-Productivity KPI Dashboard in Excel
✅ Interactive Dashboard Interface – Navigate easily between sheets with clickable buttons on the Home page.
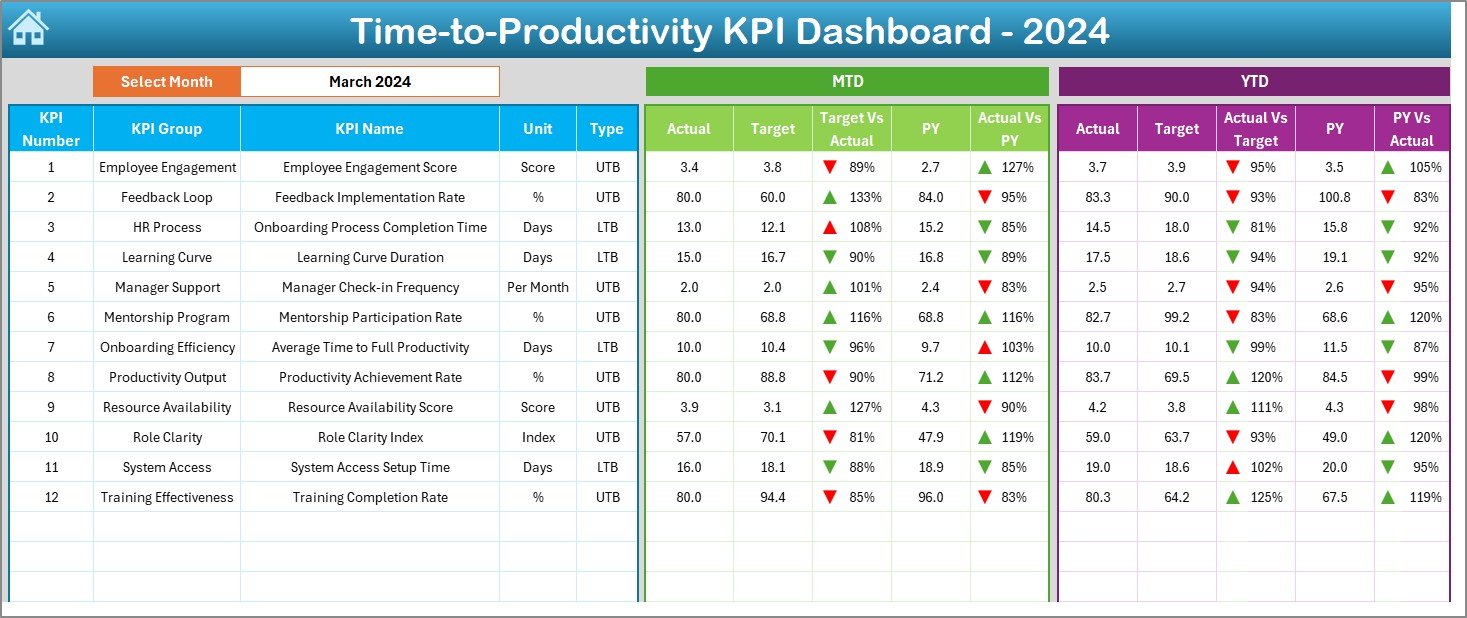
📊 Dynamic Data Visualization – Charts, KPI cards, and arrows automatically update when you select a different month.
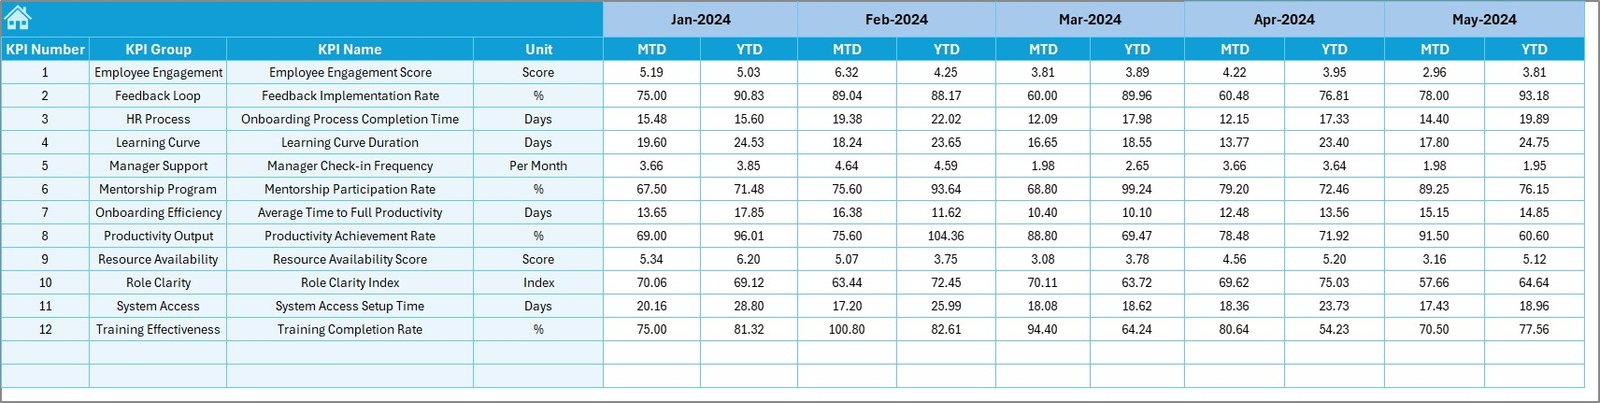
📈 MTD & YTD Performance Comparison – Analyze month-to-date and year-to-date progress for every KPI in real-time.
🔍 Visual Indicators – Conditional formatting shows green ⬆ for improvement and red ⬇ for underperformance.
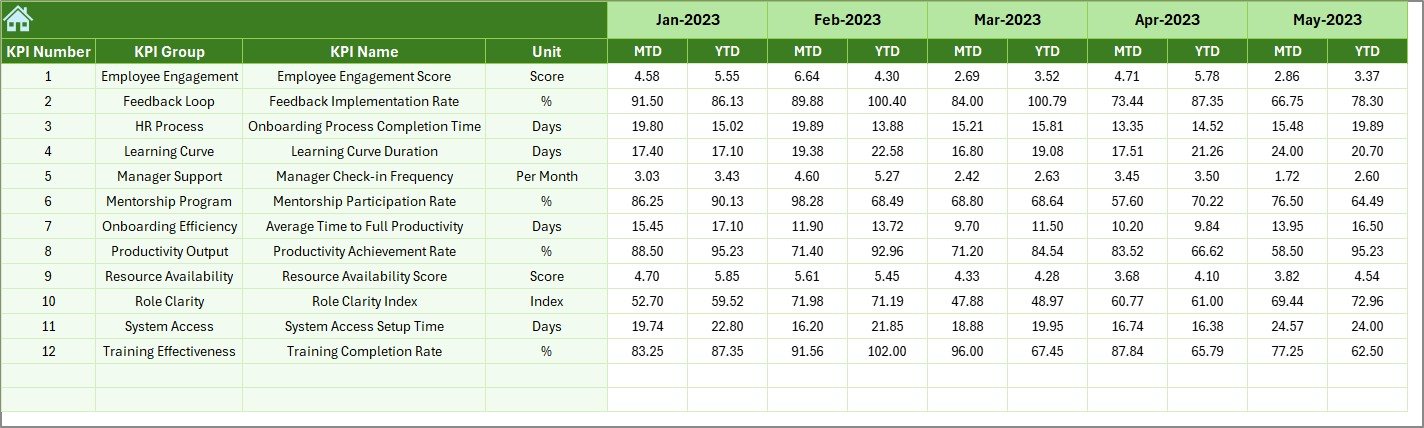
📂 Historical Comparison – Compare current results with the previous year to understand long-term growth.
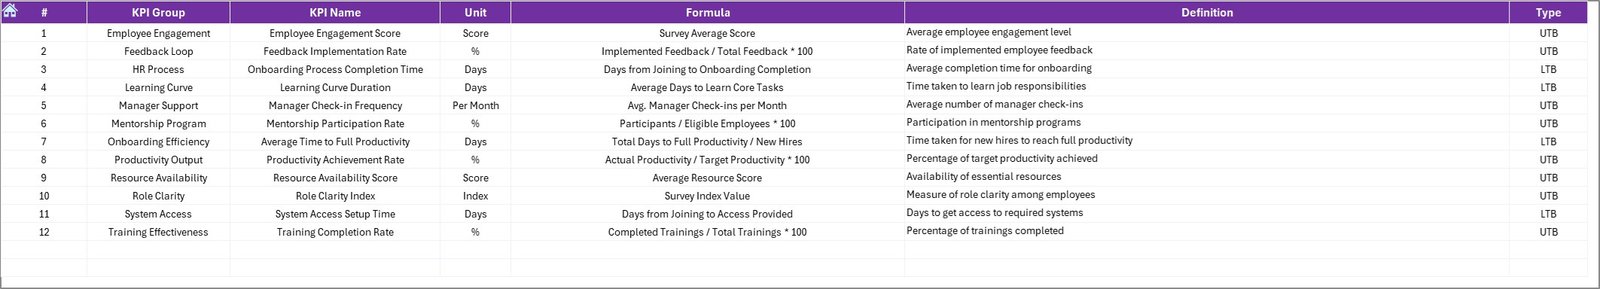
📘 Clear KPI Documentation – KPI Definition tab includes KPI Name, Formula, Unit, and Definition for full transparency.
⚙️ No Macros Required – Works with simple Excel formulas and dropdowns; no technical expertise needed.
🎨 Customizable Design – Add your logo, color themes, and business-specific KPIs to make it uniquely yours.
📦 What’s Inside the Time-to-Productivity KPI Dashboard in Excel
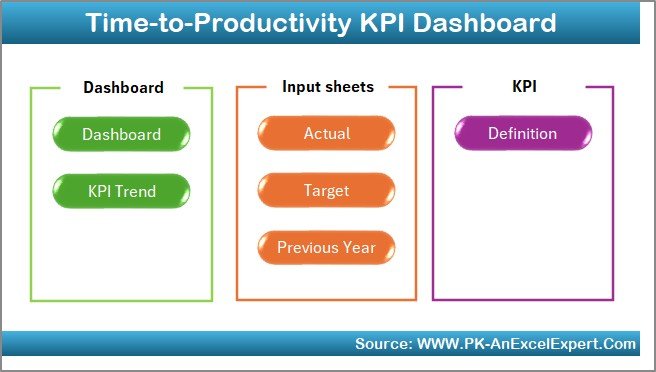
When you download this powerful dashboard, you’ll receive a 7-sheet Excel file thoughtfully structured for simplicity and analysis:
1️⃣ Home Sheet – Central hub with navigation buttons and instructions for new users.
2️⃣ Dashboard Sheet – Main visual dashboard with KPI cards, charts, and month selector.
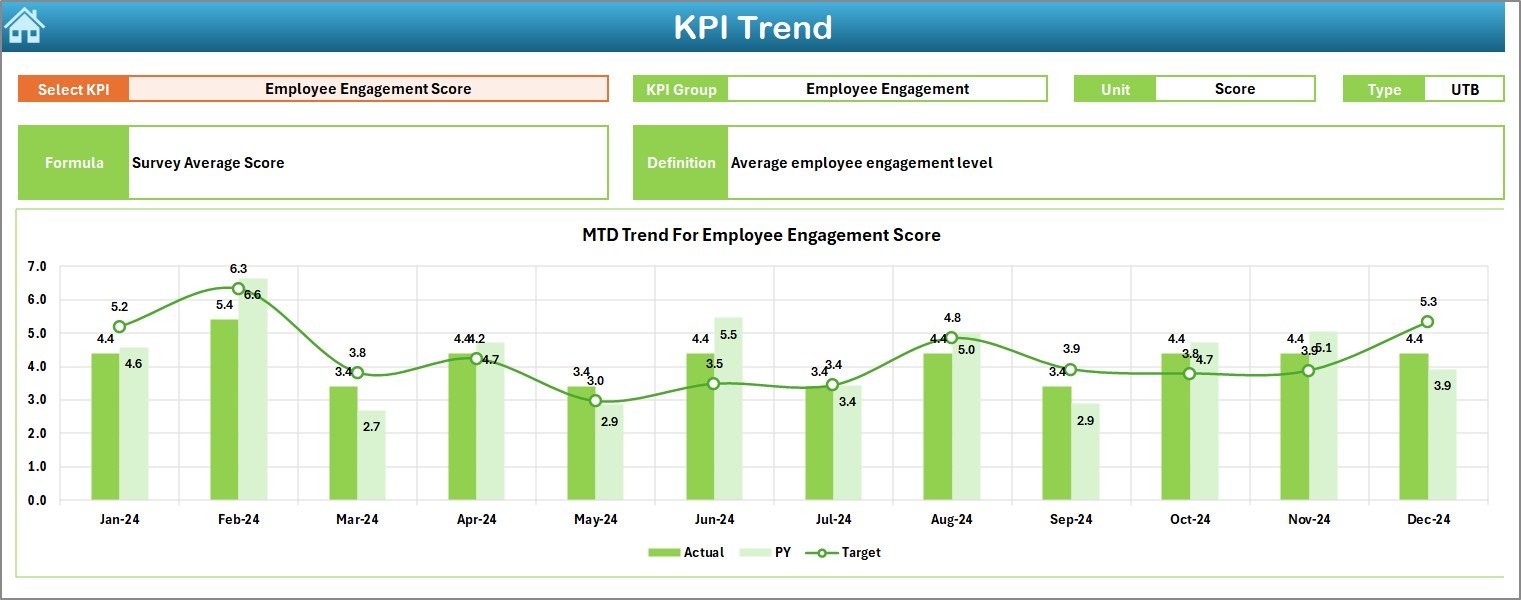
3️⃣ KPI Trend Sheet – Drill down into each KPI with detailed month-wise performance charts.
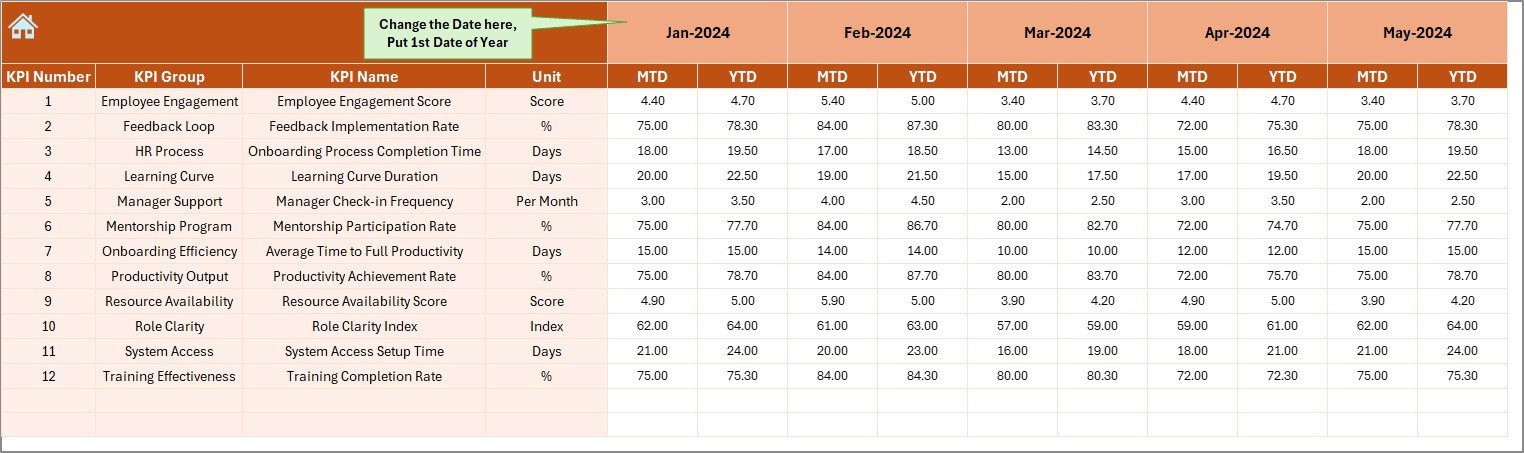
4️⃣ Actual Numbers Input Sheet – Enter real-time MTD and YTD data manually.
5️⃣ Target Sheet – Set monthly and yearly targets to track progress effectively.
6️⃣ Previous Year Sheet – Maintain historical data for year-over-year comparison.
7️⃣ KPI Definition Sheet – Reference list of all KPIs with formula, unit, and type (UTB/LTB).
Each sheet is designed to ensure seamless data flow, instant calculations, and meaningful analytics — all in one professional Excel workbook.
🧭 How to Use the Time-to-Productivity KPI Dashboard in Excel
🪄 Using this dashboard is as easy as 1-2-3:
1️⃣ Enter Actual Data in the Actual Numbers Input sheet.
2️⃣ Set Targets in the Target sheet for each KPI.
3️⃣ Add Previous Year Data for better benchmarking.
4️⃣ Select Month on the Dashboard tab to refresh all visuals automatically.
5️⃣ Review MTD & YTD Charts and use arrows to quickly identify performance gaps.
Within minutes, you’ll get a 360° view of how quickly employees, teams, or departments achieve their productivity targets. The built-in logic instantly highlights areas needing attention, helping leaders make data-backed decisions.
👥 Who Can Benefit from This Dashboard
This dashboard is perfect for professionals and organizations that want to track and improve workforce efficiency effectively:
👨💼 HR Managers – Monitor onboarding speed and training success.
🏢 Department Heads – Evaluate team productivity and target achievement.
🧩 Project Managers – Assess how quickly new projects reach performance benchmarks.
📊 Executives & Analysts – View company-wide productivity trends at a glance.
💼 Business Owners – Ensure every hour contributes to measurable results.
Whether you manage a small startup or a large enterprise, this tool adapts easily to your data needs, making productivity tracking effortless and impactful.


Reviews
There are no reviews yet.