
The live Ticketing and Live Events Dashboard moves at lightning speed. Ticket sales change daily. Marketing campaigns influence revenue instantly. Audience ratings affect future bookings. Therefore, event organizers must monitor performance in real time to stay competitive.
However, many event managers still depend on scattered Excel files and manual reports. As a result, they miss sales trends, lose revenue opportunities, and fail to optimize pricing and promotions.
That is exactly why the Ticketing and Live Events Dashboard in Power BI becomes a game-changing solution 🎟️📊.
This powerful, ready-to-use Power BI dashboard converts raw ticketing data into interactive, visual, and actionable insights. It helps you track gross sales, net sales, discounts, ratings, marketing channels, venues, cities, and ticket types — all in one centralized system. Instead of reacting late, you gain instant clarity and act fast.
🔑 Key Features of Ticketing and Live Events Dashboard in Power BI
📊 Real-Time Sales Monitoring
Track gross and net sales dynamically with automated refresh capability.
💰 Discount & Revenue Analysis
Monitor discount impact and compare gross vs net performance clearly.
📈 Marketing Channel Performance Tracking
Identify which channels drive the highest ticket revenue.
⭐ Audience Rating Insights
Analyze ratings by region, event type, and ticket category.
🎯 Multi-Dimensional Filtering
Use slicers for city, venue, event type, month, and ticket type.
📅 Trend Analysis for Strategic Planning
Track monthly sales trends and seasonal spikes easily.
📦 What’s Inside the Ticketing and Live Events Dashboard in Power BI
This dashboard includes five interactive analytical pages, each designed to provide actionable insights.
📌 Overview Page – Complete Business Snapshot
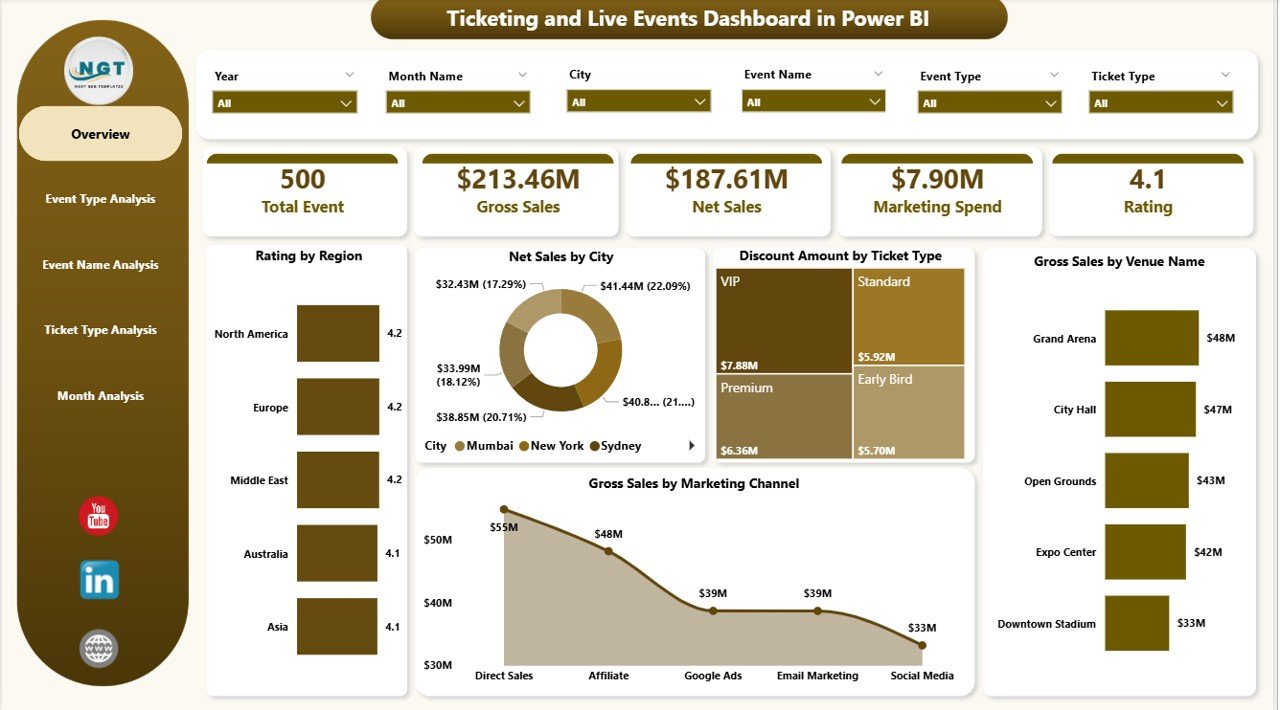
The command center of the dashboard includes:
• KPI Cards (Gross Sales, Net Sales, Discount Amount, Rating, Marketing Performance)
• Rating by Region
• Net Sales by City
• Discount Amount by Ticket Type
• Gross Sales by Venue
• Gross Sales by Marketing Channel
This page provides leadership teams with instant visibility.
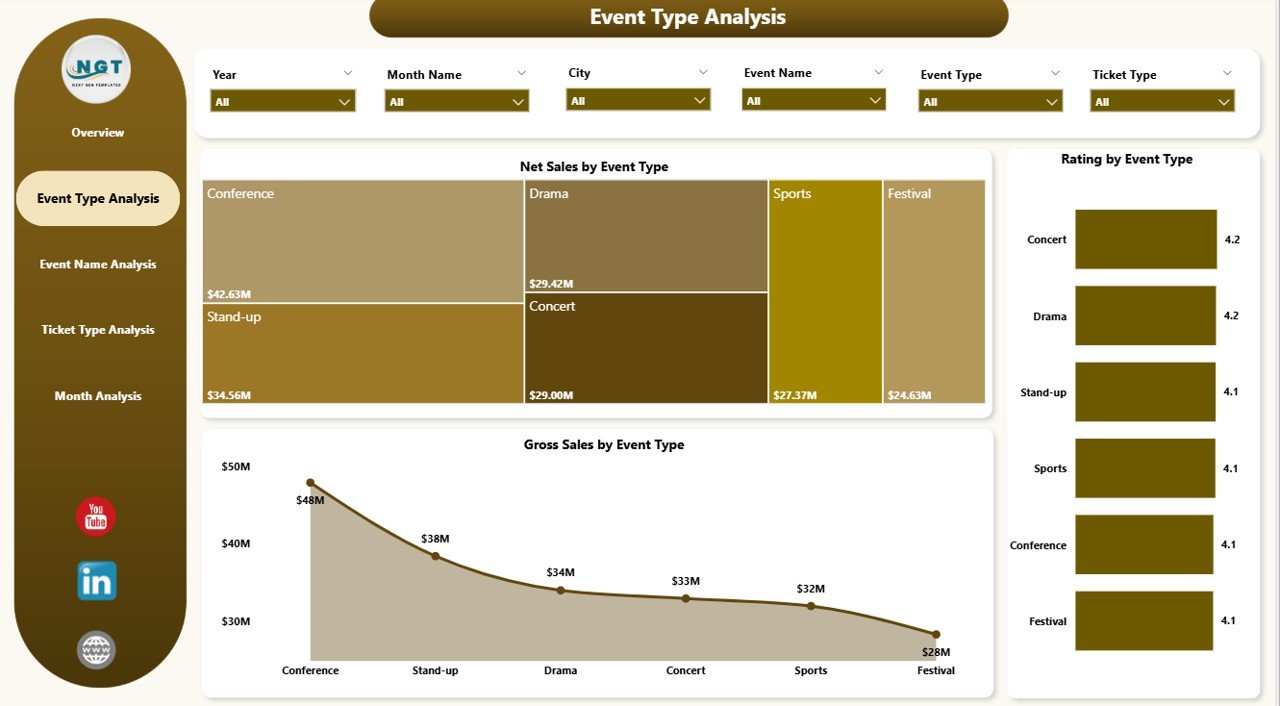
🎭 Event Type Analysis Page
Compare performance across categories such as:
Concerts
Sports
Theatre
Comedy Shows
Conferences
Visuals Include:
• Rating by Event Type
• Net Sales by Event Type
• Gross Sales by Event Type
This helps allocate marketing budgets strategically and balance revenue with customer satisfaction.
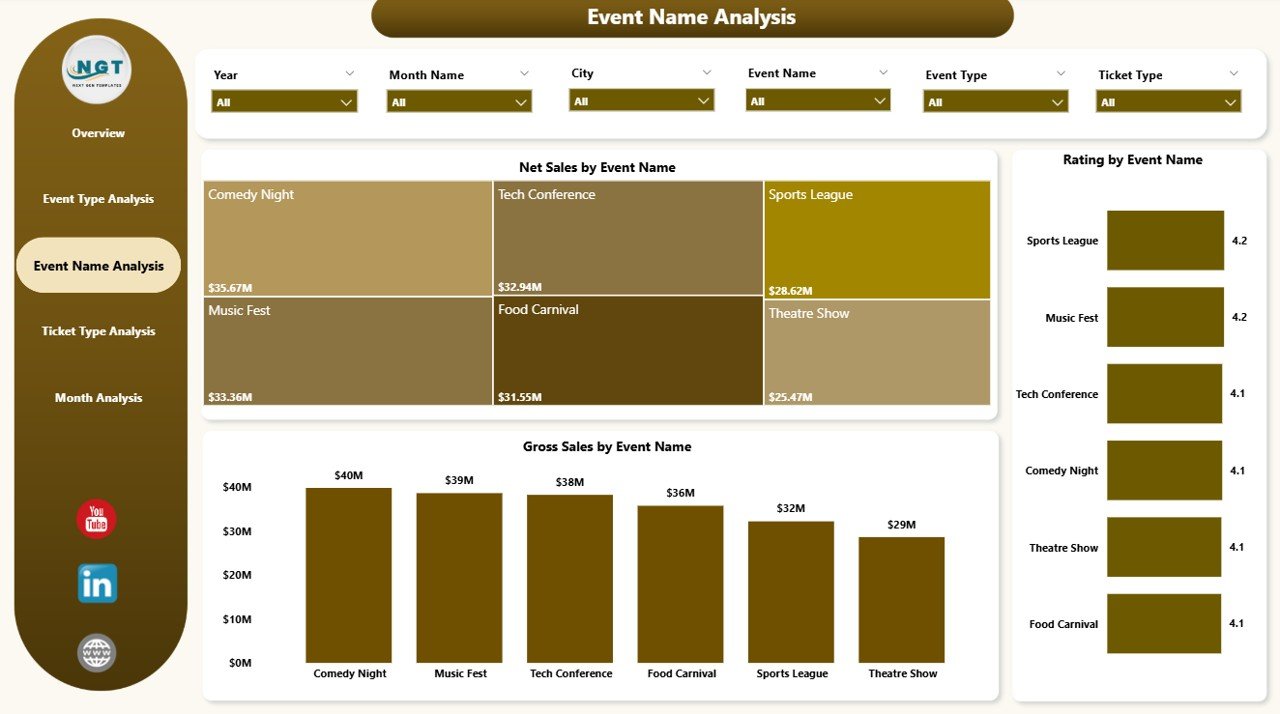
🎟️ Event Name Analysis Page
Drill down into individual event performance.
• Rating by Event Name
• Net Sales by Event Name
• Gross Sales by Event Name
Identify best-performing events and underperforming shows quickly.
💳 Ticket Type Analysis Page
Understand ticket pricing impact.
• Rating by Ticket Type
• Net Sales by Ticket Type
• Gross Sales by Ticket Type
Optimize VIP, Premium, Standard, Early Bird, and Group pricing strategies effectively.
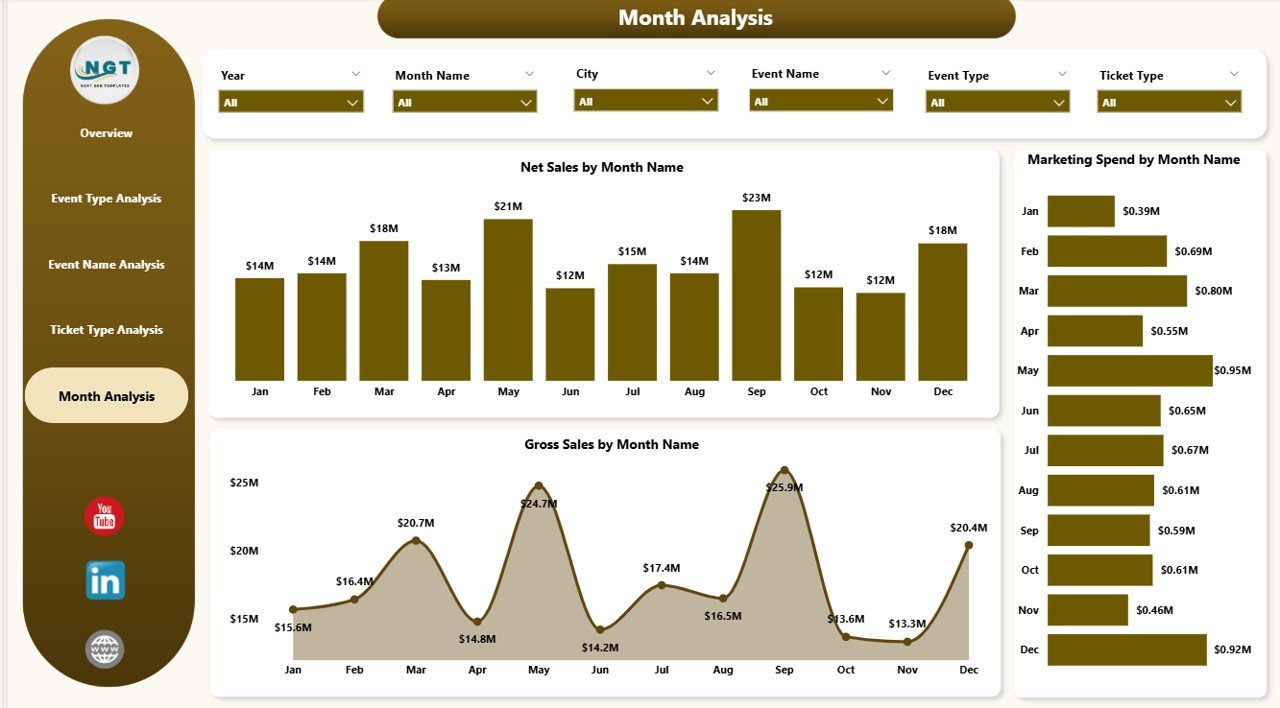
📅 Month Analysis Page
Track seasonality and time-based trends.
• Marketing Spend by Month
• Net Sales by Month
• Gross Sales by Month
Align marketing investments with revenue peaks.
🛠️ How to Use the Ticketing and Live Events Dashboard in Power BI
1️⃣ Collect ticketing data (Event Name, City, Venue, Ticket Type, Gross Sales, Discount, Net Sales, Marketing Channel, Rating, Date)
2️⃣ Import data into Power BI
3️⃣ Connect relationships if required
4️⃣ Refresh dashboard
5️⃣ Use slicers to filter dynamically
6️⃣ Analyze KPIs and trends
7️⃣ Make strategic pricing and marketing decisions
Within minutes, your event data becomes business intelligence.
👥 Who Can Benefit from This Ticketing and Live Events Dashboard in Power BI
🎤 Concert Organizers
🏟️ Sports Event Planners
🏢 Corporate Event Managers
🎪 Festival Coordinators
🎟️ Ticketing Companies
🏛️ Venue Owners
If you sell tickets or manage live events, this dashboard strengthens your decision-making power.