


Managing territories without the right insights is like driving blindfolded. In today’s fast-paced business world, sales and territory management can make or break growth strategies. That’s why we created the Territory Management KPI Dashboard in Excel — a powerful yet simple-to-use tool designed to give you real-time clarity and actionable insights for every territory your business operates in.
This ready-to-use Excel template helps managers, sales leaders, and decision-makers track performance, align targets, compare achievements, and identify opportunities for improvement — all in one place. No need for expensive software or complex BI tools. With just Excel, you can monitor KPIs, visualize data, and make faster, smarter decisions.
✨ Key Features of Territory Management KPI Dashboard in Excel
-
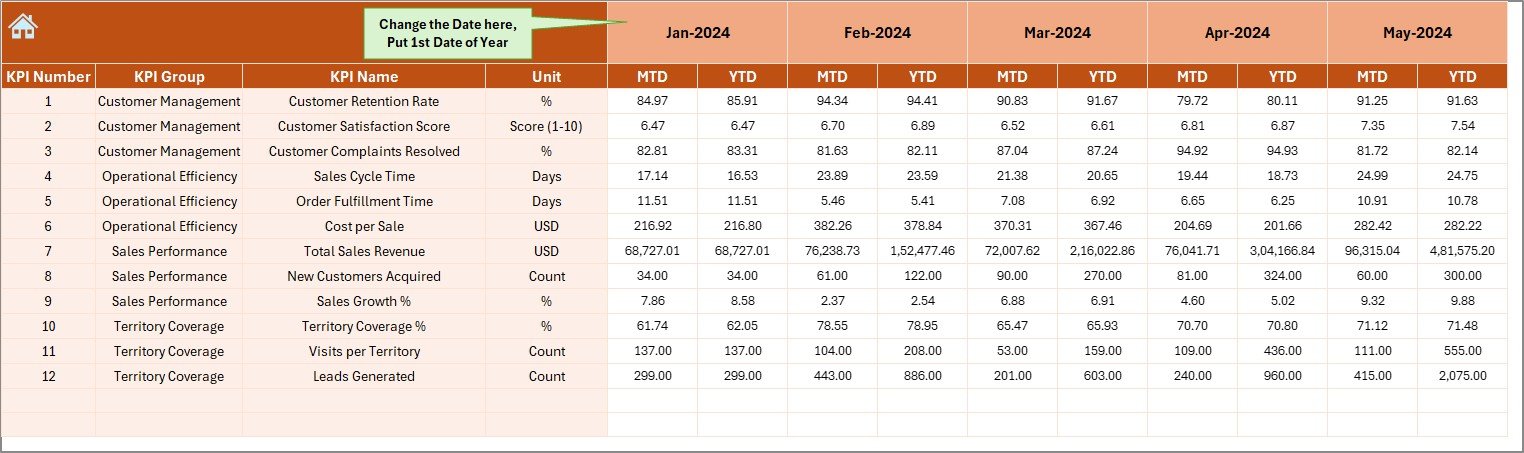
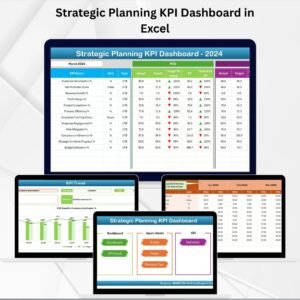
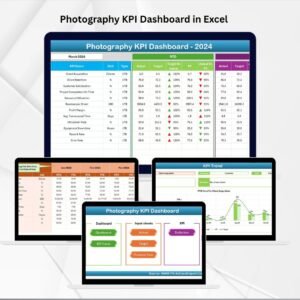
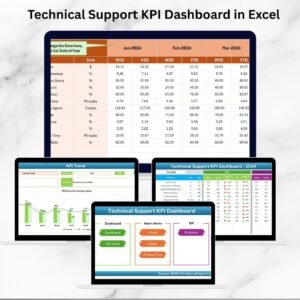
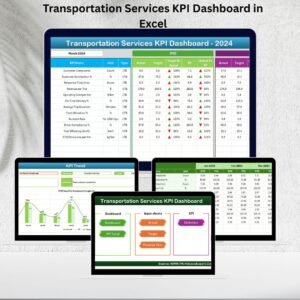
📊 Interactive Dashboard – Monitor all key KPIs with dynamic dropdowns for month selection. Instantly compare MTD (Month-to-Date) and YTD (Year-to-Date) performance.
-
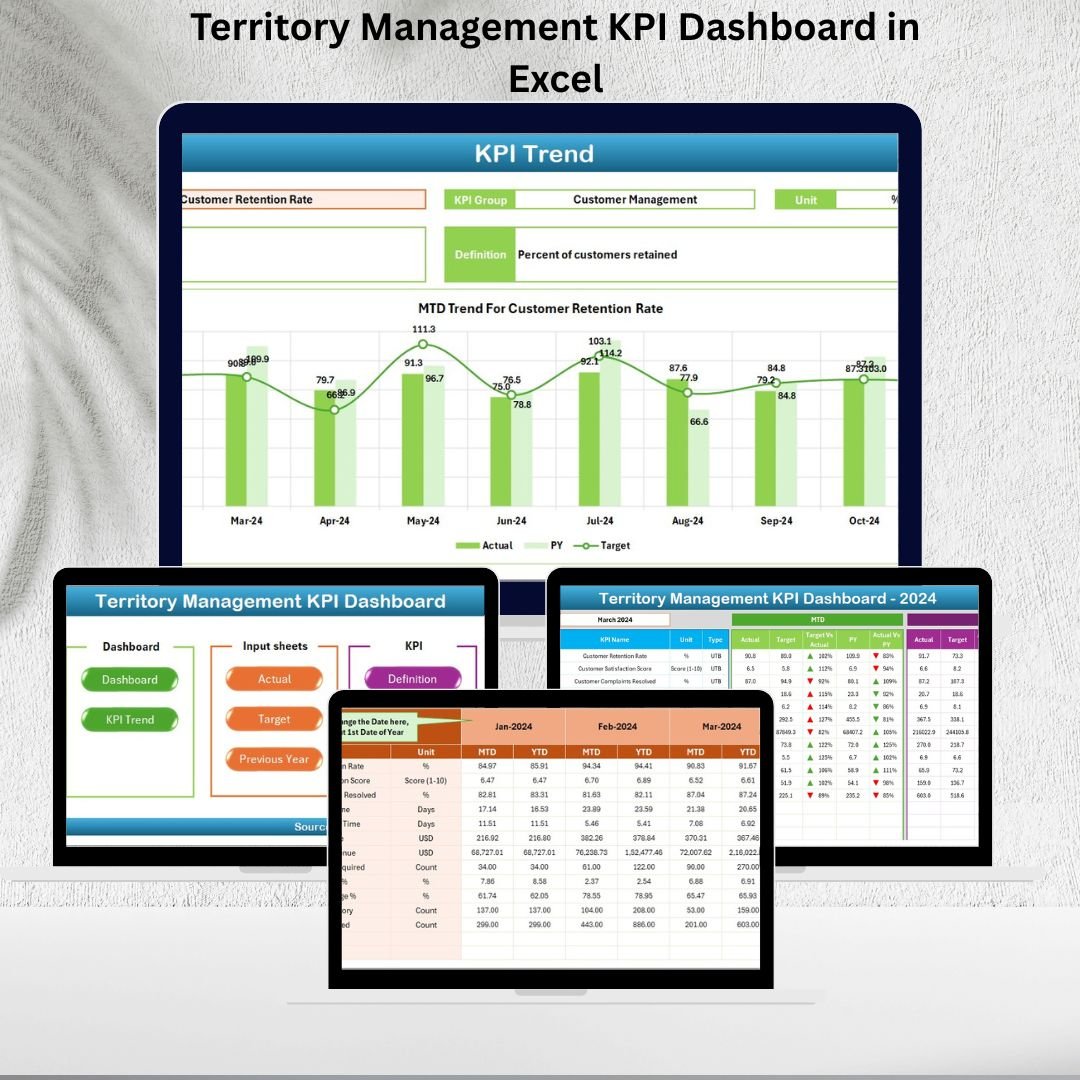
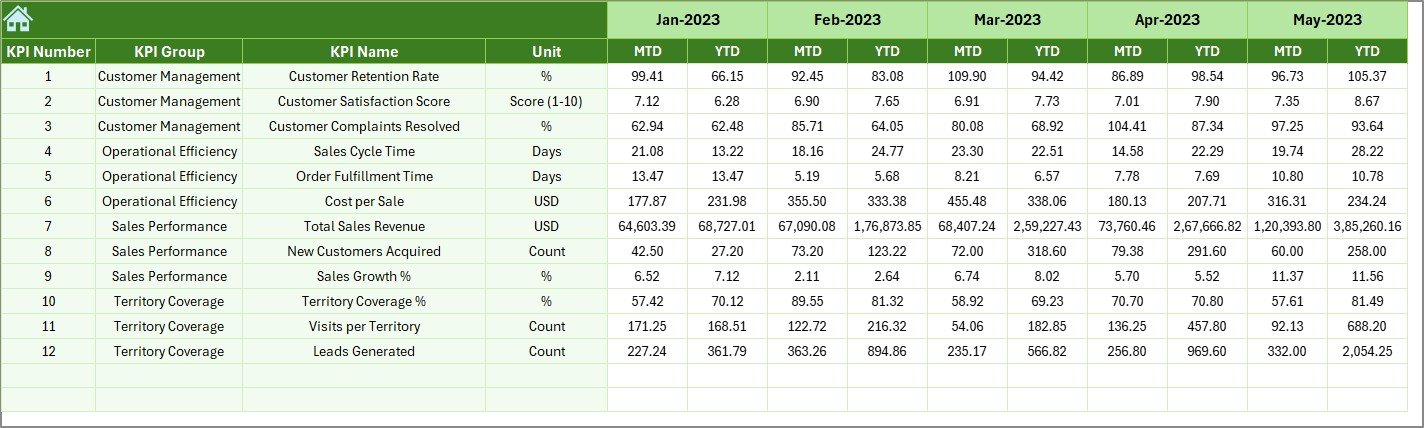
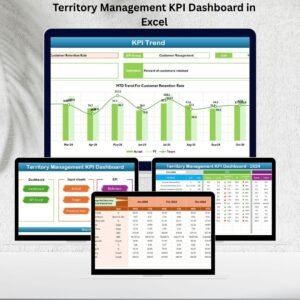
🔄 Trend Analysis – Track performance over time with visual trends for Actual, Target, and Previous Year values.
-
🎯 Target vs. Actual Comparison – Conditional formatting with up/down arrows highlights whether performance is on track.
-
📑 KPI Definition Sheet – Transparent definitions of all KPIs with formulas, units, and categories for consistency across teams.
-
🖊 Data Entry Made Simple – User-friendly input sheets for Actuals, Targets, and Previous Year numbers.
-
🏆 Comprehensive Coverage – Seven dedicated sheets including Dashboard, KPI Trend, Actual Numbers, Targets, Previous Year, Definitions, and Home navigation.
-
💰 Cost-Effective – 100% Excel-based solution, no extra software or hidden fees.

📂 What’s Inside the Territory Management KPI Dashboard in Excel
When you download this template, you’ll get a complete Excel file with the following sheets:
-
Home Sheet – Easy navigation with quick buttons.
-
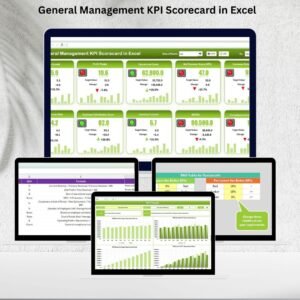
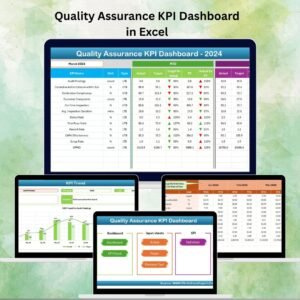
Dashboard Sheet – The central hub with KPI cards, slicers, and performance visuals.
-
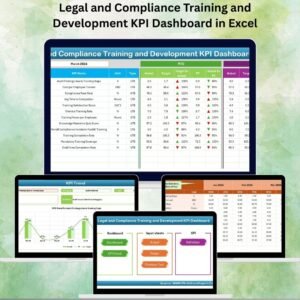
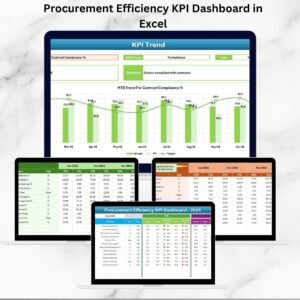
KPI Trend Sheet – In-depth performance trends over time.
-
Actual Numbers Input Sheet – Enter MTD and YTD figures manually.
-
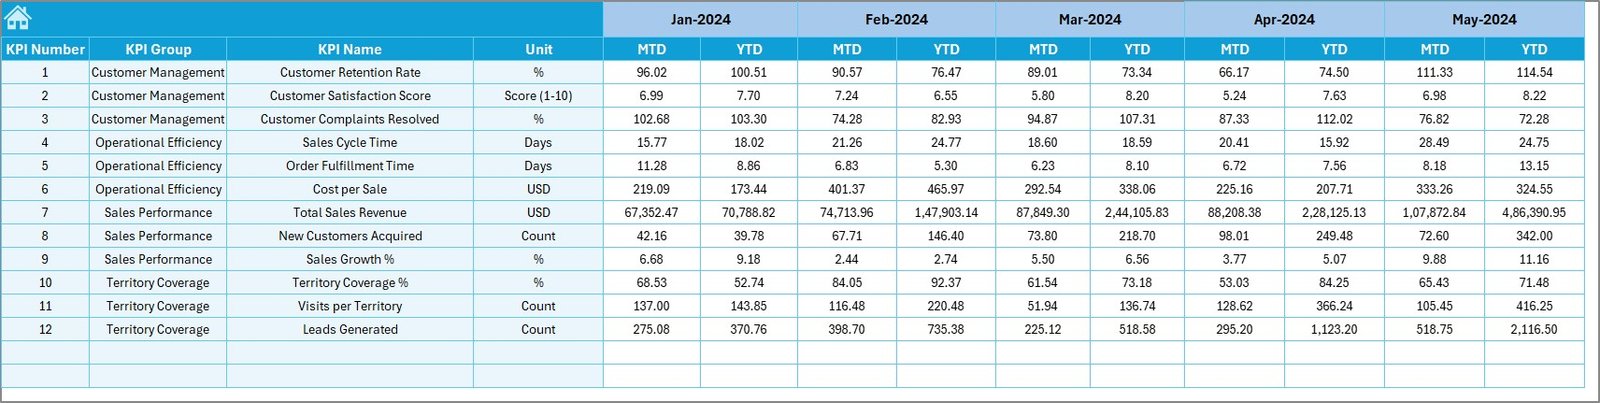
Target Sheet – Record monthly and yearly targets.
-
Previous Year Numbers Sheet – Store historical data for YoY comparisons.
-
KPI Definition Sheet – Detailed KPI descriptions for full transparency.
🛠 How to Use the Territory Management KPI Dashboard in Excel
-
Open the template in Excel.
-
Go to the KPI Definition Sheet and set up the KPIs you want to track.
-
Input monthly and yearly targets in the Target Sheet.
-
Add actual performance figures in the Actual Numbers Input Sheet.
-
Switch to the Dashboard or KPI Trend sheets to view insights.
-
Compare performance against targets and past data, then take corrective actions.
That’s it! No coding, no complex setup — just results-driven insights.
👥 Who Can Benefit from This Territory Management KPI Dashboard?
-
🏢 Sales Teams – Track reps’ performance across regions and align targets.
-
🛍 Retail Chains – Compare store-level performance to boost sales.
-
🏥 Healthcare Providers – Monitor patient visits or services by location.
-
🚚 Logistics Companies – Track delivery efficiency across territories.
-
🏭 Manufacturers – Monitor distribution channels and regional market share.
-
💼 Small & Large Businesses – Anyone who wants transparent, cost-effective KPI tracking.
This dashboard is designed to be flexible — whether you’re managing 5 territories or 50, it adapts to your business needs.
Click here to read the Detailed blog post
Watch the step-by-step video tutorial:
Visit our YouTube channel to learn step-by-step video tutorials.


Reviews
There are no reviews yet.