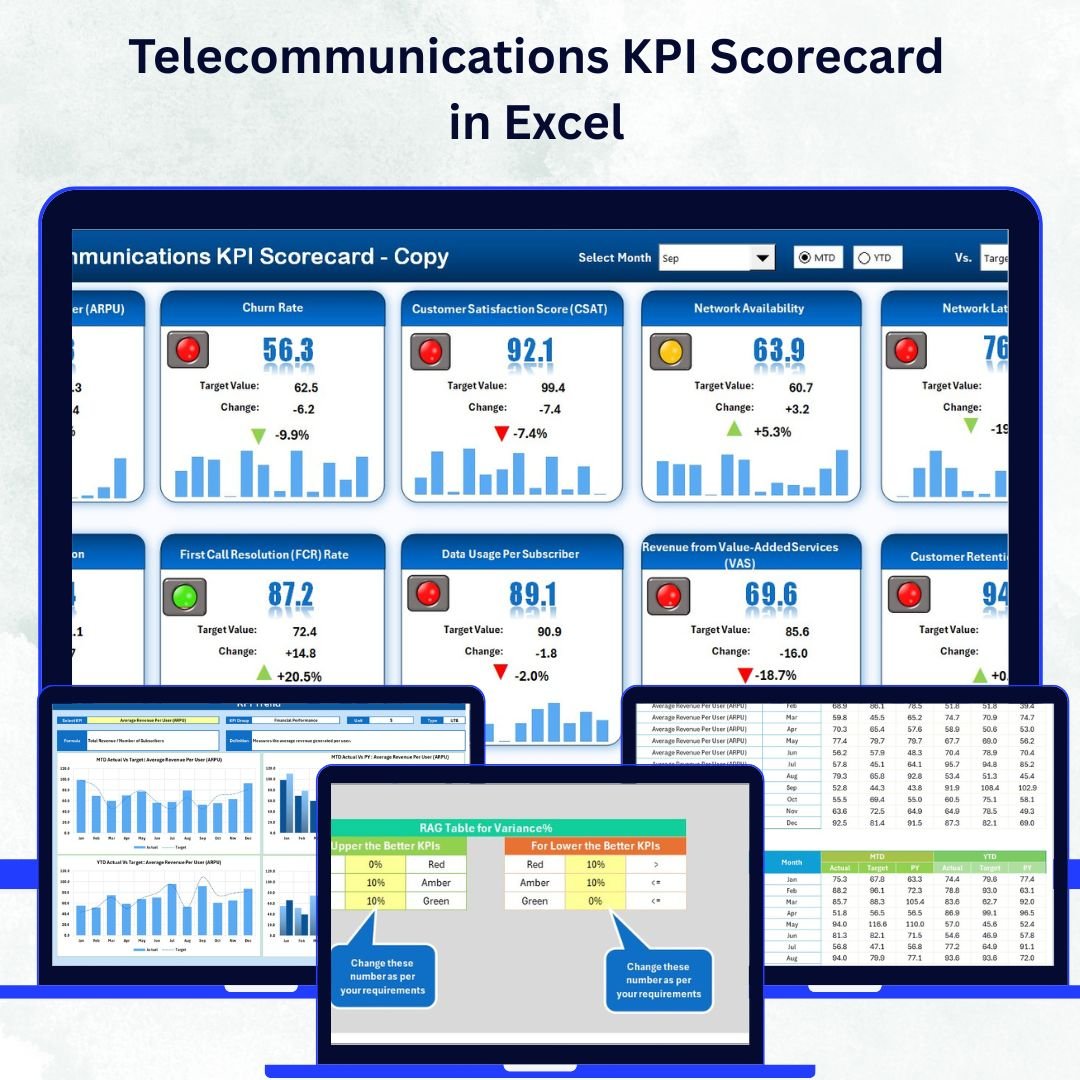
Telecommunications KPI Scorecard in Excel In today’s telecom landscape, data is the heartbeat of business performance. 📊 Network uptime, customer experience, churn rate, and revenue efficiency — every metric tells a story. The Telecommunications KPI Scorecard in Excel brings all those stories together into one interactive dashboard that turns complex datasets into clear, actionable insights.
This ready-to-use Excel-based tool helps telecom executives, operations teams, and analysts track performance, identify trends, and make faster decisions. Whether you manage mobile networks, fiber infrastructure, or enterprise services, this scorecard provides instant visibility into your most critical KPIs.
⚙️ Key Features of Telecommunications KPI Scorecard in Excel
📡 Centralized Monitoring – View network, financial, and customer KPIs in one place.
🎯 Actual vs Target Analysis – Instantly compare performance gaps and achievements.
📈 MTD & YTD Tracking – Switch between Month-to-Date and Year-to-Date views easily.
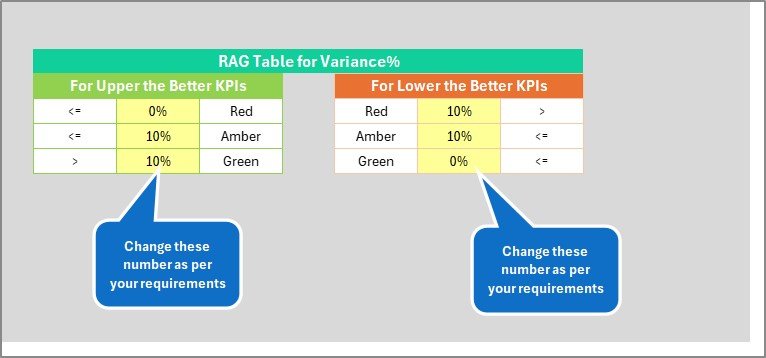
🎨 Color-Coded Visuals – Arrows and colors highlight improvement or decline.
📊 Trend Charts – Visualize Actual vs Target vs Previous Year progress over time.
🧮 Auto Calculations – Formulas update instantly when data changes.
💡 Customizable KPIs – Add new metrics or adjust existing ones to fit your goals.
💻 100% Excel-Based – No BI software or add-ins required.
📦 What’s Inside the Telecommunications KPI Scorecard
This template contains four interconnected worksheets designed to streamline data entry and visual reporting:
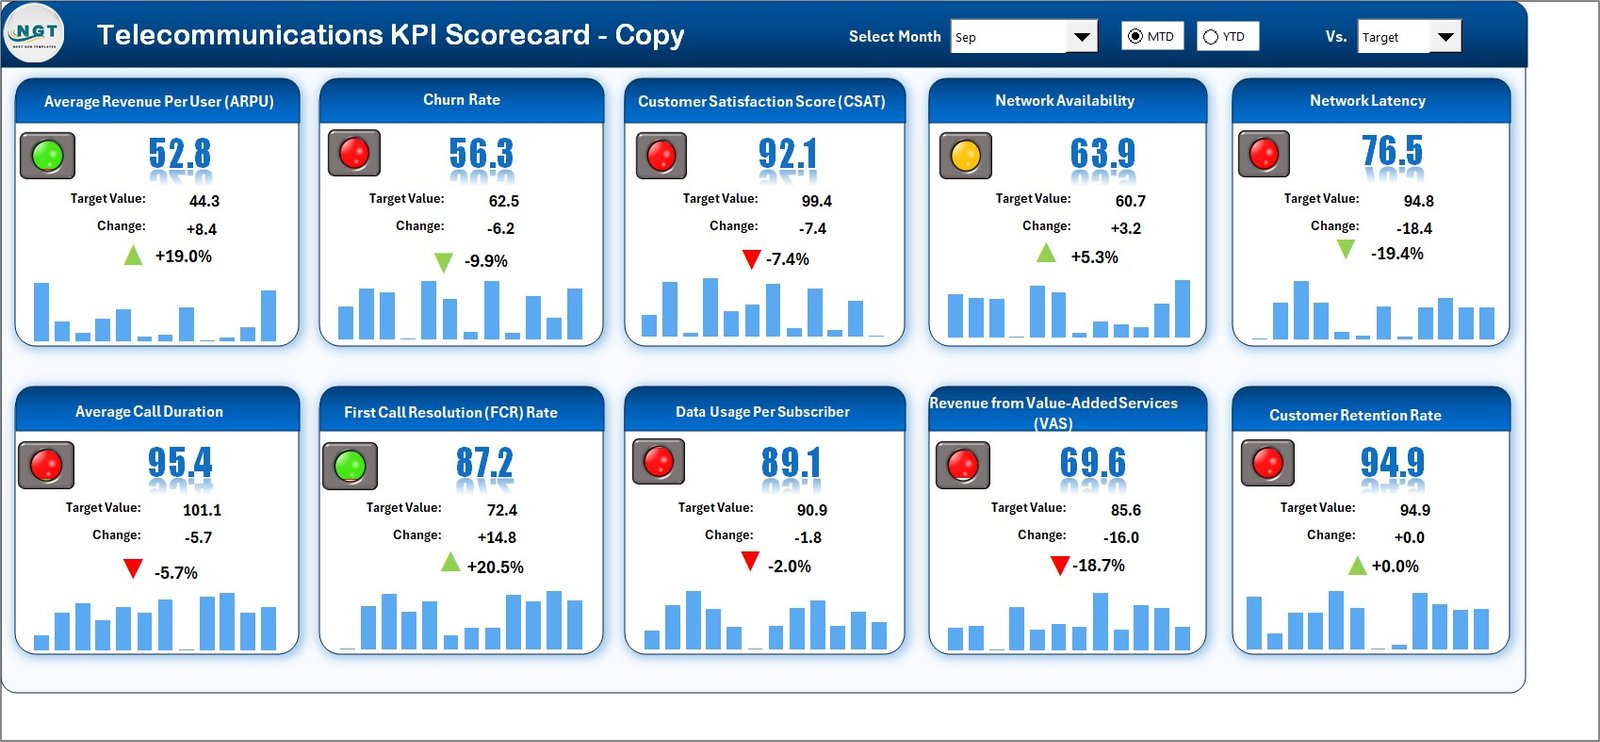
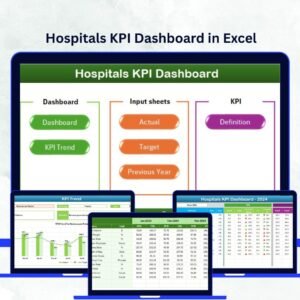
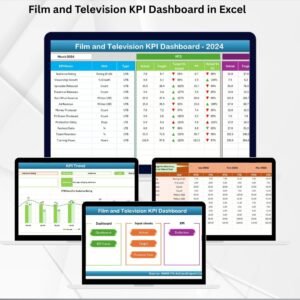
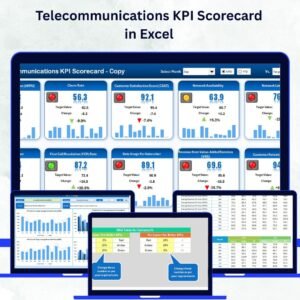
1️⃣ Scorecard Sheet – Main Dashboard
• Select Month and mode (MTD/YTD) from dropdown menus.
• Displays Actual, Target, and Previous Year figures for each KPI.
• Uses conditional formatting and arrows for instant performance feedback.
• Ideal for executive dashboards and monthly reviews.
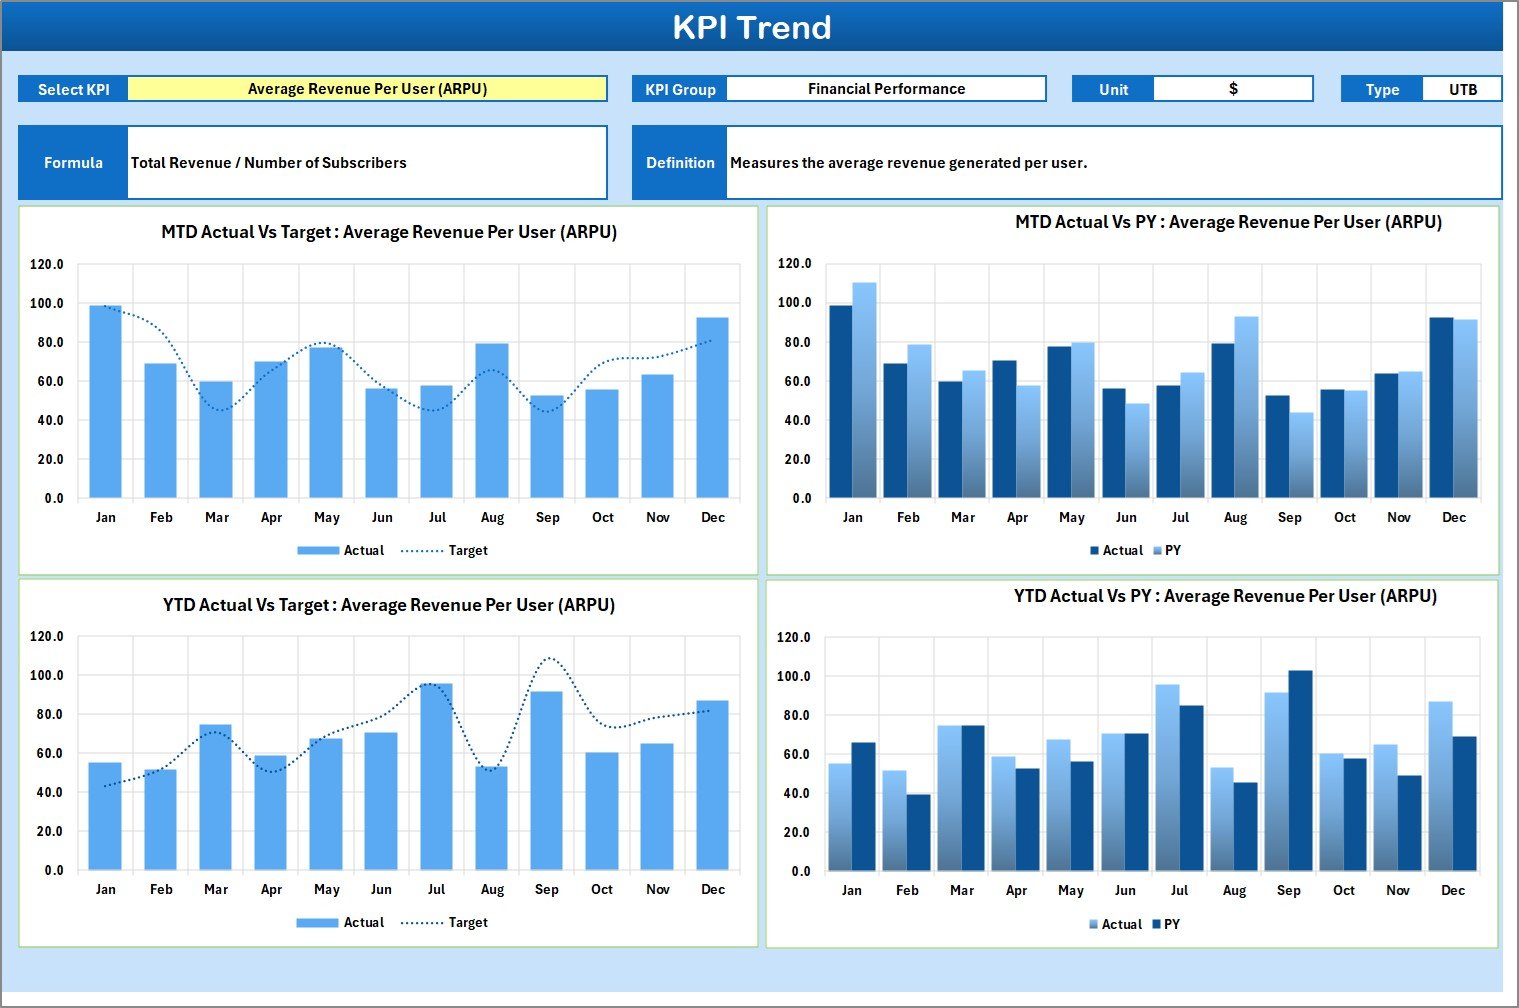
2️⃣ KPI Trend Sheet – Performance Over Time
• Choose any KPI (cell C3) to analyze its trend throughout the year.
• Shows KPI Group, Unit, Formula, Definition, and Type (UTB or LTB).
• Includes charts for Actual vs Target vs Previous Year comparisons.
• Reveals patterns in churn, latency, revenue, and customer experience.
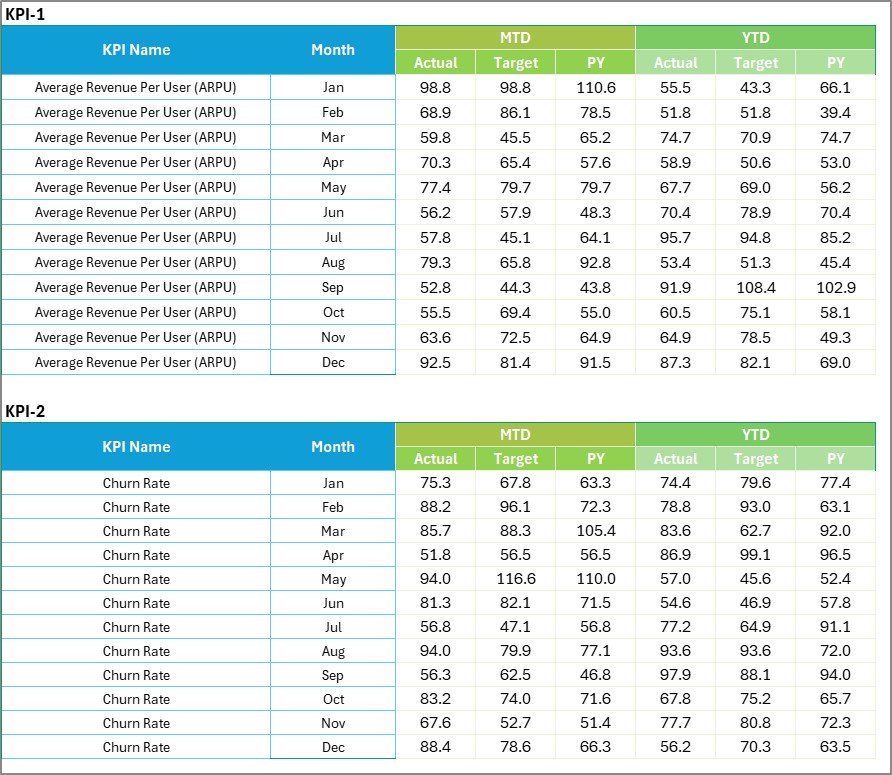
3️⃣ Input Data Sheet – Core Data Management
• Enter monthly Actual, Target, and Previous Year data for each KPI.
• Supports both MTD and YTD entries for accurate tracking.
• Easily update new data as it arrives from your network or CRM systems.
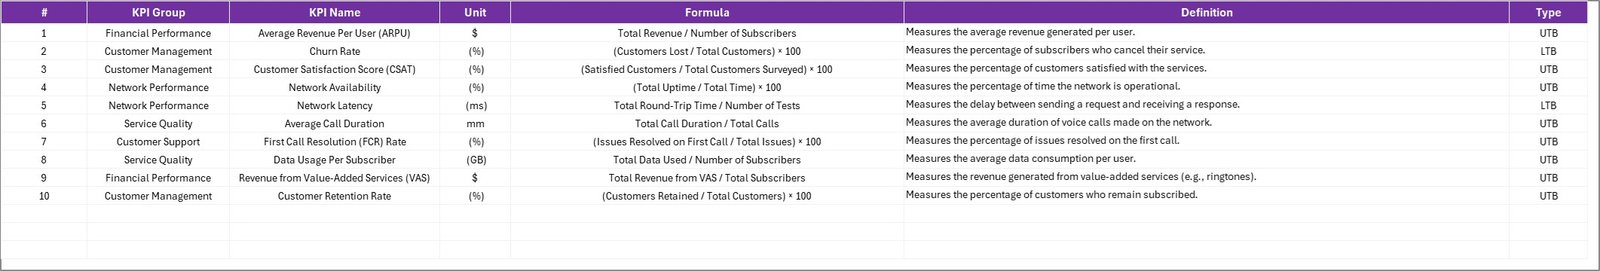
4️⃣ KPI Definition Sheet – Transparency & Consistency
• Defines each metric with columns for Group, Unit, Formula, and Definition.
• Maintains standardized reporting across departments.
• Simplifies future automation or integration with Power BI.
🧭 How to Use the Telecommunications KPI Scorecard
🪄 Step 1: List all KPIs and definitions in the KPI Definition sheet.
📊 Step 2: Input Actual, Target, and Previous Year numbers in the Input Data sheet.
📈 Step 3: Use the KPI Trend sheet to visualize performance over time.
🎯 Step 4: Analyze results on the Scorecard sheet using MTD and YTD views.
📅 Step 5: Update monthly to keep management reports accurate and current.
Within minutes, you’ll have a real-time overview of your telecom operations — from network stability to financial growth. 🚀
👥 Who Can Benefit from This Scorecard
📡 Telecom Operations Managers – Monitor uptime and infrastructure performance.
💰 Finance Teams – Track ARPU, revenue, and cost efficiency.
📞 Customer Experience Leads – Analyze complaint resolution and satisfaction.
🧠 Data Analysts – Identify patterns and correlations between KPIs.
🎯 Executives & Strategic Planners – Drive decisions through data insights.
Whether you operate regionally or globally, this scorecard simplifies performance tracking and boosts decision accuracy across teams.
🔗 Click here to read the Detailed Blog Post
🎥 Visit our YouTube channel to learn step-by-step video tutorials
Watch the step-by-step video tutorial:


Reviews
There are no reviews yet.