Technical support teams are the backbone of customer satisfaction and operational stability. Every ticket response, resolution time, and customer interaction directly affects user trust and business continuity. However, many organizations still rely on scattered ticketing exports, static spreadsheets, or delayed reports to measure support performance. As a result, teams struggle to identify bottlenecks, meet SLAs, and improve service quality.
That is exactly why a Technical Support KPI Dashboard in Google Sheets becomes an essential performance monitoring solution.
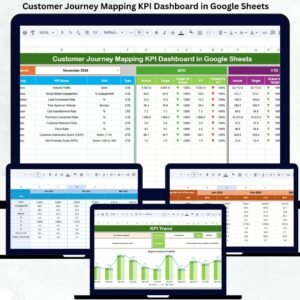
This ready-to-use dashboard provides a structured and centralized way to track technical support performance using clearly defined KPIs. Instead of manually analyzing ticket logs, teams gain instant visibility into response efficiency, resolution effectiveness, workload balance, and trend performance—supported by automated calculations and visual indicators.
Because the dashboard is built in Google Sheets, it remains easy to use, collaborative, and accessible from anywhere without expensive BI tools or complex integrations.
🚀 Key Features of the Technical Support KPI Dashboard
📌 Centralized Support Performance Tracking
Monitor all technical support KPIs from one unified dashboard.
⏱️ Response & Resolution Visibility
Track how quickly tickets are handled and resolved.
🎯 Target vs Actual Monitoring
Measure performance against defined SLAs and benchmarks.
📅 MTD & YTD Insights
Analyze short-term execution and long-term performance trends.
📊 Visual Performance Indicators
Instantly spot improvement or decline using conditional arrows.
🔍 KPI Trend Analysis
Understand how support performance changes month over month.
📦 What’s Inside the Technical Support KPI Dashboard
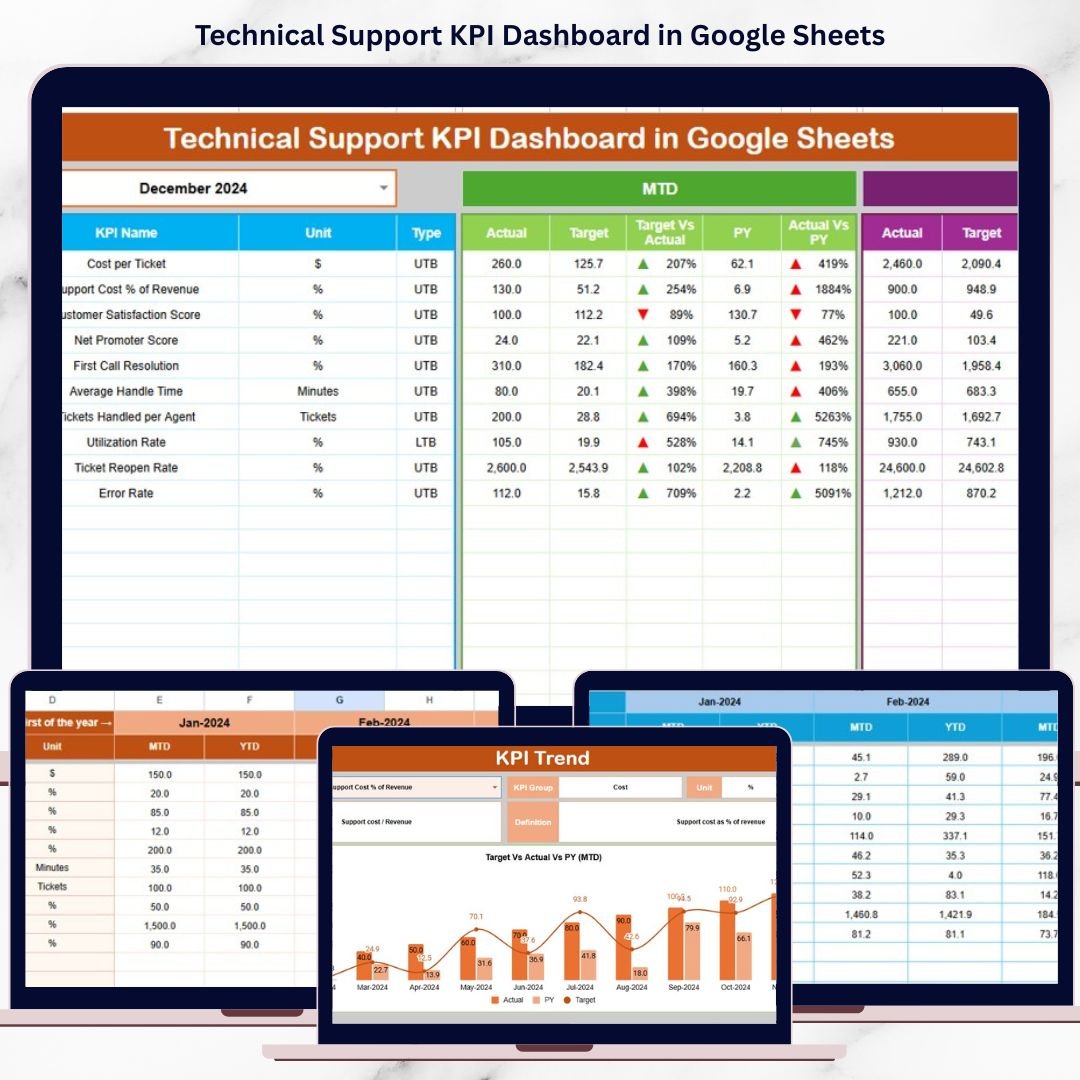
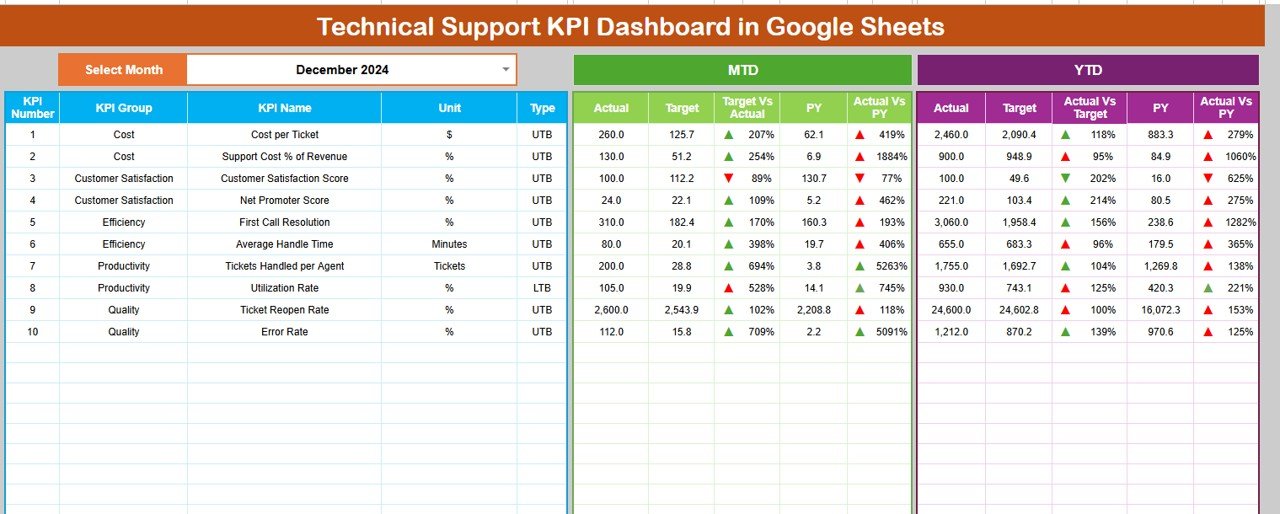
🗂️ Dashboard Sheet Tab – Main KPI Overview
The Dashboard Sheet acts as the executive summary for technical support operations.
🔄 Month Selection
Select the reporting month from Cell D3, and the entire dashboard updates automatically.
📅 MTD KPIs Displayed
For each KPI, the dashboard shows:
-
MTD Actual
-
MTD Target
-
MTD Previous Year
-
Target vs Actual (%)
-
Previous Year vs Actual (%)
Directional arrows clearly indicate whether performance is improving or declining.
📈 YTD KPIs Displayed
The dashboard also tracks:
-
YTD Actual
-
YTD Target
-
YTD Previous Year
-
Target vs Actual (%)
-
Previous Year vs Actual (%)
This view supports long-term service quality and capacity planning.
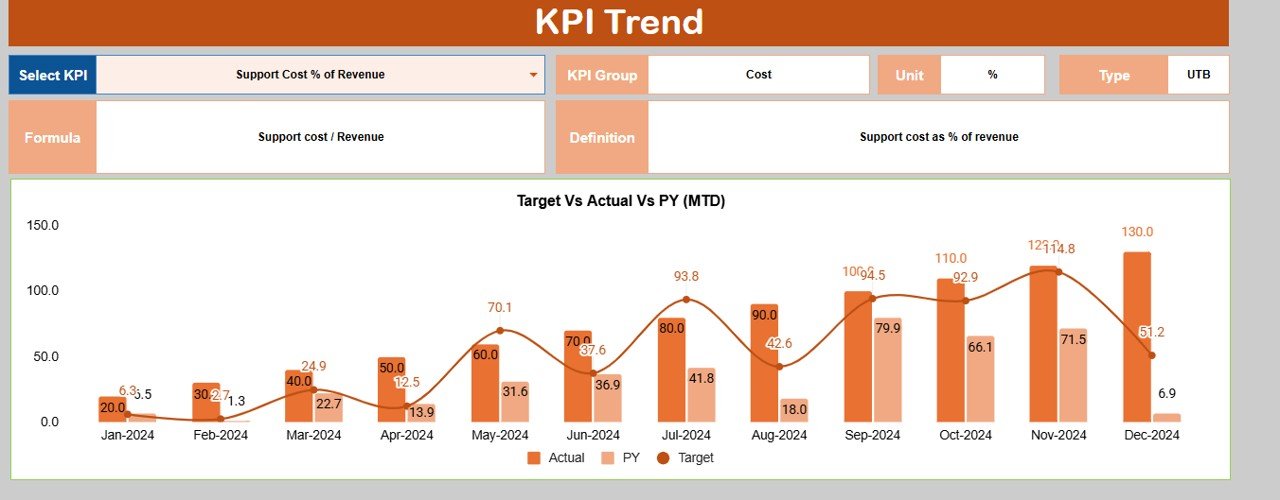
📊 KPI Trend Sheet Tab – KPI Deep Dive
The KPI Trend Sheet helps teams understand each KPI in detail.
🔎 How It Works
Select a KPI name from the dropdown in Cell C3, and the sheet updates dynamically.
📌 Displayed KPI Details
-
KPI Group
-
KPI Unit
-
KPI Type (Upper the Better / Lower the Better)
-
KPI Formula
-
KPI Definition
This ensures consistent KPI interpretation across support teams and leadership.
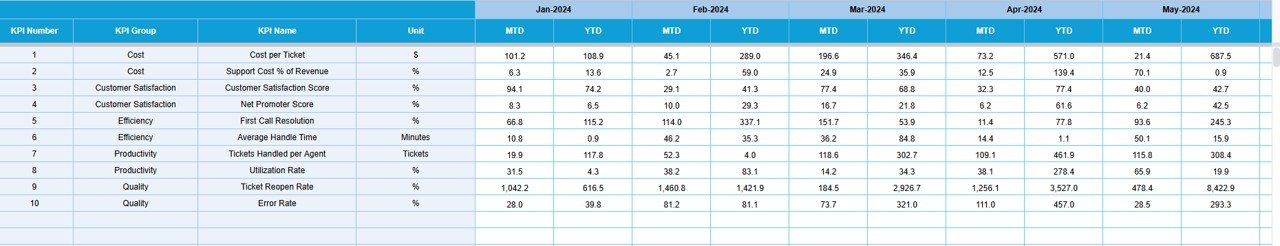
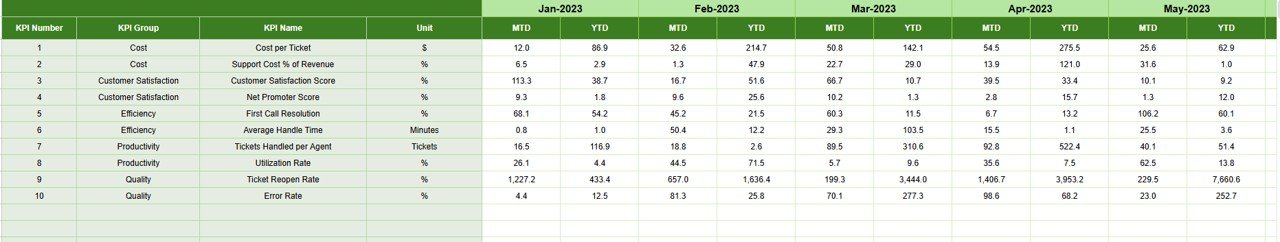
🧮 Actual Number Sheet Tab
This sheet stores actual technical support performance data.
🛠️ How to Use
-
Enter the first month of the year in Cell E1
-
Input MTD Actual and YTD Actual values
All dashboard KPIs update automatically, ensuring accuracy and consistency.
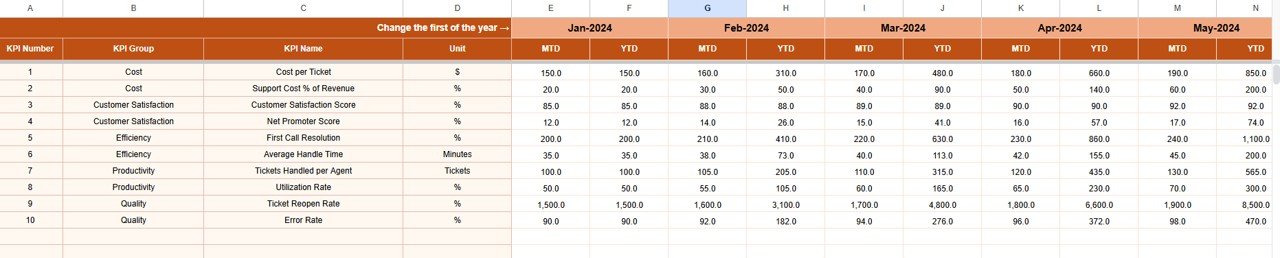
🎯 Target Sheet Tab
The Target Sheet defines expected technical support performance.
📥 Data Entry
-
Enter MTD Target values
-
Enter cumulative YTD Target values
Targets help teams measure success objectively and maintain SLA discipline.
📆 Previous Year Number Sheet Tab
This sheet enables historical comparison.
🎯 Purpose
-
Enter previous year MTD and YTD values
-
Identify recurring support issues
-
Measure year-over-year improvement
Historical insights support continuous service improvement.
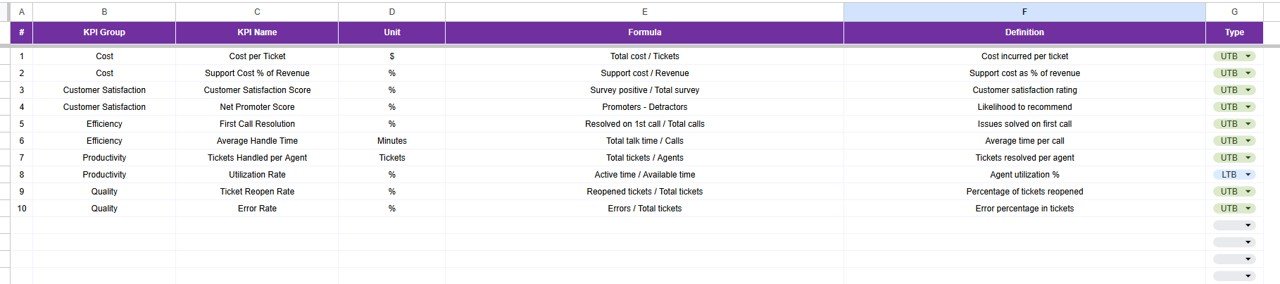
📚 KPI Definition Sheet Tab – KPI Master Library
This sheet acts as the single source of truth.
📋 Fields Included
-
KPI Name
-
KPI Group
-
Unit
-
Formula
-
KPI Definition
-
KPI Type
🎯 Who Can Benefit from This Technical Support KPI Dashboard
-
🖥️ IT Support & Service Desk Teams
-
☁️ SaaS & Application Support Teams
-
📋 Operations & Support Managers
-
📊 Customer Experience Teams
-
🚀 Organizations of All Sizes
🛠️ How to Use the Technical Support KPI Dashboard
-
Enter actual ticket performance data monthly
-
Define realistic SLA-based targets
-
Review MTD and YTD KPIs regularly
-
Analyze trends using the KPI Trend Sheet
-
Act quickly on declining performance indicators
Consistent usage improves response speed, resolution quality, and customer satisfaction.
🔗 ### Click here to read the Detailed blog post
Watch the step-by-step video tutorial:
▶️ Visit our YouTube channel to learn step-by-step video tutorials
👉 Youtube.com/@NeotechNavigators


Reviews
There are no reviews yet.