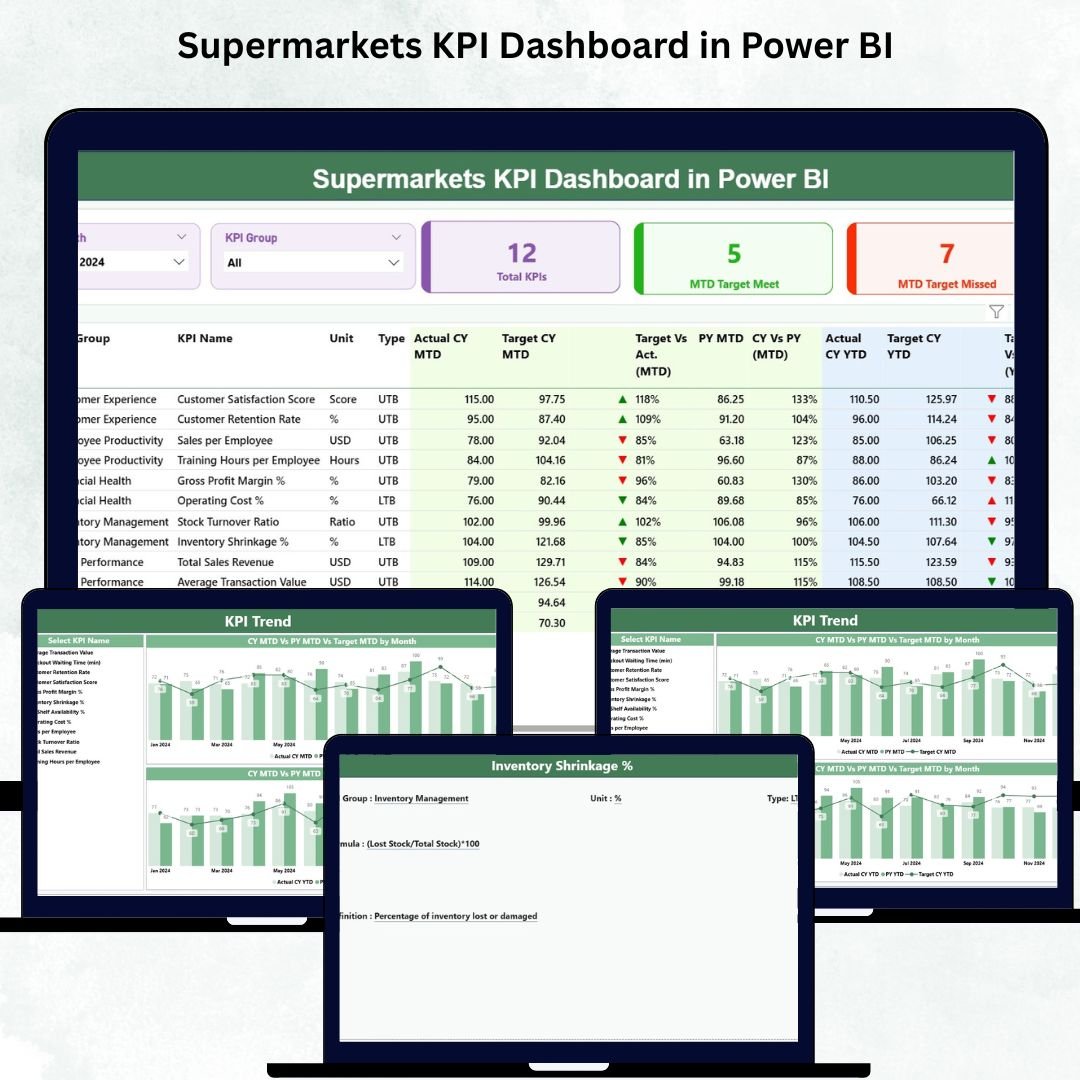
Supermarkets operate in a fast-paced, competitive environment where every decision matters. Sales trends change daily, customer preferences shift quickly, and inventory must stay updated at all times. Managing thousands of SKUs, monitoring margins, tracking operational KPIs, and maintaining customer satisfaction can be overwhelming when teams rely on scattered spreadsheets or manual reports. The Supermarkets KPI Dashboard in Power BI solves these challenges by bringing all essential KPIs into one clean, interactive, and easy-to-monitor dashboard.
This dashboard helps supermarket leaders, analysts, managers, and executives track performance in seconds. You can monitor MTD & YTD numbers, compare results with targets, review previous-year data, analyze monthly trends, and evaluate store-wide performance visually. Designed for daily, weekly, and monthly reporting, this dashboard improves accuracy, saves time, and helps you predict business needs before problems escalate.
⭐ Key Features of the Supermarkets KPI Dashboard in Power BI
✨ Clear & Intuitive Summary Page
Get a full snapshot of sales, operations, inventory, and customer performance with slicers, KPI cards, and a dynamic KPI table.
📅 Month Selector & KPI Group Filters
Choose any month and instantly filter KPIs by categories like sales, operations, supply chain, customer metrics, and financial indicators.
📊 MTD & YTD Scorecards
Track actual results vs targets with ▲ (green) and ▼ (red) performance icons for instant clarity.
📈 Trend Visualization Charts
View two powerful combo charts that show how each KPI behaves month-to-month and year-to-year.
📘 Drill-Through KPI Definition Page
Access formulas, units, definitions, and KPI meanings — ideal for team training and cross-department standardization.
📁 Excel-Based Data Input
Simply update the Actual, Target, and Definition sheets in Excel and refresh Power BI — no technical skills needed.
🛍 Designed for All Supermarket Sizes
From single stores to large supermarket chains, this dashboard scales effortlessly for every business type.
⭐ What’s Inside the Supermarkets KPI Dashboard in Power BI
This dashboard includes three powerful pages, each designed to deliver deep and actionable insights.
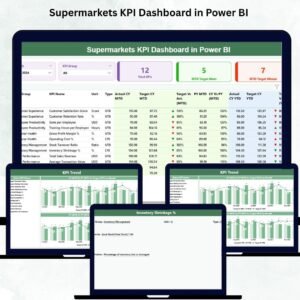
📌 1. Summary Page – The Main Control Center
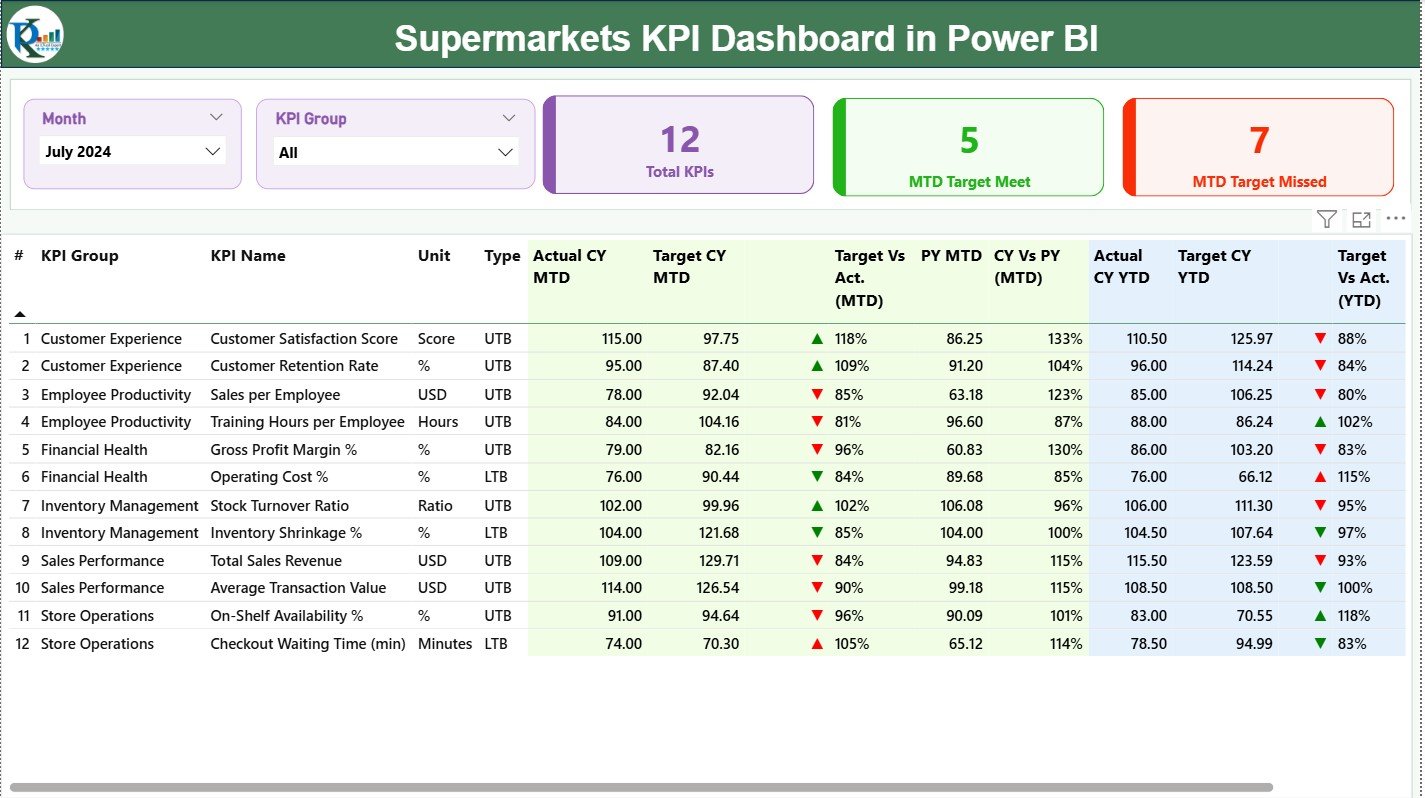
The Summary Page brings all major KPIs to one screen. With two slicers — Month and KPI Group — you can filter results instantly. The page includes:
-
⭐ Total KPIs Count
-
⭐ MTD Target Met Count
-
⭐ MTD Target Missed Count
Below the cards, a detailed KPI table shows:
-
KPI Number
-
KPI Group
-
KPI Name
-
Unit
-
Type (UTB/LTB)
-
MTD Actual, Target & Achievement
-
PY MTD & CY vs PY %
-
YTD Actual, Target & Achievement
-
PY YTD & CY vs PY %
Icons, colors, and percentages make it easy to understand performance at a glance.
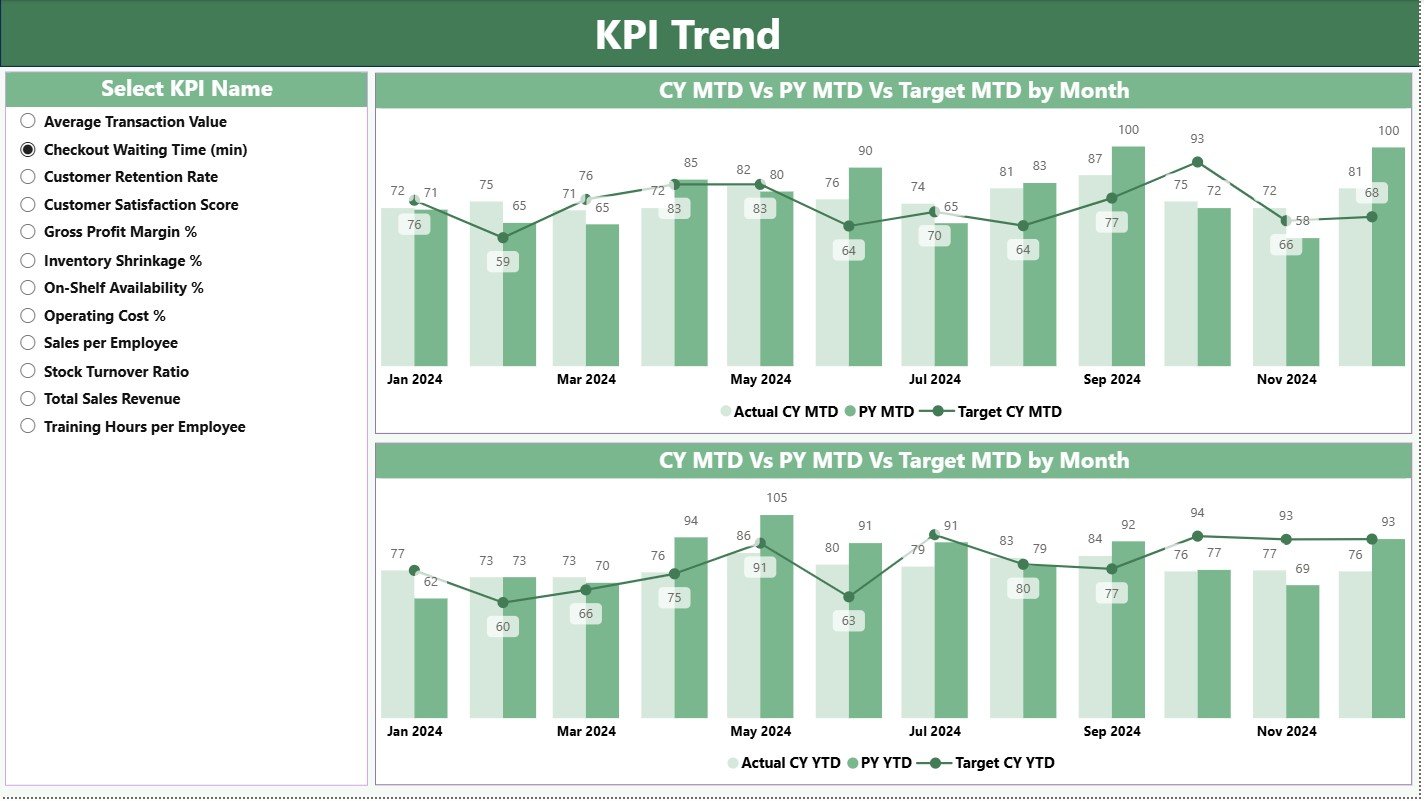
📌 2. KPI Trend Page – Visualize Performance Patterns
This page helps leaders track monthly and yearly patterns for any KPI selected.
It includes two combo charts:
📈 MTD Trend Chart – CY MTD, PY MTD & Targets
📉 YTD Trend Chart – CY YTD, PY YTD & Targets
Perfect for identifying demand cycles, seasonal changes, risk signals, and long-term growth trends across:
-
Sales KPIs
-
Customer behavior
-
Operations & stock
-
Financial metrics
-
Supply chain KPIs
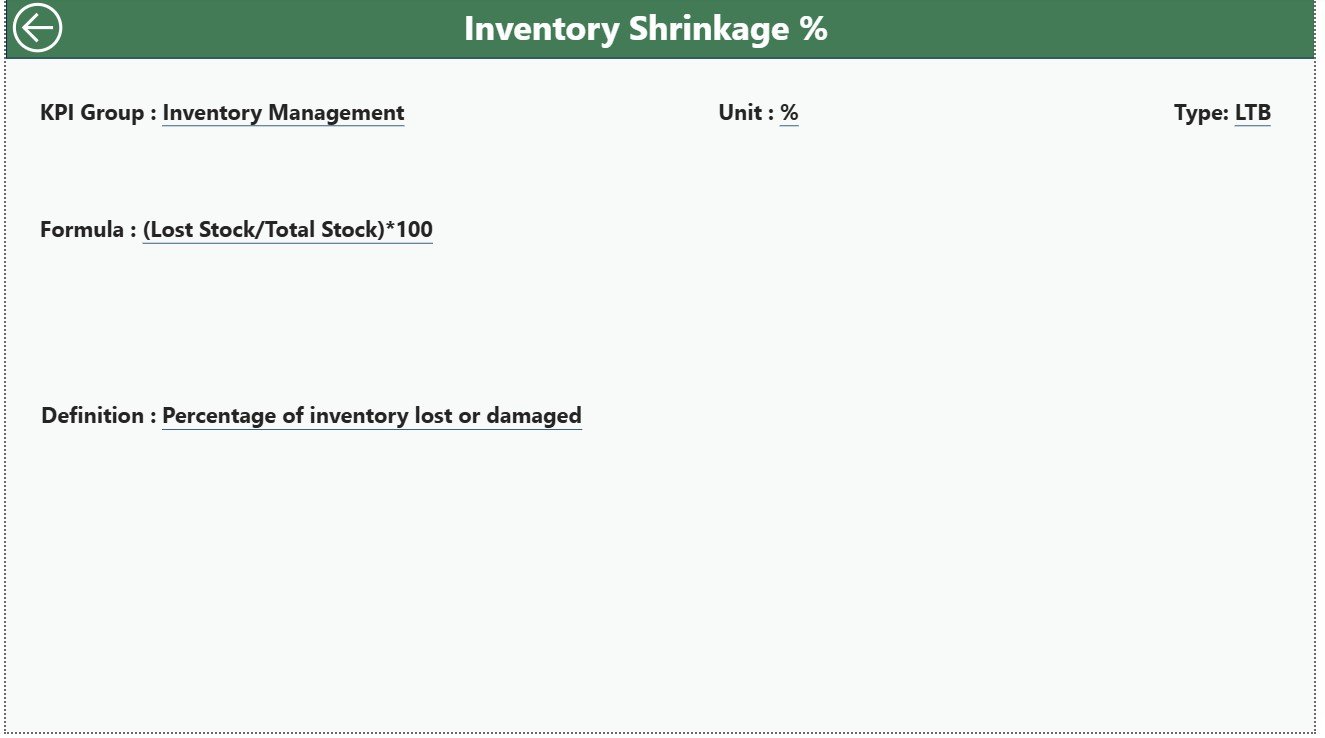
📌 3. KPI Definition Page – Transparent KPI Documentation
This drill-through page provides:
-
KPI Number
-
KPI Name
-
KPI Group
-
Unit
-
Formula
-
KPI Definition
-
Type (UTB/LTB)
This ensures consistency across teams and supports better decision-making and accurate reporting.
⭐ How to Use the Supermarkets KPI Dashboard in Power BI
Using this dashboard is simple:
🟦 Step 1: Add actual performance data in Input_Actual
🟦 Step 2: Enter MTD & YTD targets in Input_Target
🟦 Step 3: Maintain KPI definitions in the KPI Definition sheet
🟦 Step 4: Refresh the Power BI dashboard
🟦 Step 5: Apply slicers to filter Month and KPI Groups
🟦 Step 6: Explore trends and drill-through details
🟦 Step 7: Use insights for performance reviews & planning
No coding, no formulas, no complexity — just update Excel and refresh.
⭐ Who Can Benefit from This Supermarkets KPI Dashboard
This dashboard is perfect for:
🏬 Store Managers – Monitor sales, stock, and daily operations
📊 Business Analysts – Track trends and analyze KPIs deeply
💼 Supermarket Owners – View complete MTD/YTD performance
📦 Procurement & Inventory Teams – Manage stock, wastage & availability
📞 Customer Experience Teams – Improve complaint handling & satisfaction
💰 Finance Teams – Track margins, revenue & YTD financial KPIs
⚙️ Operations Teams – Monitor efficiency, process performance & KPIs
From small neighbourhood stores to multi-chain supermarkets, this dashboard supports smart decision-making at every level.


Reviews
There are no reviews yet.