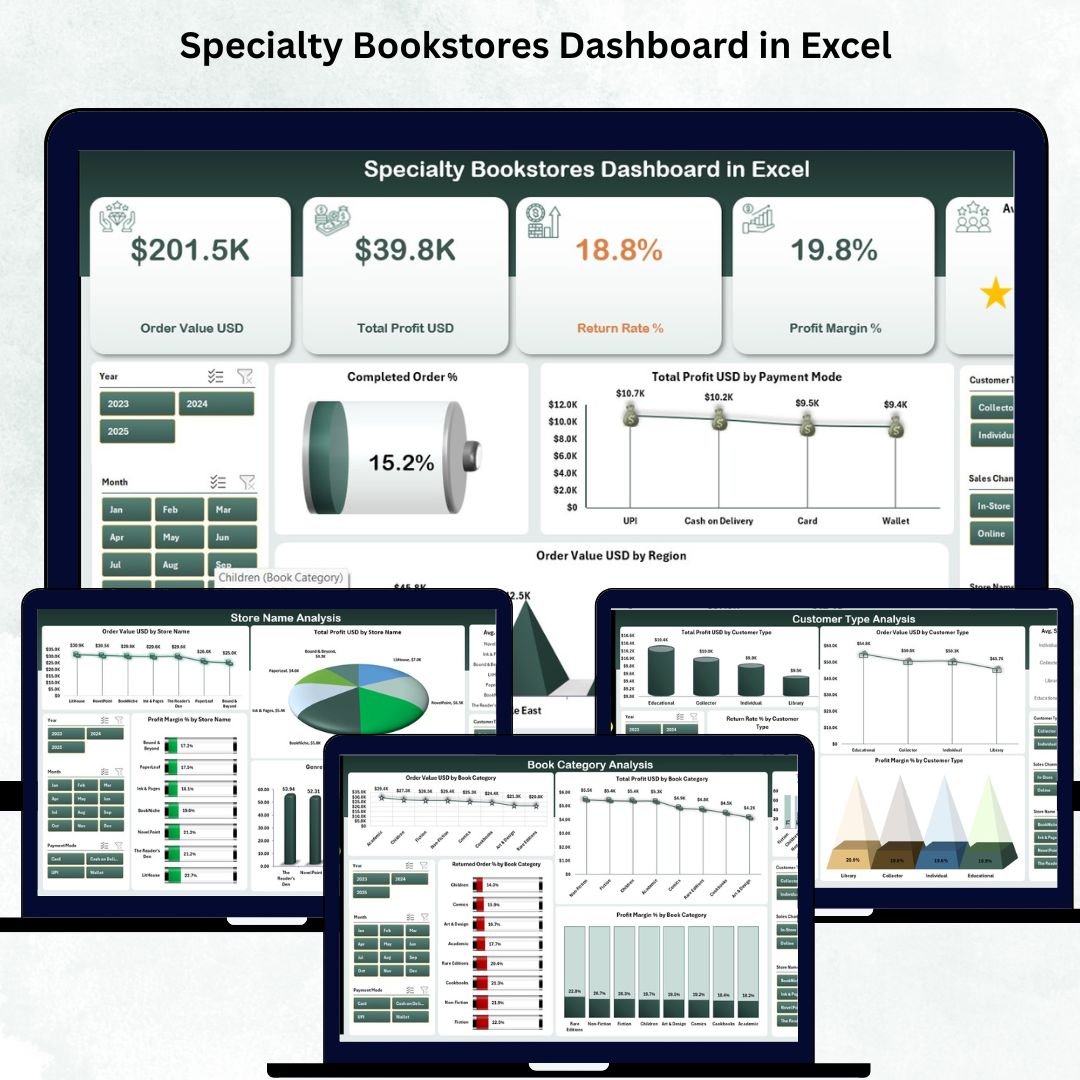
Managing a specialty bookstore is exciting, but it comes with daily challenges—tracking orders, analyzing book categories, managing returns, understanding customer types, and finding out which stores perform the best. When all this data lives in scattered spreadsheets, decision-making becomes slow. That’s exactly why the Specialty Bookstores Dashboard in Excel was created — to help bookstore owners take control, save time, and boost profitability with ease.
This ready-to-use Excel dashboard transforms complex data into stunning visuals, simple KPIs, and easy-to-read charts. Whether you run a comic store, children’s bookstore, vintage bookshop, academic book center, religious bookstore, or niche-category shop, this dashboard brings clarity to your operations and helps you make smart business decisions.
✨ Key Features of Specialty Bookstores Dashboard in Excel
This dashboard is packed with powerful features designed for real bookstore operations:
📌 Page Navigator
A clean left-side page navigator helps you move across different analytical pages with just one click — no scrolling, no confusion.
📌 Ready-Made Analytics Pages
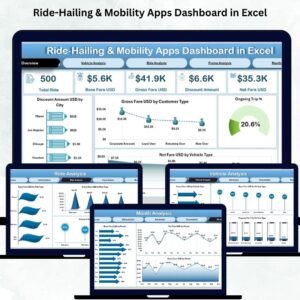
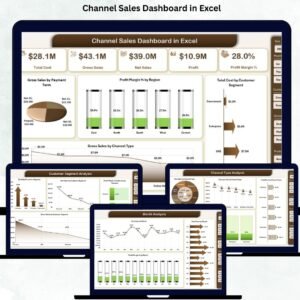
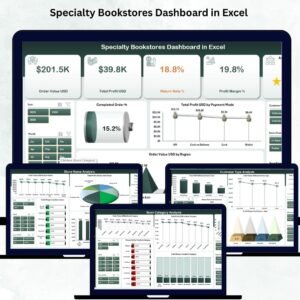
It includes five professional pages: Overview, Store Name Analysis, Book Category Analysis, Customer Type Analysis, and Monthly Trends — each loaded with insightful charts.
📌 Automated KPIs & Charts
All charts refresh automatically from your data. You simply update the Data Sheet and everything updates instantly.
📌 Advanced Visual Insights
Track customer satisfaction, profit margin %, payment-mode performance, return rate %, store-wise trends, and more.
📦 What’s Inside the Specialty Bookstores Dashboard in Excel
When you download the file, you get a complete analytical ecosystem:
🗂️ Overview Page
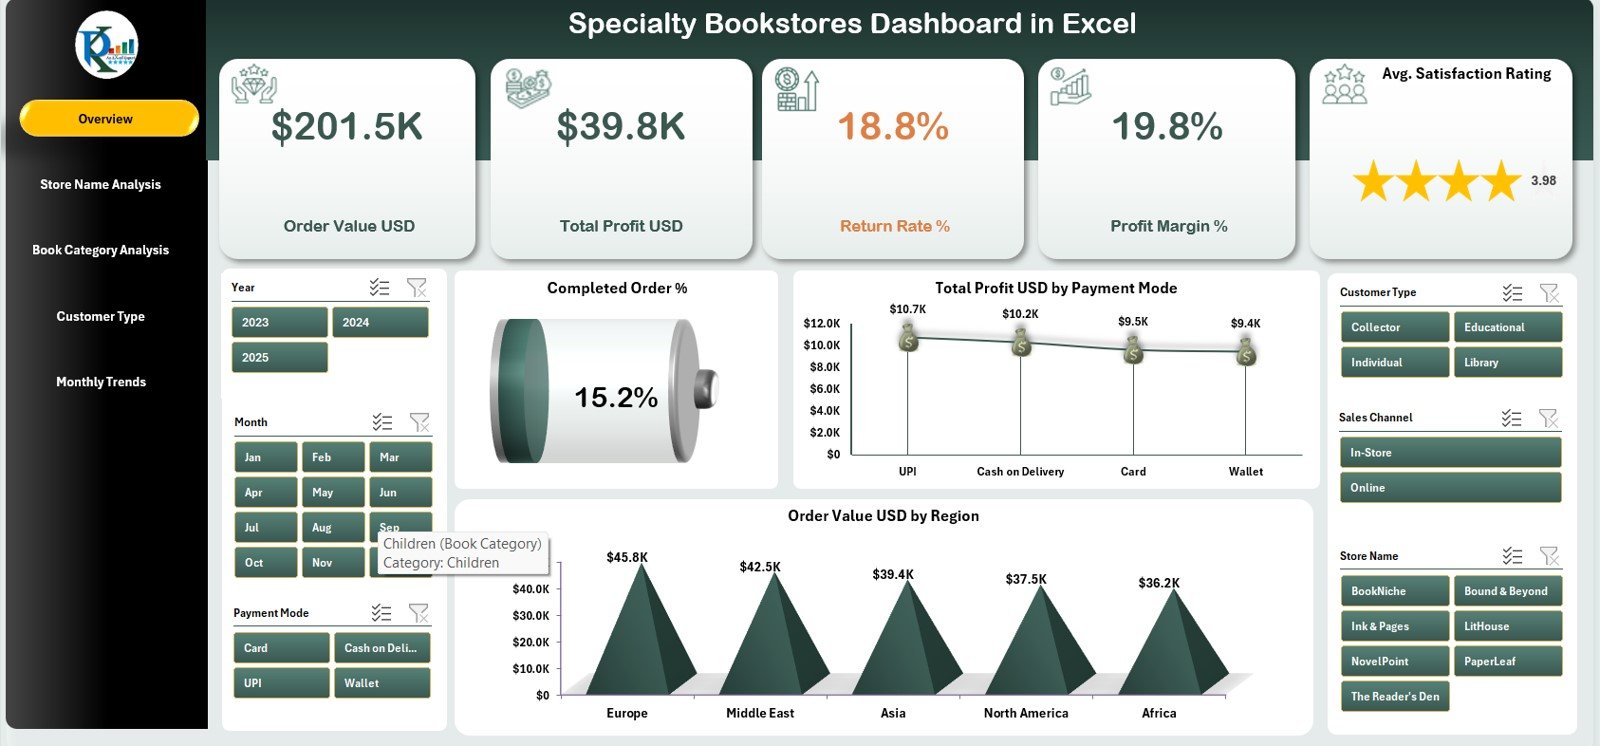
A high-level summary with KPI cards and charts like Completed Order %, Total Profit by Payment Mode, and Order Value by Region.
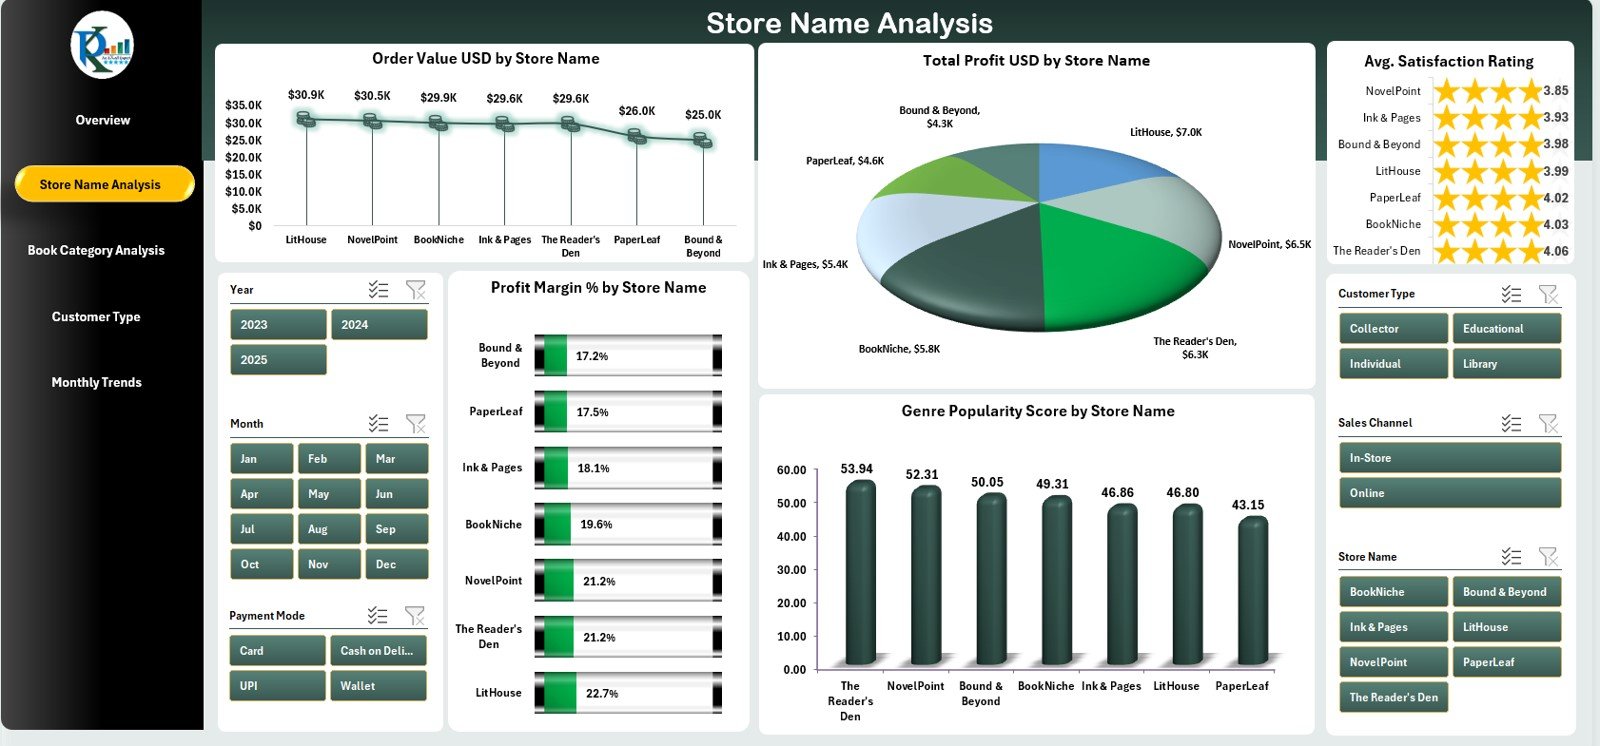
🏪 Store Name Analysis Page
Perfect for multi-branch bookstores. Compare order value, profit, satisfaction rating, and genre popularity across stores.
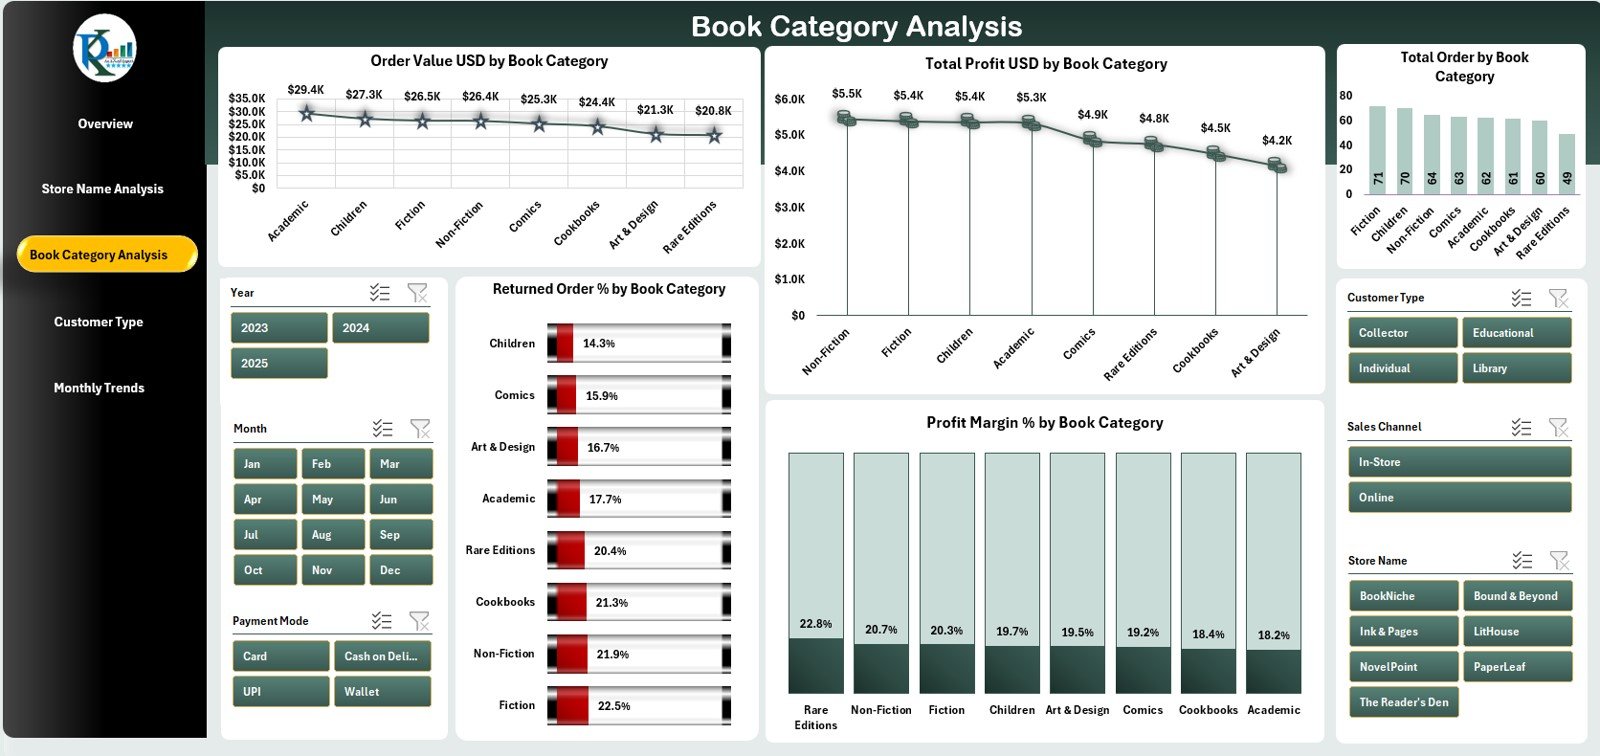
📚 Book Category Analysis Page
See which genres perform best, track return percentages, and discover profit trends across book categories.
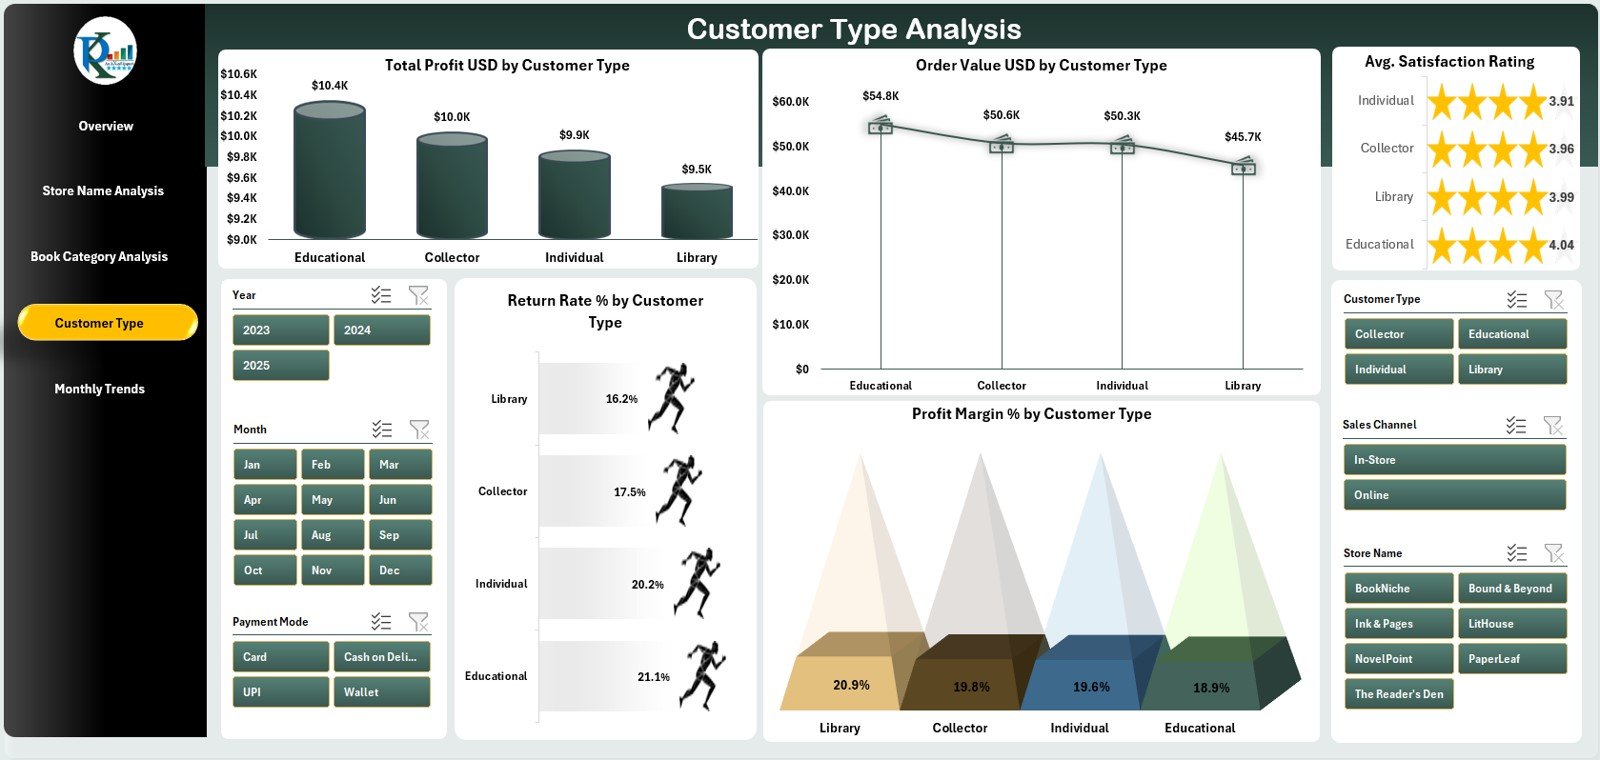
👥 Customer Type Analysis Page
Understand reader behavior with charts for profit, order value, satisfaction rating, and return rate across customer groups.
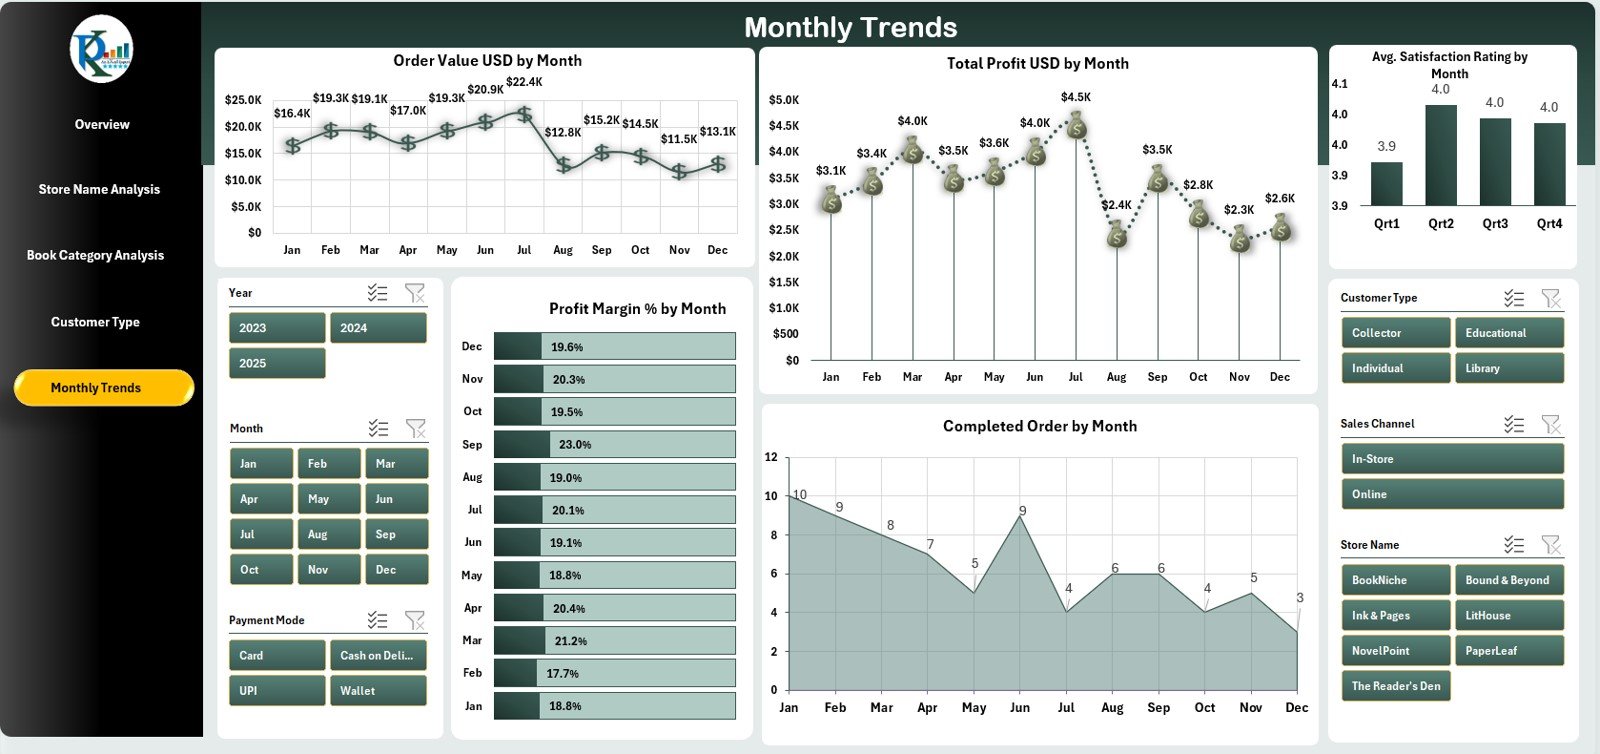
📅 Monthly Trends Page
Spot seasonal trends with charts showing order value, profit, satisfaction rating, and monthly completed orders.
🔧 Support Sheet + Data Sheet
Includes all calculations, lookup tables, and raw data structure. You only update your data — the dashboard handles the rest.
🧭 How to Use the Specialty Bookstores Dashboard in Excel
Using this dashboard is simple and beginner-friendly:
👉 Step 1: Update Your Data
Enter order details, book category, customer type, payment mode, and rating in the Data Sheet.
👉 Step 2: Refresh Your Pivot Tables
Your charts and KPIs update automatically using Excel’s formulas and pivot tables.
👉 Step 3: Explore Insights
Use slicers and navigation buttons to explore store performance, category trends, customer behaviors, and profit results.
👉 Step 4: Take Business Actions
Find slow-moving categories, identify top-performing stores, plan promotions, and improve stock planning.
🎯 Who Can Benefit from This Specialty Bookstores Dashboard?
This dashboard is perfect for:
📌 Bookstore Owners
Track everything from profits to monthly sales trends.
📌 Franchise Operators
Compare and improve performance across multiple branches.
📌 Managers & Decision-Makers
Use visual insights to make fast and accurate decisions.
📌 Niche Book Sellers
Academic, comic, religious, children’s, art, travel, and genre-specific bookstores.
📌 Startup Book Businesses
A ready-to-use system to analyze performance without expensive software.
If you want instant insights, better visibility, faster decisions, and higher profitability — this dashboard is made for you.


Reviews
There are no reviews yet.