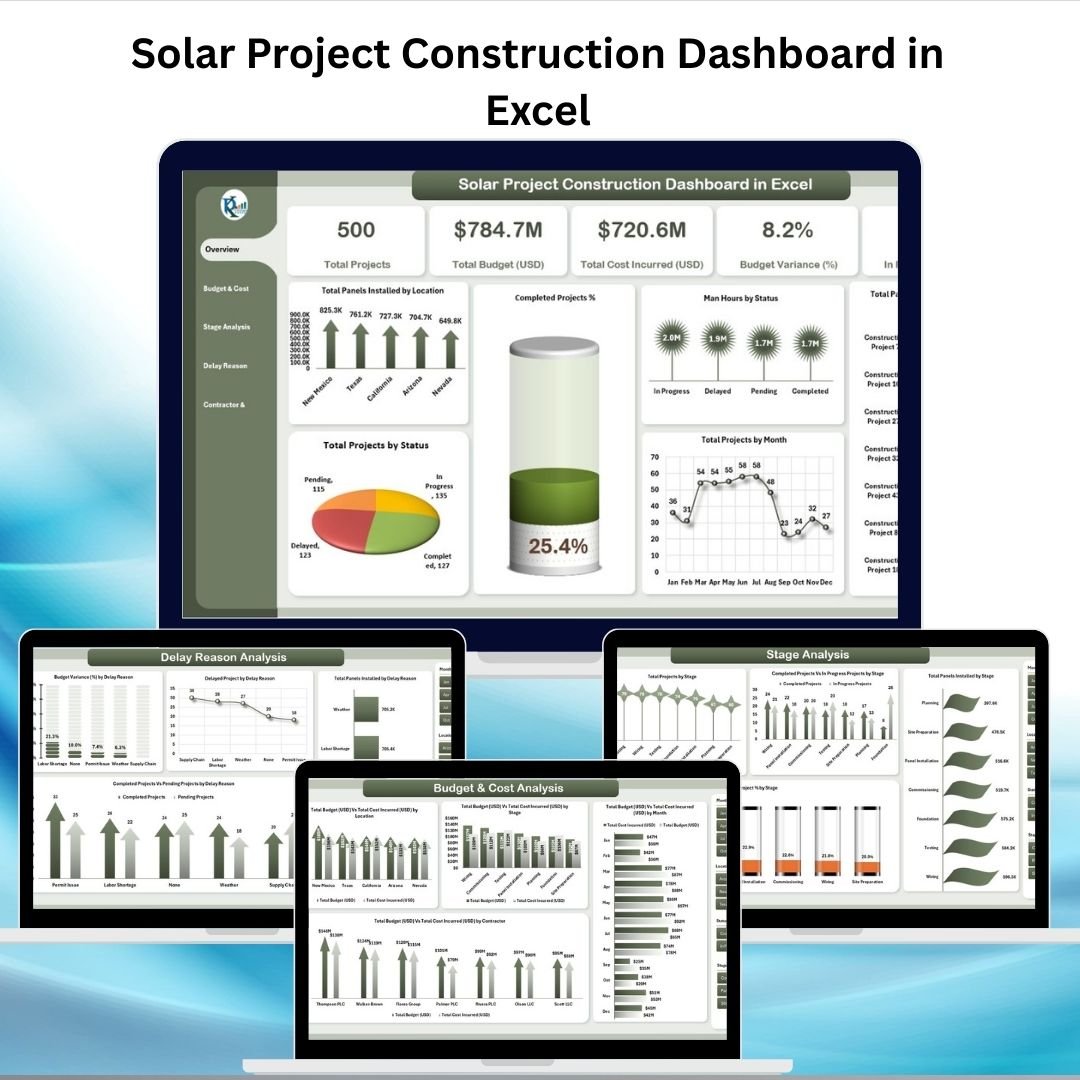
Managing solar projects effectively requires real-time visibility into project status, costs, and contractor performance. Without proper tracking, budgets may overrun, delays increase, and resource allocation becomes inefficient. Our Solar Project Construction Dashboard in Excel is a ready-to-use, interactive tool designed to help project managers, contractors, and stakeholders streamline solar construction projects from start to finish.
This dashboard transforms raw project data into clear, actionable insights with interactive cards, charts, and analysis tabs—ensuring you stay on top of budgets, timelines, and installations.
⭐ Key Features of the Solar Project Construction Dashboard
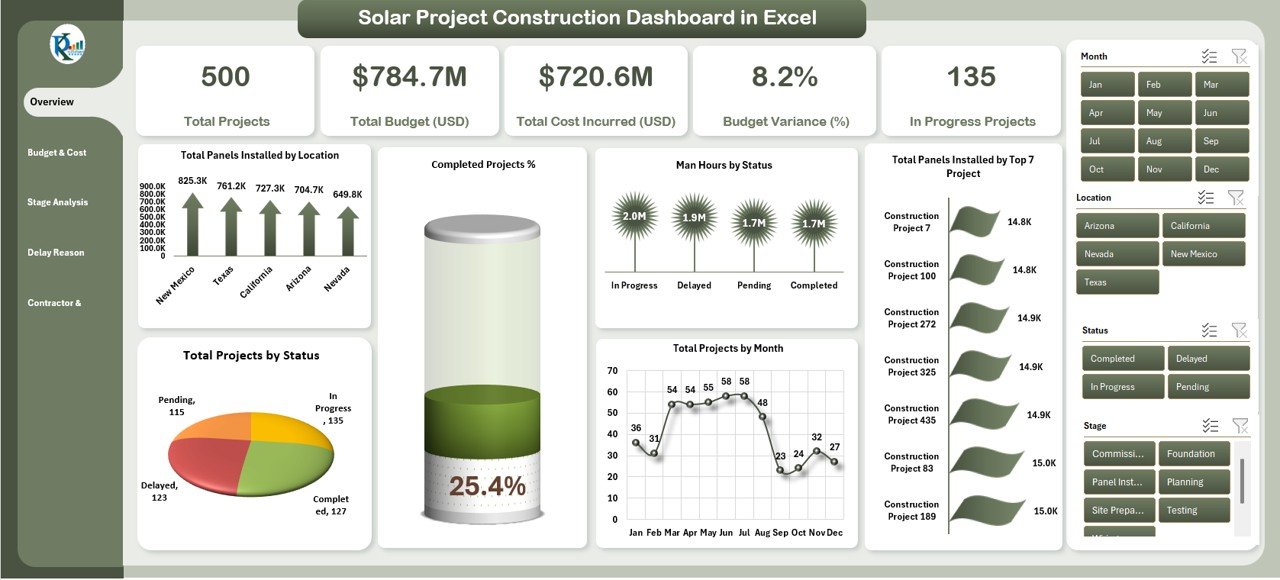
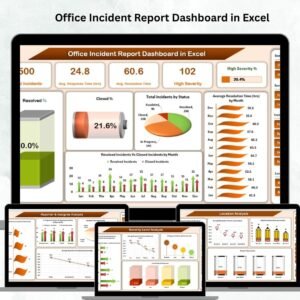
1. Overview Sheet Tab 🏗️
A high-level snapshot of all solar projects with critical KPIs.
Cards Include:
-
🌍 Total Projects – Overall project count.
-
💰 Total Budget (USD) – Budget allocated across all projects.
-
📉 Total Cost Incurred (USD) – Actual cost spent to date.
-
📊 Budget Variance (%) – Variance between planned & actual spending.
-
⚡ In Progress Projects – Projects currently underway.
Charts Include:
-
Panels Installed by Location
-
Completed Projects %
-
Man Hours by Status
-
Panels Installed by Top 7 Projects
-
Projects by Month
-
Projects by Status (In Progress, Completed, Delayed)
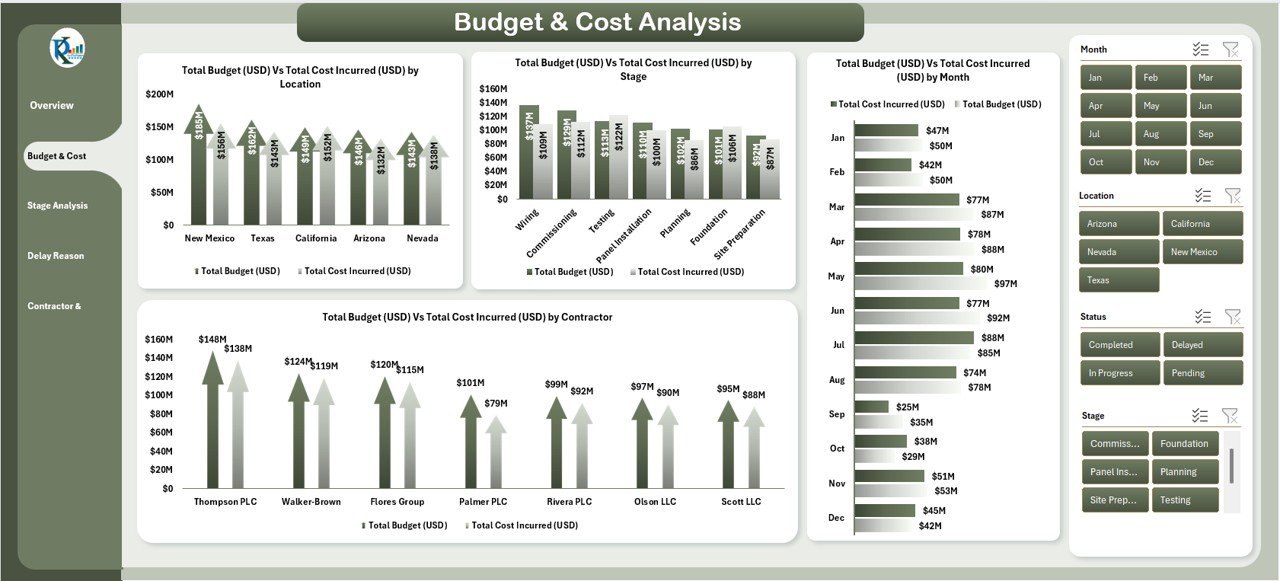
2. Budget & Cost Analysis 💵
Track financial performance across stages, contractors, and locations.
Charts Include:
-
Budget vs Cost by Location
-
Budget vs Cost by Stage
-
Budget vs Cost by Month
-
Budget vs Cost by Contractor
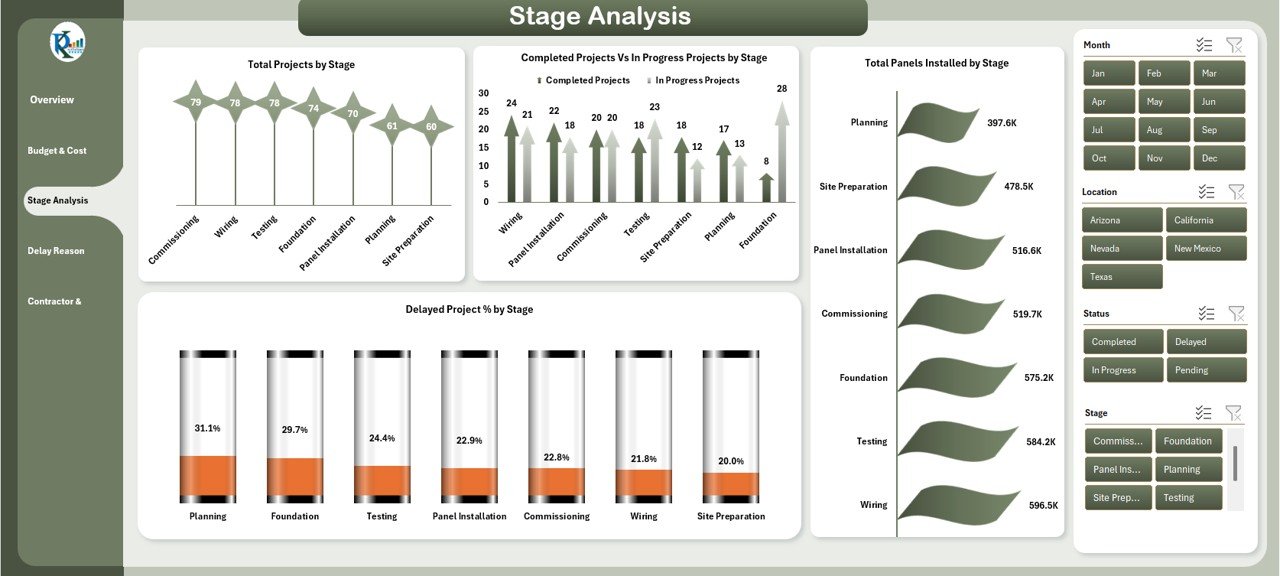
3. Stage Analysis 🔄
Pinpoint progress and bottlenecks at each stage.
Charts Include:
-
Projects by Stage (Planning, Execution, Completion)
-
Completed vs In Progress Projects by Stage
-
Delayed Project % by Stage
-
Panels Installed by Stage
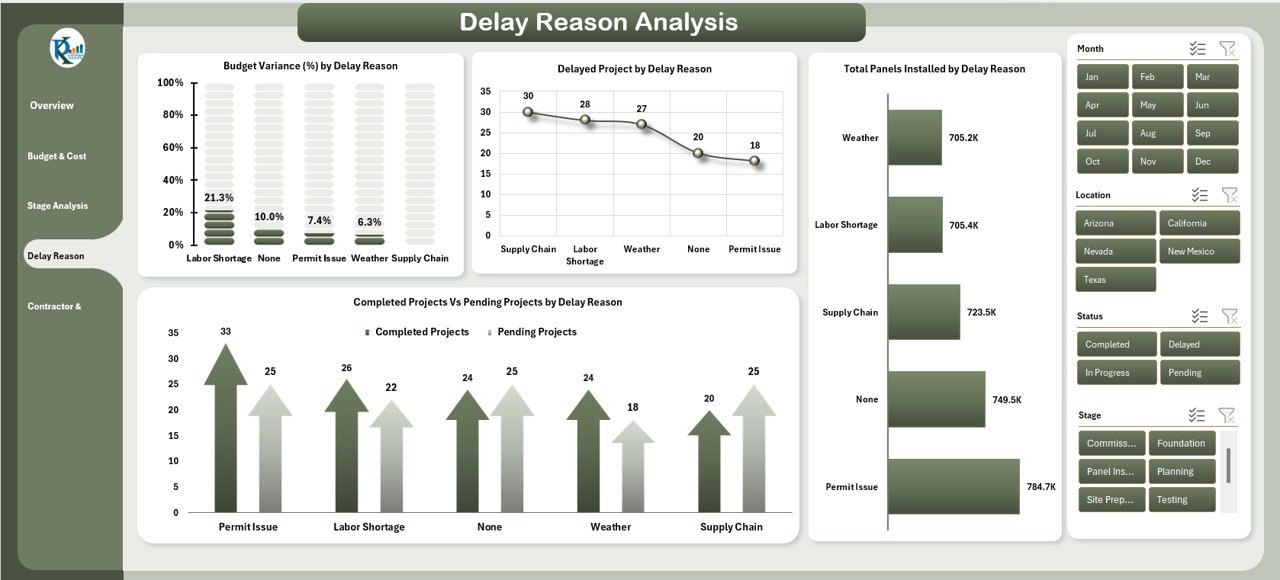
4. Delay Reason Analysis ⏳
Understand the causes of delays to improve future planning.
Charts Include:
-
Budget Variance (%) by Delay Reason
-
Delayed Projects by Cause
-
Completed vs Pending Projects by Delay Reason
-
Panels Installed by Delay Reason
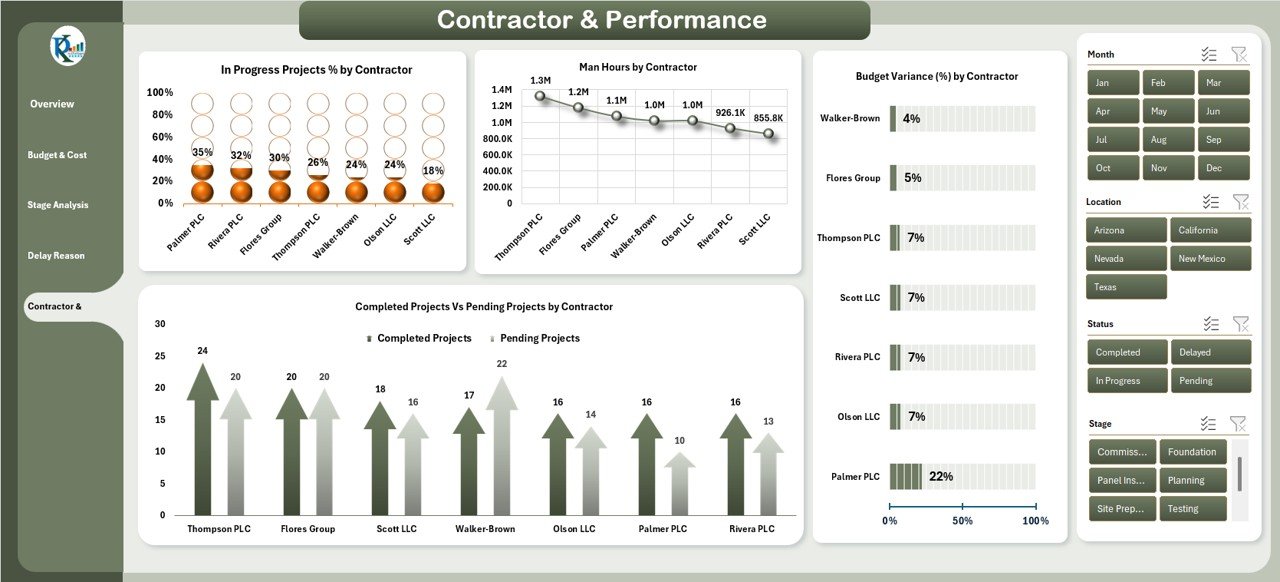
5. Contractor & Performance 👷♂️
Evaluate contractor efficiency and performance.
Charts Include:
-
In Progress Projects % by Contractor
-
Man Hours by Contractor
-
Budget Variance (%) by Contractor
-
Completed vs Pending Projects by Contractor
6. Data Sheet Tab 📑
The backbone of the dashboard where all data is logged.
Captured Information:
-
Project ID & Name
-
Location
-
Contractor
-
Budget (USD) & Cost Incurred (USD)
-
Stage & Status
-
Panels Installed
-
Delay Reason
-
Man Hours
-
Start & End Date
All visuals and calculations update automatically, providing real-time reporting.
💡 Advantages of Using the Solar Project Construction Dashboard
-
📈 Real-Time Tracking – Monitor status, costs, and completion.
-
💰 Budget Control – Compare budget vs actual spending.
-
👷 Contractor Performance – Evaluate efficiency and reliability.
-
⏱️ Delay Analysis – Identify recurring bottlenecks.
-
🌍 Customizable Views – Drill down by location, stage, or contractor.
🚀 Opportunities for Improvement
-
🔗 Integrate with ERP systems for auto-updates.
-
📅 Add Gantt charts for timeline visualization.
-
👥 Include resource allocation metrics for manpower planning.
-
⚡ Add solar output tracking for energy performance.
-
⏰ Automated alerts for overdue or over-budget projects.
📝 Best Practices
-
Update the Data Sheet regularly for accuracy.
-
Review budget variance charts weekly.
-
Monitor contractor KPIs to optimize team performance.
-
Focus on high-impact projects with most panels installed.
-
Use filters/slicers for location or stage-specific insights.
✅ Conclusion
The Solar Project Construction Dashboard in Excel is an all-in-one solution for managing solar construction projects. With its interactive visuals and structured reporting, project managers can control costs, evaluate contractors, analyze delays, and ensure timely project delivery.
Click here to read the Detailed Blog Post
Watch the step-by-step video Demo:


Reviews
There are no reviews yet.