
Want to boost engagement, optimize your content strategy, and make smarter marketing moves? 🚀
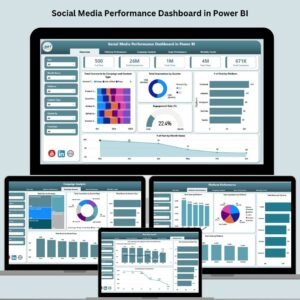
Introducing the Social Media Performance Dashboard in Power BI — your all-in-one solution for tracking, analyzing, and optimizing your brand’s social media performance.
This ready-to-use dashboard turns raw data into dynamic visuals across five pages. Built on Power BI, it connects directly to your Excel sheet and helps you monitor every post, platform, and campaign in real time 📈.
✨ Key Features of the Dashboard
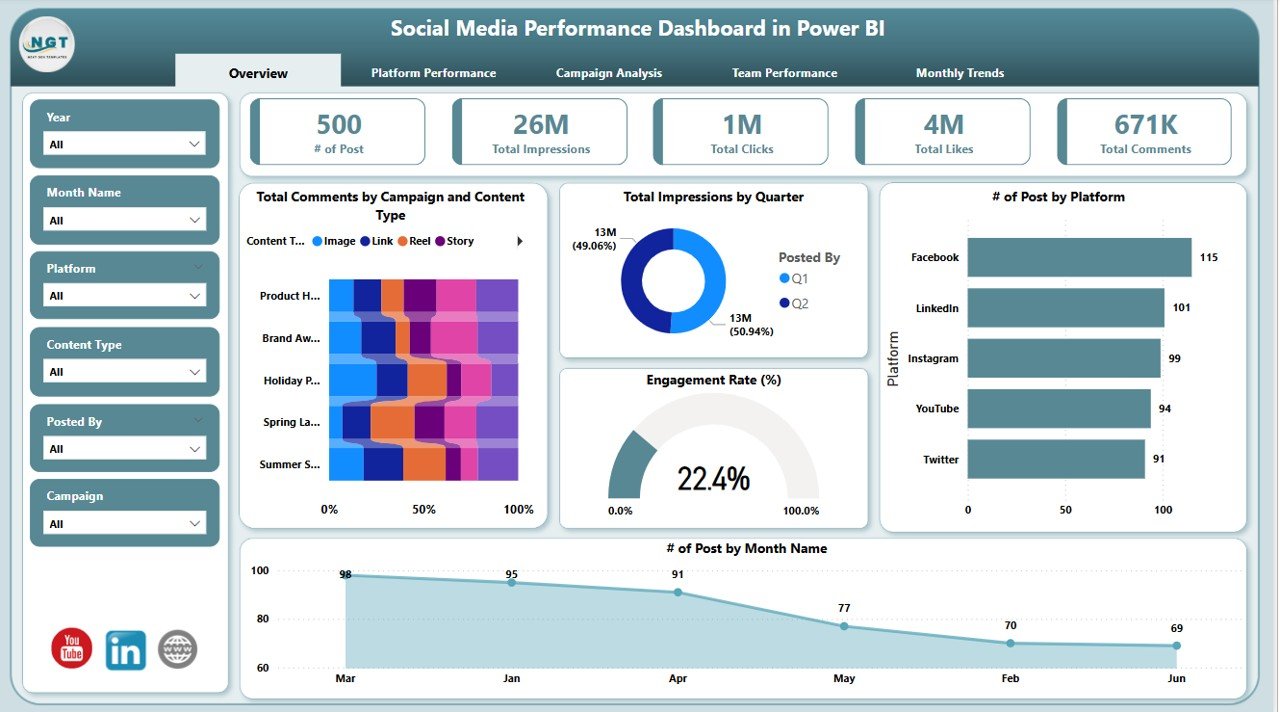
🎯 Overview Page – Your Social Media Snapshot
-
6 Powerful Slicers to filter by platform, campaign, content type & more
-
5 Insight Cards including Engagement Rate %, Total Comments & Impressions
-
5 Visual Charts: stacked, line, area, bar & column – all fully interactive!
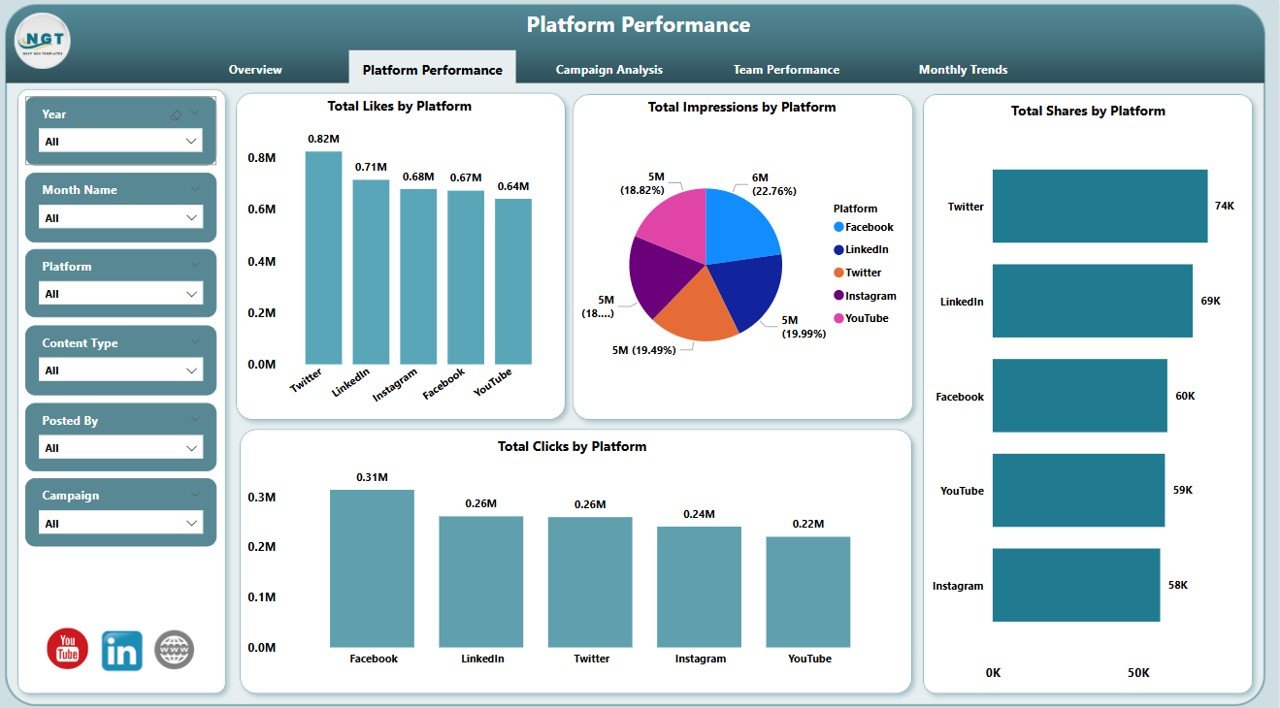
📱 Platform Performance Page – Compare Your Channels
-
Instantly see Likes, Shares, Clicks & Impressions by platform
-
Identify which networks deliver results 📊
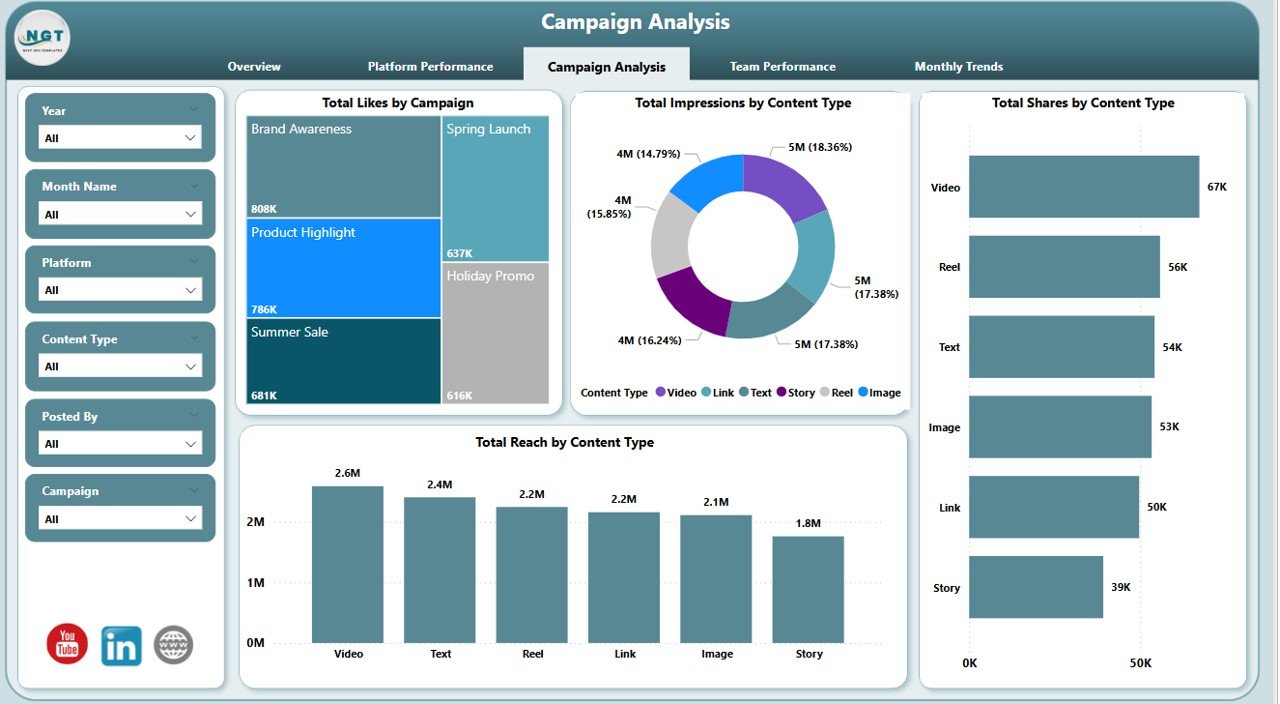
🎥 Campaign Analysis Page – Track What Works
-
Visualize likes, impressions, shares & reach by campaign and content type
-
Uncover which content drives the highest ROI 💰
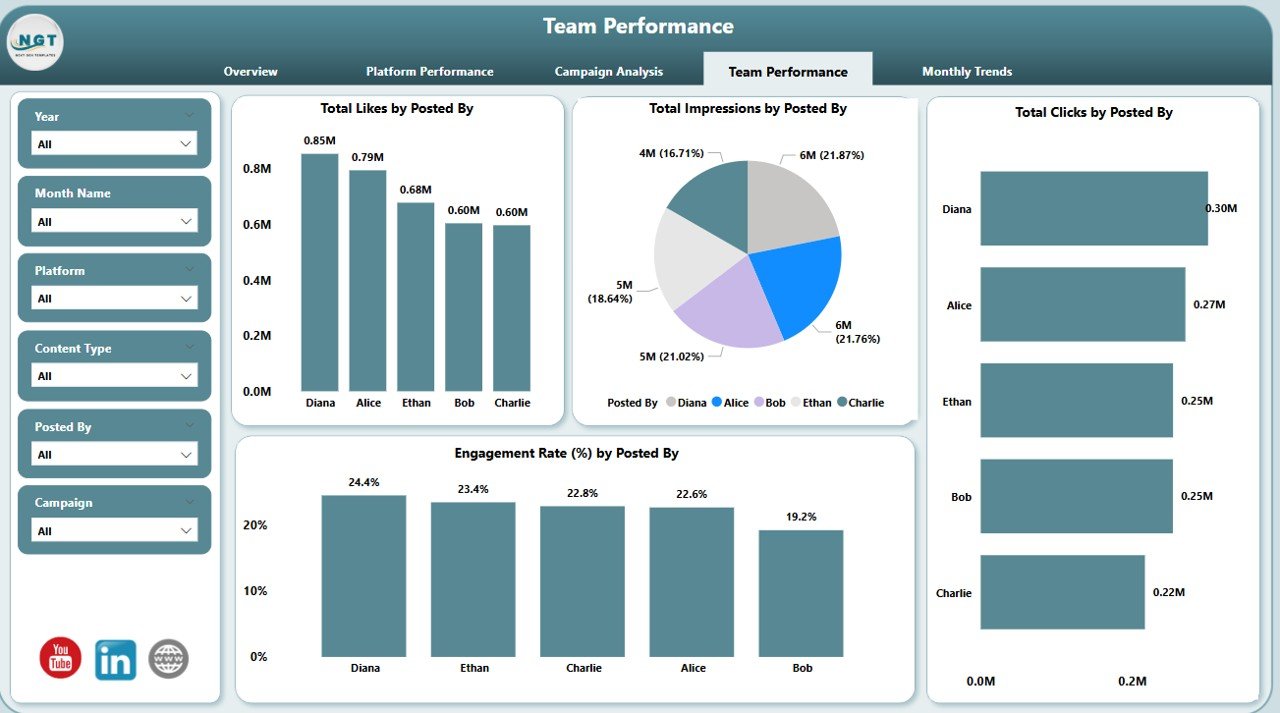
👥 Team Performance Page – Monitor Contributions
-
See who’s delivering results with metrics by “Posted By”
-
Helps identify top performers and improvement areas 🌟
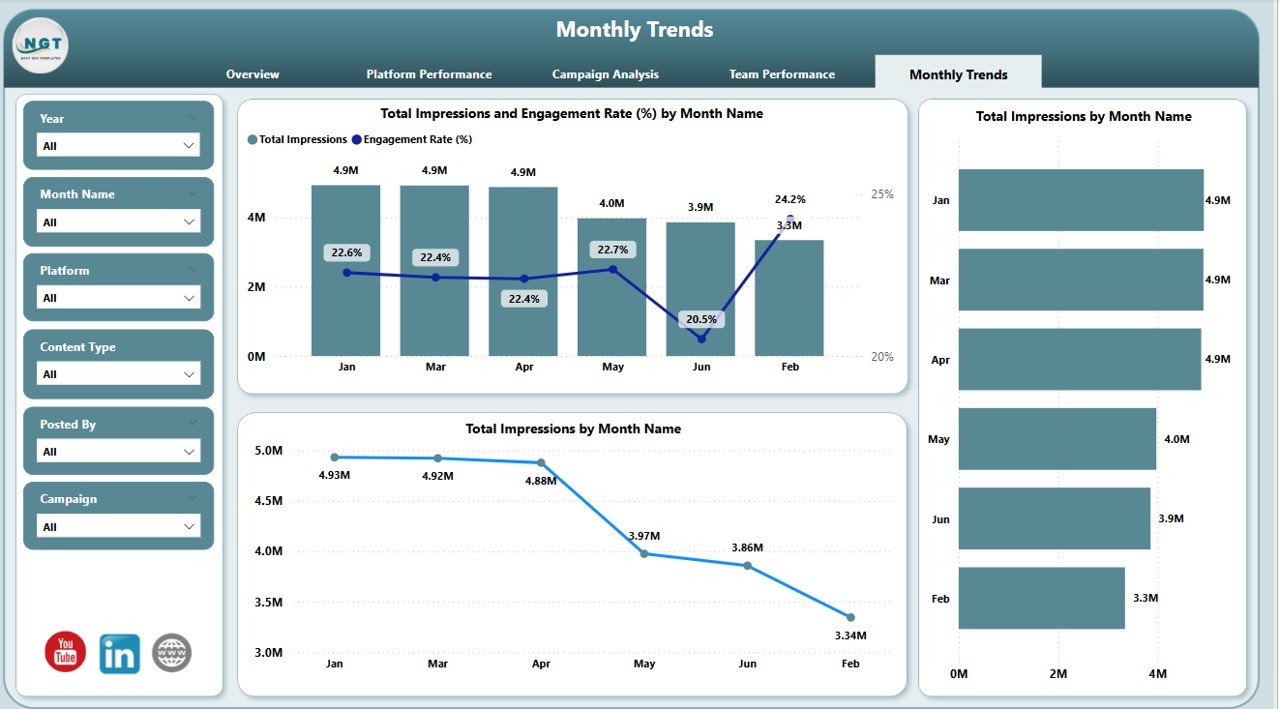
📆 Monthly Trends Page – Spot Seasonality
-
Combo charts and line visuals to track trends by month
-
Pinpoint peak performance periods & adjust your calendar accordingly
📦 What’s Inside the Dashboard?
-
✔️ 5 Pre-Built Pages for comprehensive analysis
-
✔️ Slicers on every page for custom filtering
-
✔️ Dynamic visuals that update with your Excel file
-
✔️ Cards, bar charts, line graphs & combo charts
-
✔️ Built-in DAX logic and formatting for clean reporting
-
✔️ Fully customizable Power BI file
🛠️ How to Use the Dashboard
-
Prepare Your Data
-
Use the provided Excel format (Post Date, Platform, Likes, Comments, Shares, Clicks, Impressions)
-
-
Connect in Power BI
-
Open Power BI Desktop → Get Data → Excel → Load your file
-
-
Customize Filters & Metrics
-
Adjust platform or campaign names as needed
-
-
Explore 5 Powerful Pages
-
Use slicers to view campaign-specific or time-based performance
-
-
Refresh Regularly
-
Hit “Refresh” or schedule auto-refreshes in Power BI Service for live tracking
-
👨💼 Who Can Benefit from This Dashboard?
-
💼 Digital Marketing Managers tracking multi-platform campaigns
-
📲 Social Media Analysts optimizing post performance
-
🧑💻 Content Creators wanting audience insights
-
🏢 Marketing Agencies managing client portfolios
-
📈 Startups & SMBs seeking real-time performance metrics
-
🎯 Enterprise Teams needing scalable, cross-platform reporting
💡 Why You’ll Love This Power BI Dashboard
-
🚀 Instant Insights: All key metrics in one place
-
🎨 Interactive Visuals: Charts that tell a story
-
🧠 Smarter Strategy: Know what’s working & double down
-
💼 Team Accountability: Track who’s posting & performing
-
📅 Seasonal Planning: Adjust budgets & posts by trends
-
⚙️ No More Manual Reports: Auto-updating Excel link
-
🔍 Customizable & Scalable: Add new KPIs or visuals anytime
-
💰 One-Time Purchase: No ongoing fees, full lifetime access
📎 Click here to read the Detailed Blog Post
🎥 Visit our YouTube channel to learn step-by-step video tutorials
👉 Youtube.com/@PKAnExcelExpert


Reviews
There are no reviews yet.