In today’s hyper-connected digital era, social media has become the heartbeat of customer opinions and brand perception. People share their thoughts, reviews, and experiences about brands across platforms like Twitter, LinkedIn, Facebook, Instagram, and countless online forums. Ignoring this constant stream of conversations can mean lost opportunities, reputational damage, and declining customer trust.
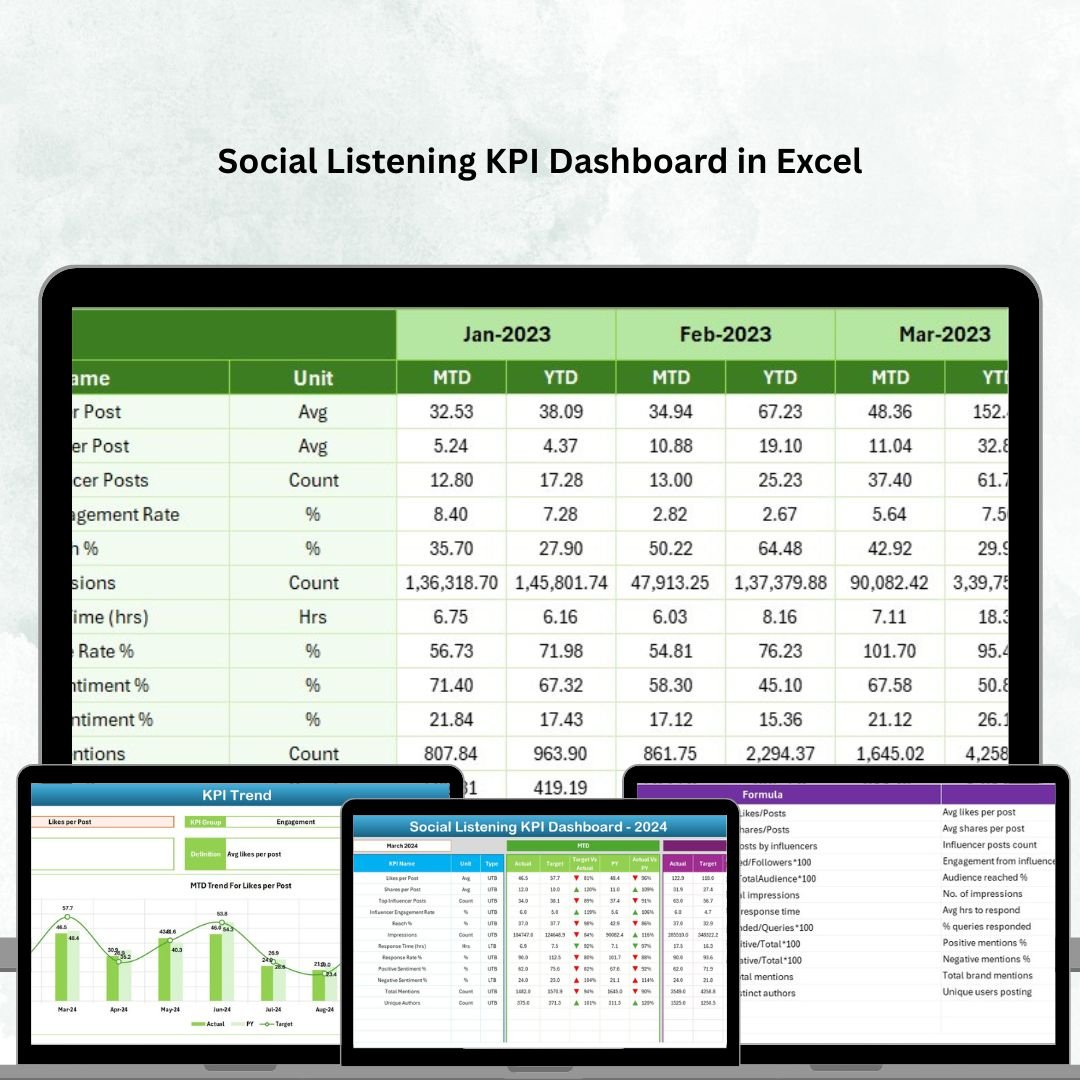
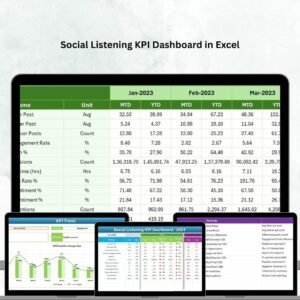
That’s why we created the Social Listening KPI Dashboard in Excel — a ready-to-use, cost-effective, and powerful tool that transforms overwhelming social chatter into actionable insights. Whether you’re a marketing manager, customer service lead, or business owner, this dashboard helps you measure engagement, monitor brand sentiment, and take proactive steps in real-time. Social Listening KPI Dashboard in Excel
✨ Key Features of the Social Listening KPI Dashboard in Excel
-
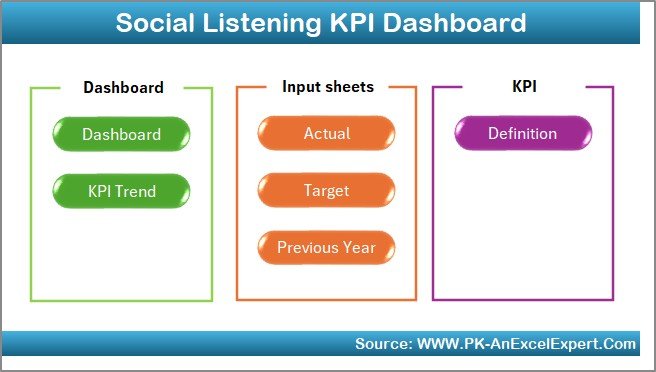
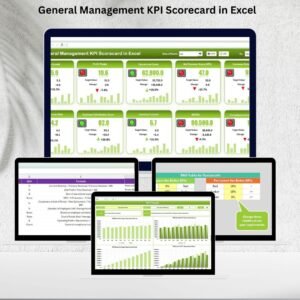
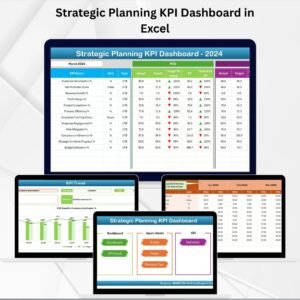
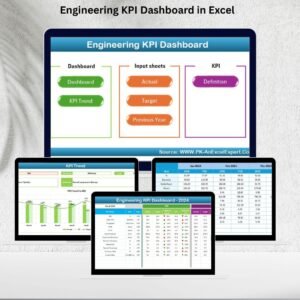
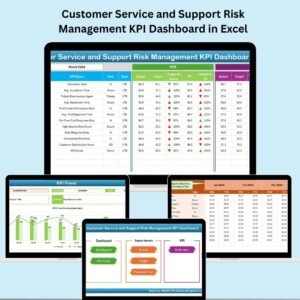
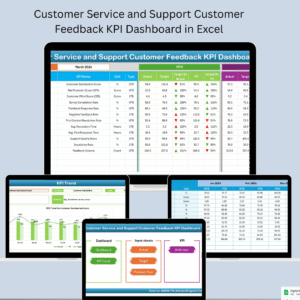
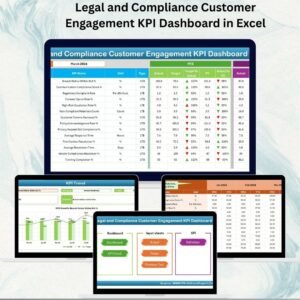
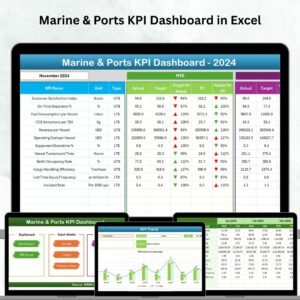
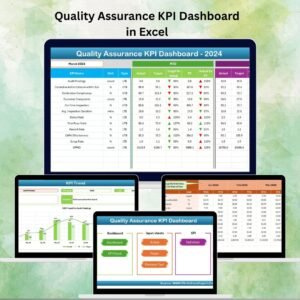
📊 7 Structured Worksheets – Organized tabs for Home, Dashboard, KPI Trend, Actual Numbers, Targets, Previous Year, and KPI Definition.
-
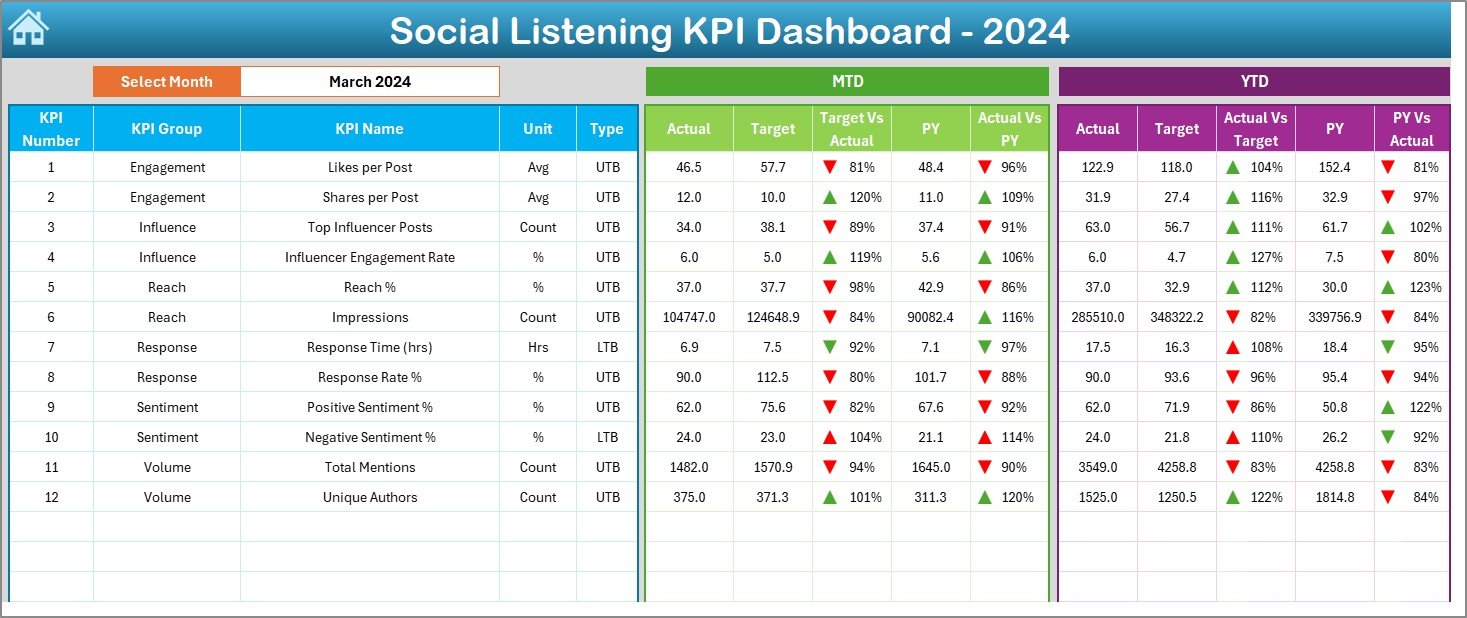
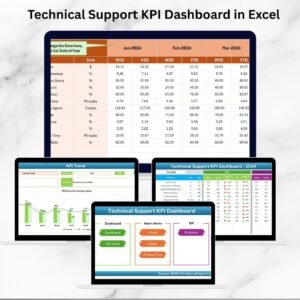
🎯 Instant Monthly & Yearly Analysis – Compare MTD (Month-to-Date) and YTD (Year-to-Date) values with targets and past performance.
-
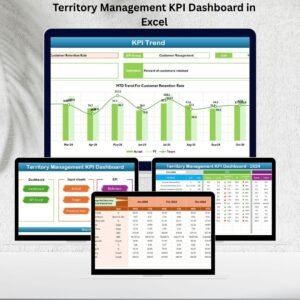
🔄 Interactive Controls – Dropdowns and slicers to select months and KPIs, updating visuals instantly.
-
🟢🔴 Conditional Formatting – Quick visual cues with green upward and red downward arrows for performance checks.
-
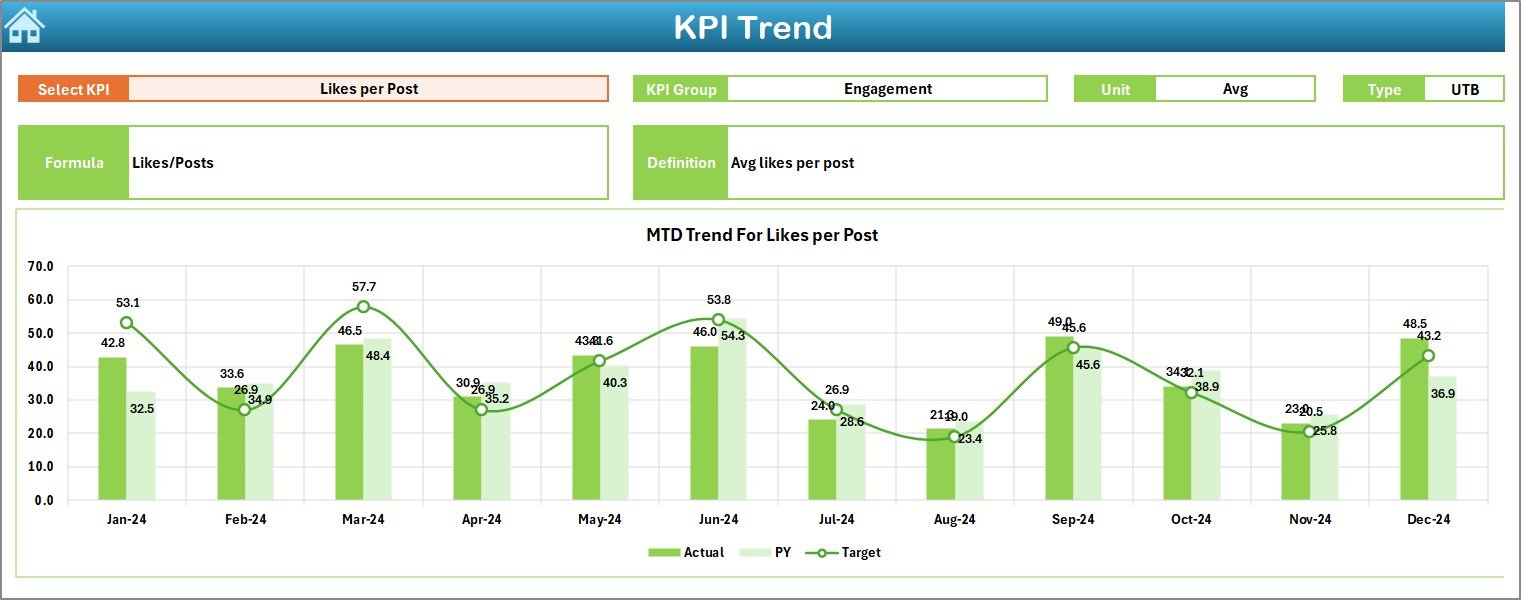
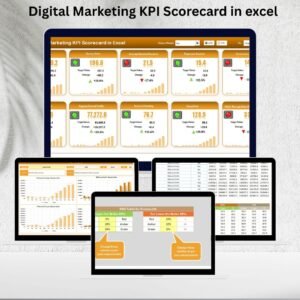
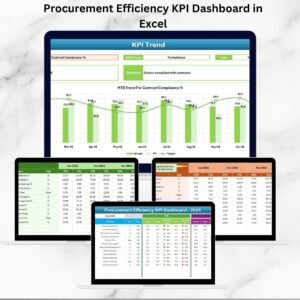
📈 Trend Charts – Analyze patterns, compare targets, and monitor KPIs with dynamic graphs.
-
🛠️ Customizable Setup – Easily add, edit, or modify KPIs to suit your business needs.Social Listening KPI Dashboard in Excel
📂 What’s Inside the Social Listening KPI Dashboard in Excel
This product includes a well-structured Excel file with the following tabs:
-
Home Sheet – An index page with 6 navigation buttons for quick access.
-
Dashboard Sheet – The main analysis hub with actuals vs. targets vs. previous year KPIs.
-
KPI Trend Sheet – Interactive chart-based analysis with dropdown KPI selection.
-
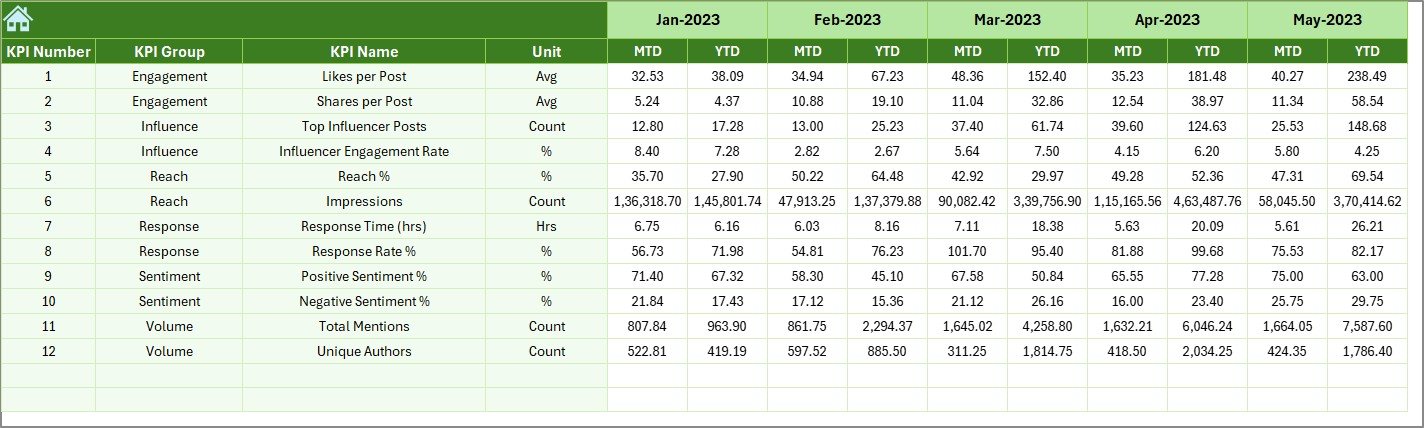
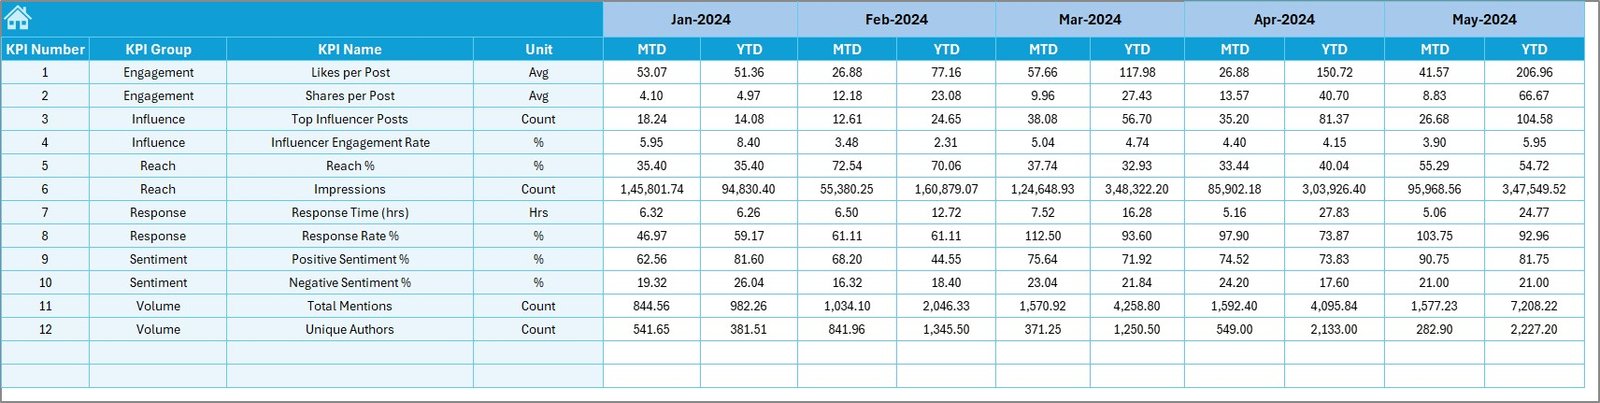
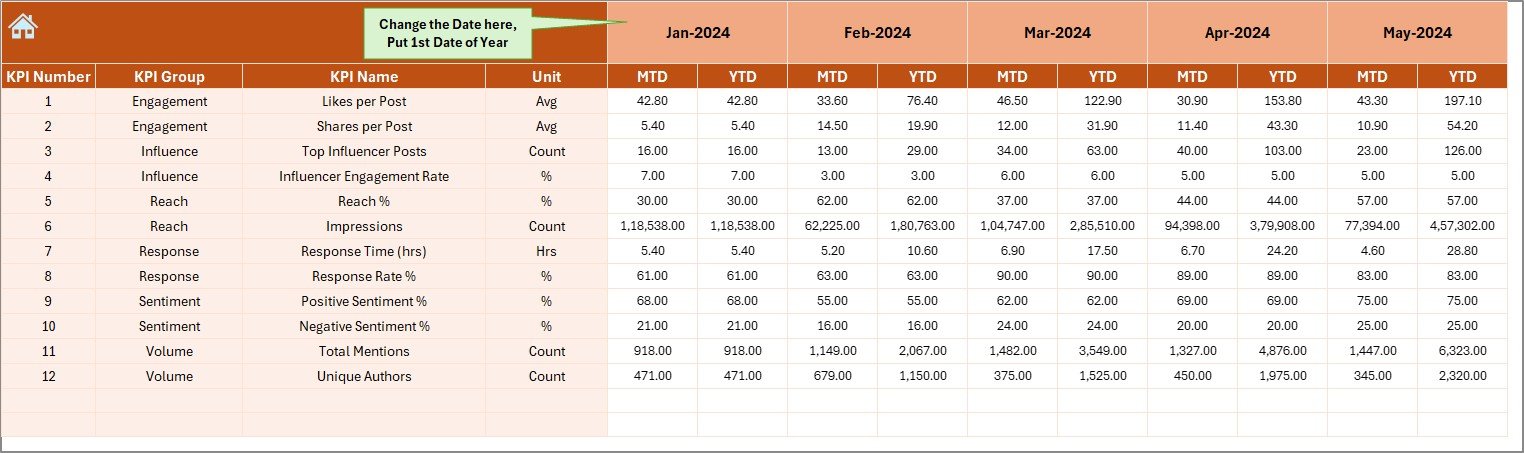
Actual Numbers Input Sheet – Update actual data monthly for instant calculations.
-
Target Sheet – Enter your MTD and YTD targets for each KPI.
-
Previous Year Numbers Sheet – Store historical KPI data for comparison.
-
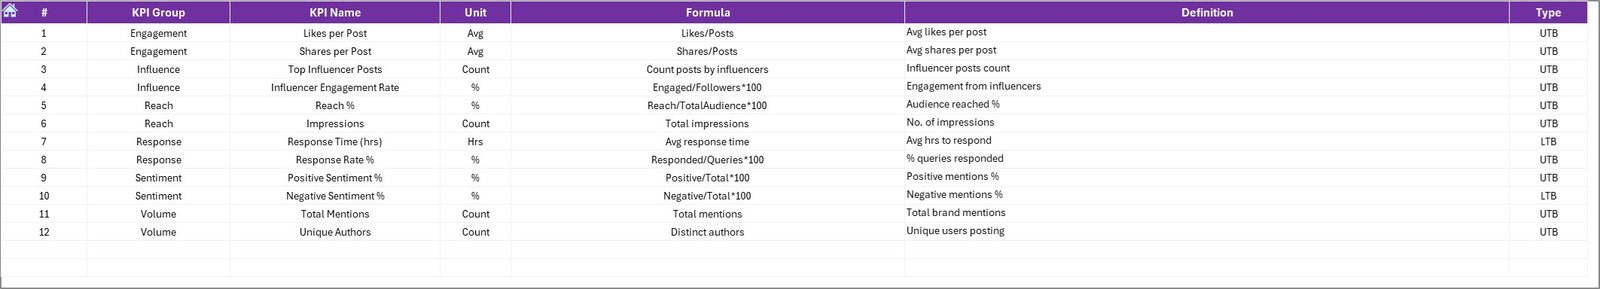
KPI Definition Sheet – A glossary of KPI details (name, group, unit, formula, and definition).
Everything is built in Excel with formulas, charts, and formatting that are both beginner-friendly and professional-grade.
📝 How to Use the Social Listening KPI Dashboard in Excel
Using this dashboard is super simple, even if you’re not an Excel expert:
-
Input Actual Data → Fill in your monthly figures in the Actual Numbers Input Sheet.
-
Set Targets → Add your performance goals in the Target Sheet.
-
Add Previous Year Data → Enter last year’s numbers for comparison.
-
Navigate Easily → Use the Home Sheet buttons to jump between sections.
-
Review Dashboard → Select the desired month in the Dashboard tab and check KPIs.
-
Analyze Trends → Dive deeper with KPI Trend charts.
-
Clarify KPIs → Use the Definition Sheet to understand KPI formulas and meaning.
In just a few clicks, you’ll turn raw social media data into business intelligence. 💡
👥 Who Can Benefit from This Dashboard?
The Social Listening KPI Dashboard in Excel is perfect for:
-
📢 Marketing Teams – Track campaign impact, monitor brand mentions, and identify trends.
-
🤝 Customer Support Managers – Measure response time and sentiment to improve service.
-
📰 PR Professionals – Spot risks early and safeguard brand reputation.
-
📊 Business Leaders & Executives – Gain a big-picture view of brand performance and decision-making insights.
-
🏢 Startups & Enterprises – Scalable solution for companies of all sizes.
This dashboard is your secret weapon to stay ahead in the competitive digital landscape.


Reviews
There are no reviews yet.