Smart grids are the backbone of modern power systems—but KPI reporting in many utilities is still messy. If your team is juggling scattered Excel files, email updates, and “different versions of the truth,” you’re not tracking performance… you’re chasing it.
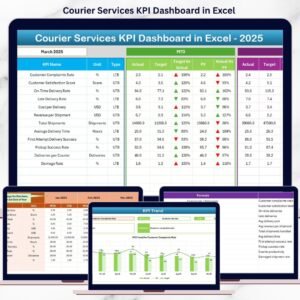
That’s exactly why we built the Smart Grid Services KPI Dashboard in Excel ✅
It’s a ready-to-use, management-friendly template that instantly shows MTD & YTD performance, with clear comparisons for Actual vs Target and Actual vs Previous Year (PY)—plus eye-catching arrows that make problem KPIs impossible to ignore.
Whether you manage metering, outage response, grid automation, customer service, or compliance, this dashboard helps you spot trends faster, report smarter, and act earlier.
Key Feature of Smart Grid Services KPI Dashboard in Excel
🚀 Ready-to-use Excel dashboard for utility & smart grid service reporting
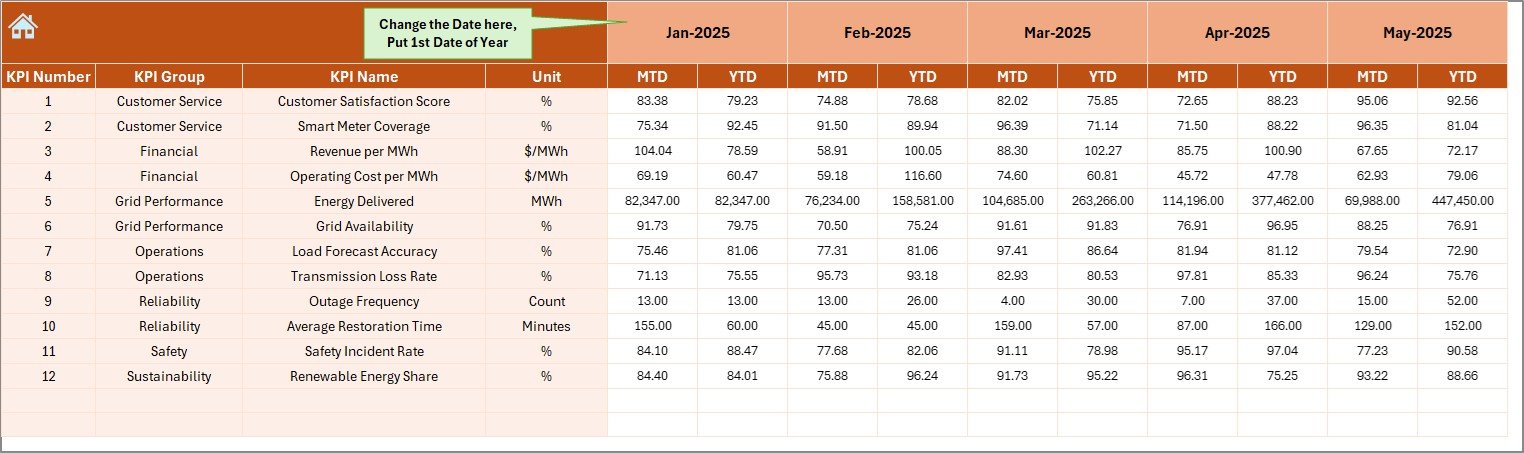
📅 Month selector (Dashboard cell D3) updates the full dashboard view
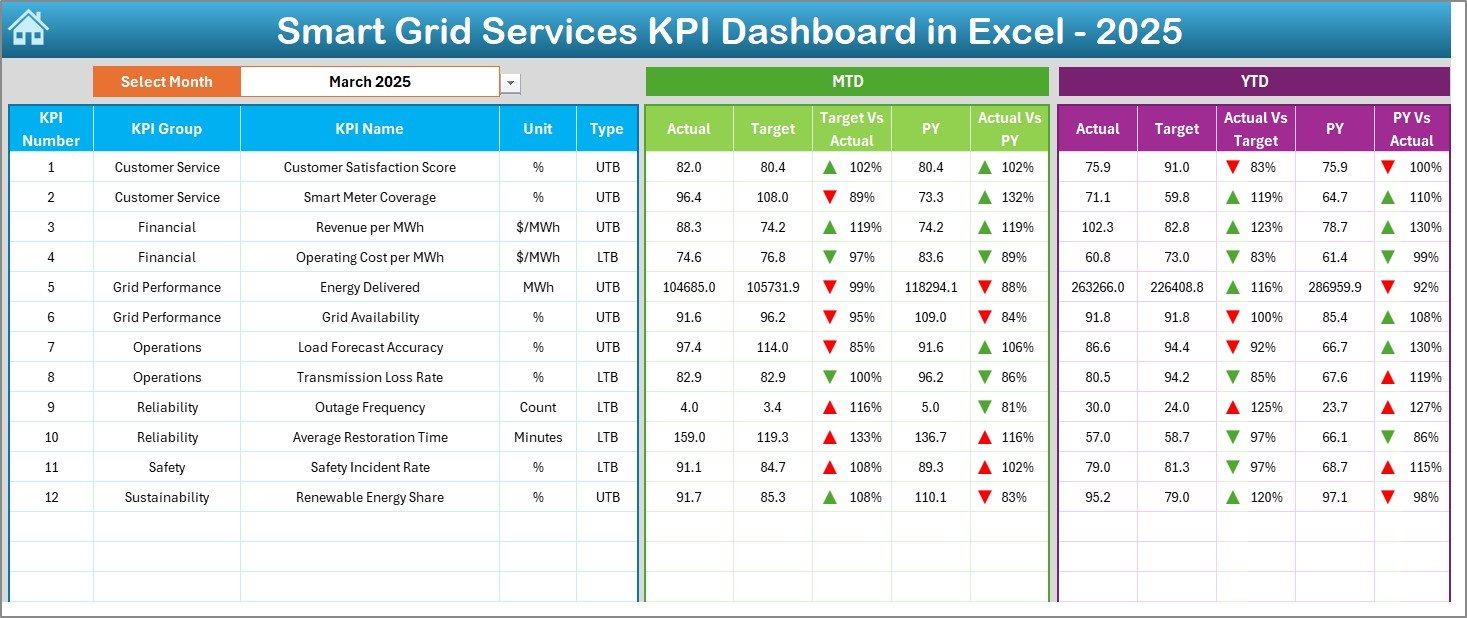
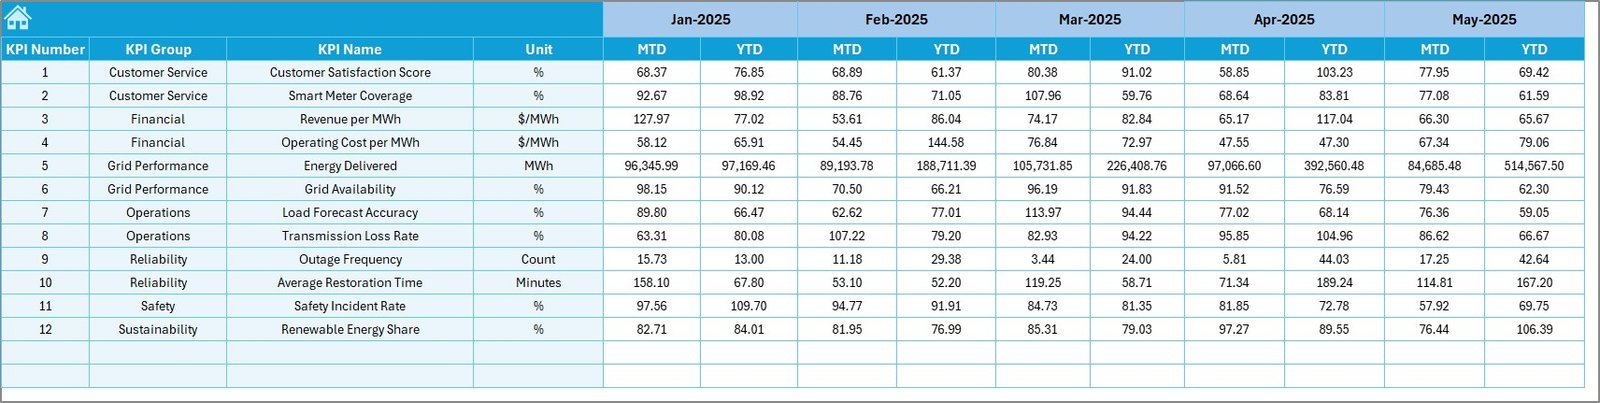
📊 MTD and YTD tracking side-by-side for every KPI
🎯 Actual vs Target comparison with up/down indicators
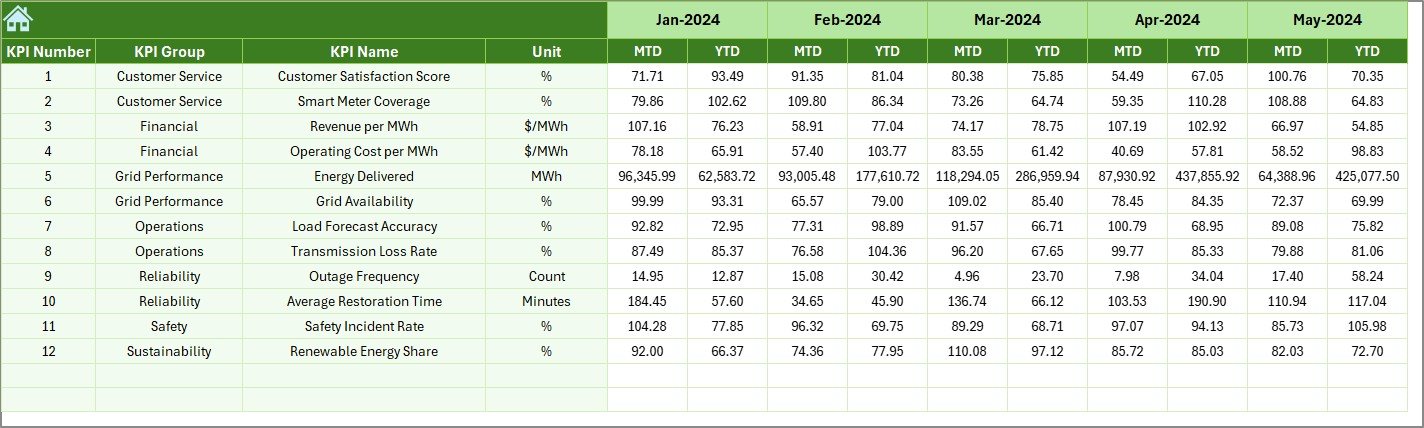
📈 Actual vs Previous Year (PY) comparison for YoY benchmarking
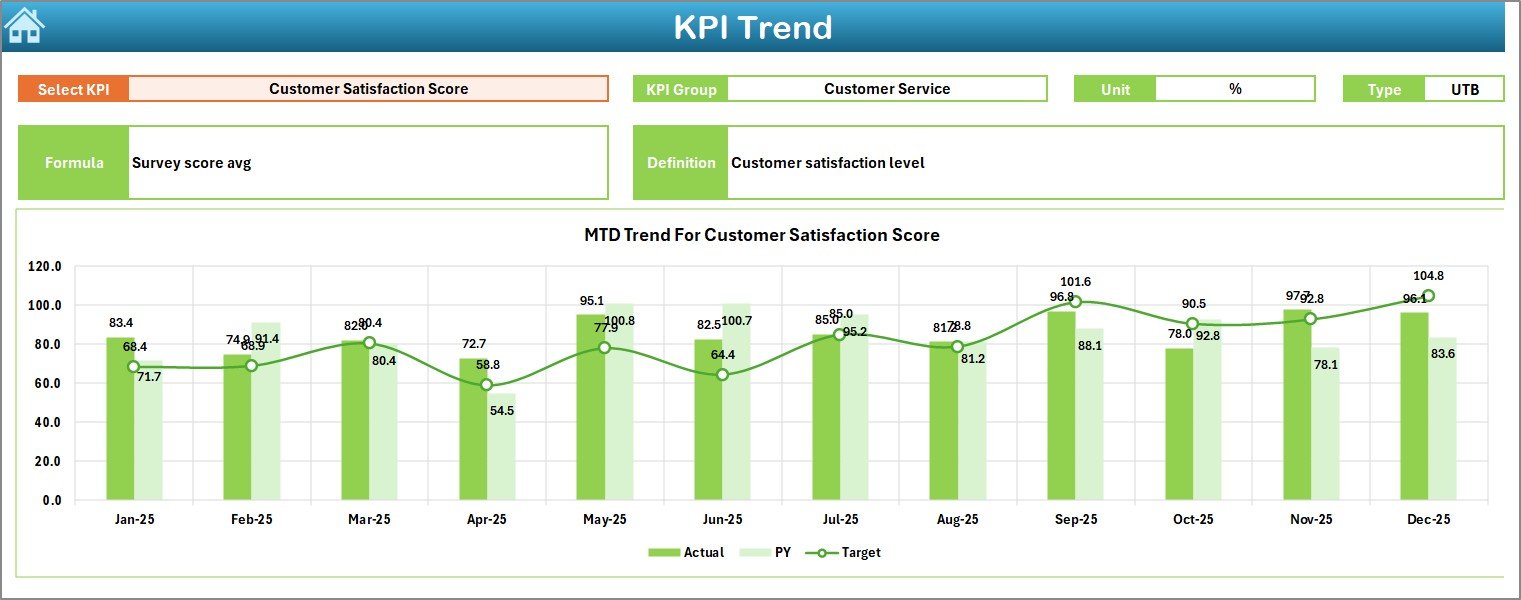
🔍 KPI Trend analysis with dropdown KPI selection (Trend sheet cell C3)
🧾 Clean input structure for Actual, Target, and PY (no confusing data mess)
✅ Professional layout + navigation buttons so the workbook feels like a real tool
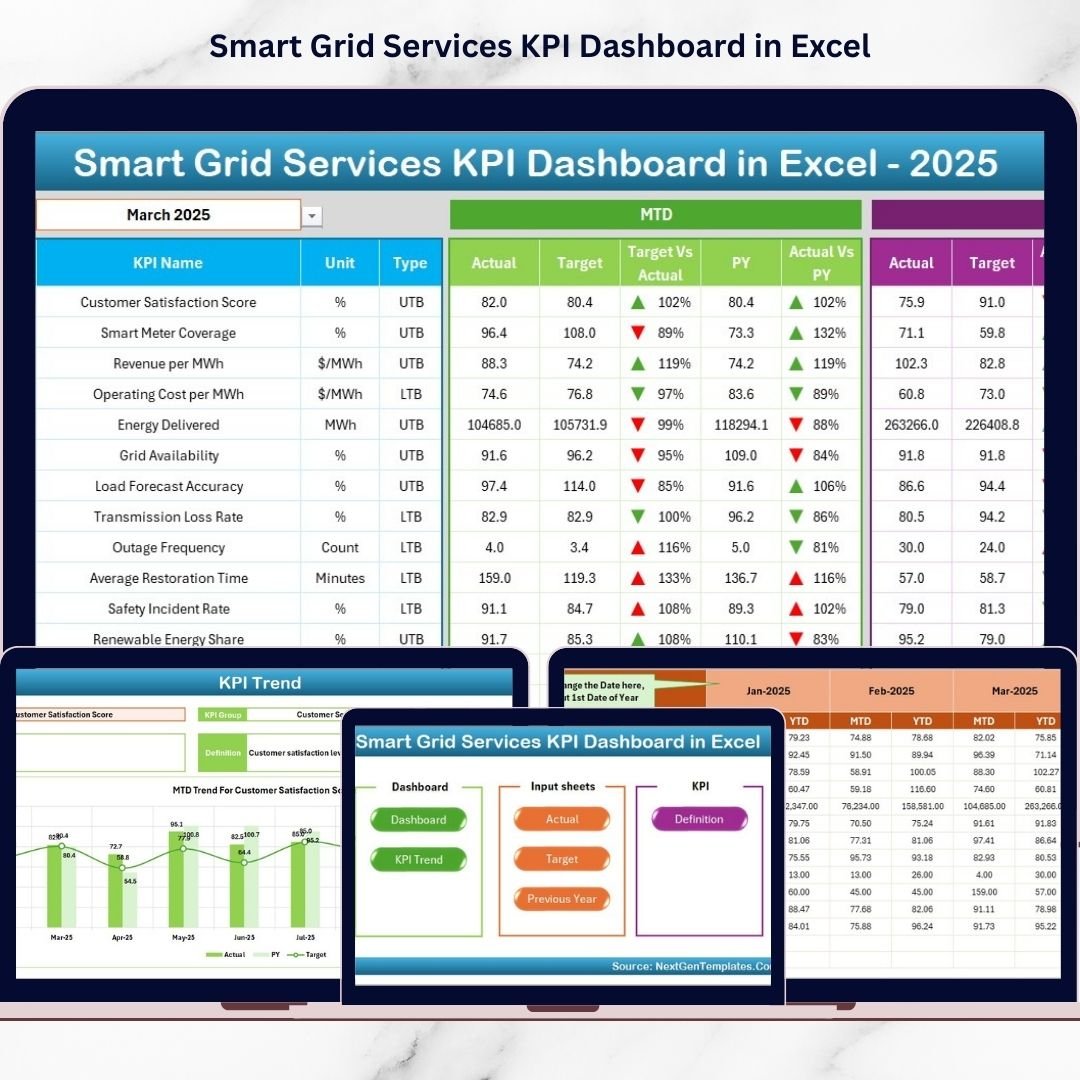
What’s Inside the Smart Grid Services KPI Dashboard in Excel
This template includes 7 worksheets designed for real-world monthly reporting:
🏠 Home Sheet – one-click navigation buttons to jump to Dashboard, Trend, and input sheets
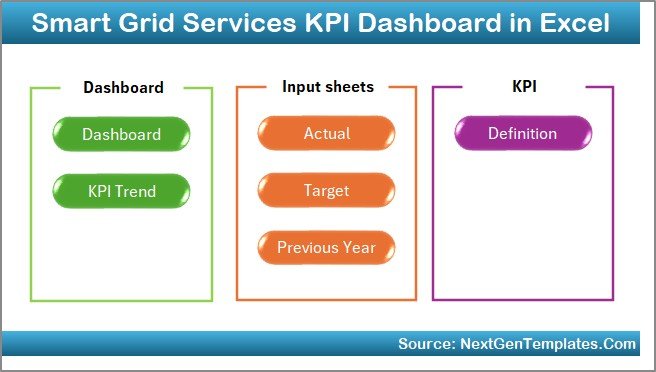
📌 Dashboard Sheet – your KPI command center showing:
-
MTD Actual, Target, PY
-
YTD Actual, Target, PY
-
Target vs Actual arrows
-
PY vs Actual arrows
📉 KPI Trend Sheet – deep-dive into a single KPI with:
-
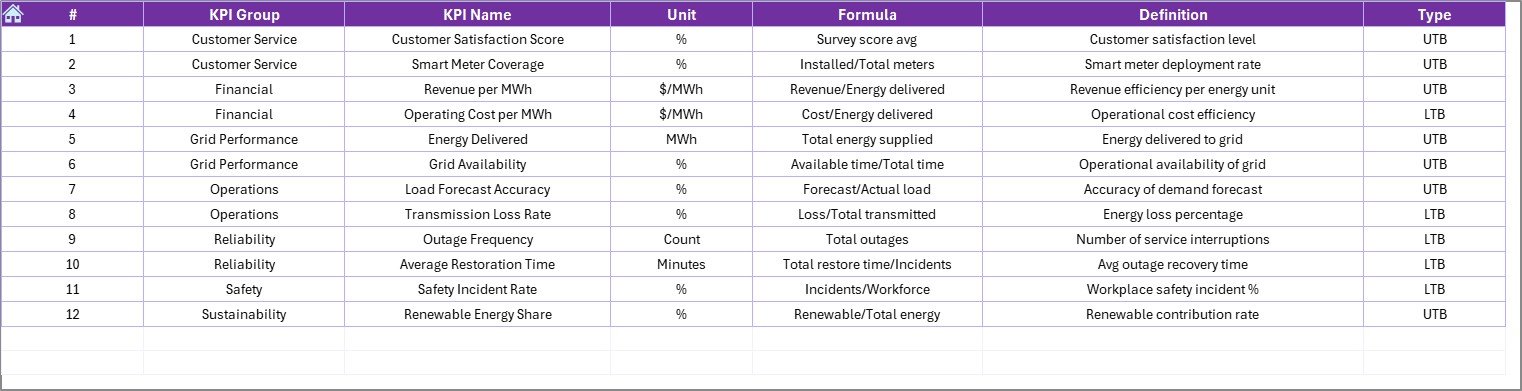
KPI Group, Unit, Type (UTB/LTB), Formula, Definition
-
MTD Trend chart (Actual/Target/PY)
-
YTD Trend chart (Actual/Target/PY)
🧮 Actual Numbers Input Sheet – enter current year MTD/YTD actual values (fast + consistent)
🎯 Target Sheet – enter MTD/YTD targets for each KPI (perfect for monthly review decks)
🕒 Previous Year Numbers Sheet – enter last year values to unlock YoY comparison
📚 KPI Definition Sheet – the backbone for KPI names, groups, units, formulas, and definitions
How to Use the Smart Grid Services KPI Dashboard in Excel
Follow this monthly workflow (simple and repeatable):
1️⃣ Set/Update KPI Definitions (only when needed)
Add/edit KPI name, unit, formula, and definition so everyone uses the same KPI meaning.
2️⃣ Enter Actual Numbers
Go to Actual Numbers Input and fill MTD & YTD values for the month.
3️⃣ Enter Targets
Go to Target Sheet and update the MTD & YTD targets.
4️⃣ Enter Previous Year Numbers
Go to Previous Year Numbers and input PY values for the same KPIs.
5️⃣ Review the Dashboard
Open Dashboard, select month in D3, and instantly check:
✅ target hits/misses
✅ YoY improvements/declines
✅ KPIs needing urgent action
6️⃣ Analyze Trends
Go to KPI Trend, select KPI in C3, and review MTD/YTD direction month by month.
Who Can Benefit from This Smart Grid Services KPI Dashboard in Excel
This template is ideal for:
⚡ Smart Grid Operations Teams
📡 Meter Data Management (MDM) & Smart Meter Teams
🛠️ Maintenance & Asset Management Teams
🚨 Outage Management & Reliability Teams
📈 Utility Analysts, MIS Teams, and Reporting Owners
📋 Compliance & Audit Support Teams
🧑💼 Utility Managers, Heads of Distribution, and Leadership Review Meetings
🤝 Energy Consultants & Power Sector Project Managers
If your organization wants faster monthly reporting and stronger operational control, this dashboard fits perfectly.
Click hare to read the Detailed blog post
Visit our YouTube channel to learn step-by-step video tutorials
Youtube.com/@PKAnExcelExpert