Smart cities grow rapidly, and with them grow the challenges of tracking budgets, zone-wise development, city performance, high-priority projects, funding sources, and monthly spending patterns. But many teams still rely on scattered spreadsheets and outdated manual reports—making decisions slower, planning unclear, and performance trends hard to understand. That’s why a Smart Cities Development Dashboard in Excel becomes an essential tool for modern city planning, monitoring, and execution.
This dashboard brings together all the major KPIs that matter for smart-city administration—Capex, Opex, funding distribution, project progress, priority levels, zone development, city-wise budgeting, and monthly trends. Designed to work inside Excel, it requires zero technical knowledge and provides instant clarity to every stakeholder—government departments, planners, engineers, consultants, finance teams, and urban-development units. With powerful slicers, KPI cards, automated charts, and structured pages, this dashboard turns complex city data into clean, visual insights that help teams work faster and smarter.
✨ Key Features of the Smart Cities Development Dashboard in Excel
This premium Excel dashboard is built with five analytical pages, a left-side page navigator, smart slicers, automated visuals, and dynamic KPI cards. Every page is crafted to support transparent decision-making and efficient performance tracking.
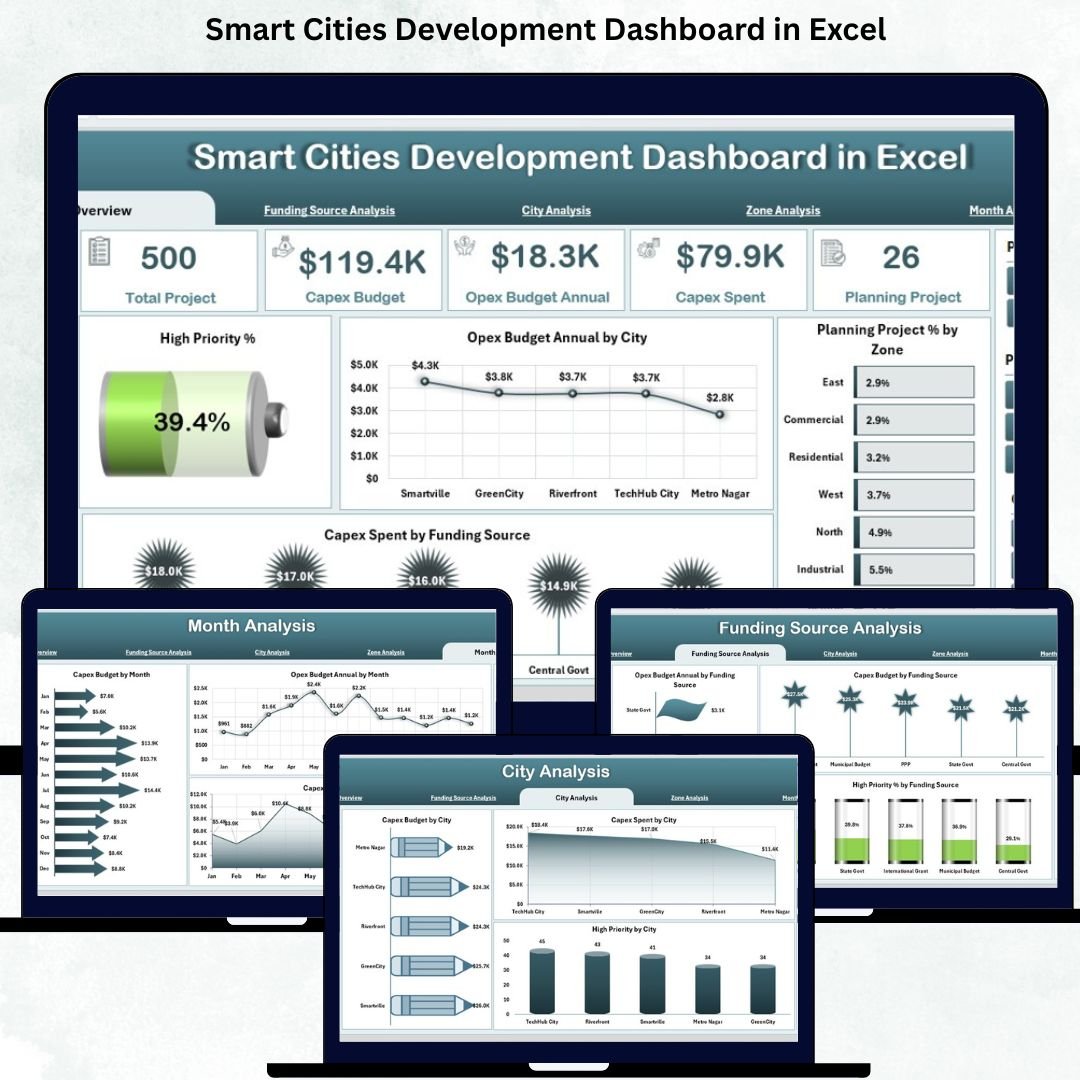
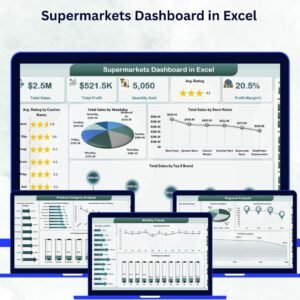
⭐ Overview Page – Your Complete Smart-City Snapshot
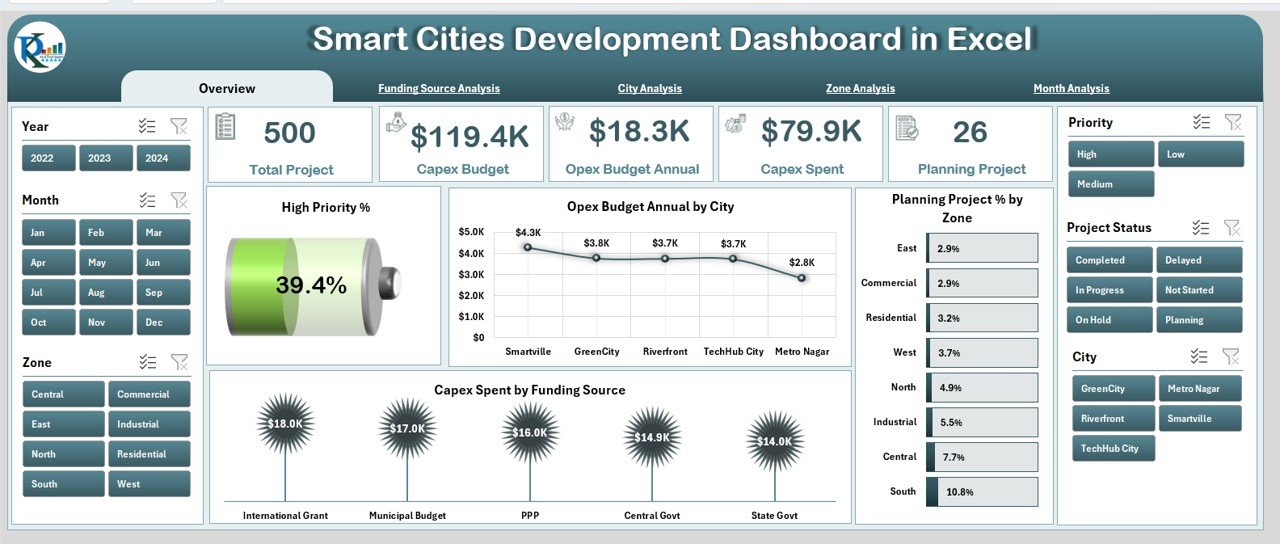
✔ Right-side slicer panel for filtering by city, zone, month, or funding source
✔ 5 smart KPI cards for priority and performance tracking
✔ 4 powerful charts showing:
-
High Priority %
-
Opex Budget Annual by City
-
Planning Project % by Zone
-
Capex Spend by Funding
This page gives leaders an immediate understanding of development progress, spending behavior, and priority distribution—all in one interactive view.
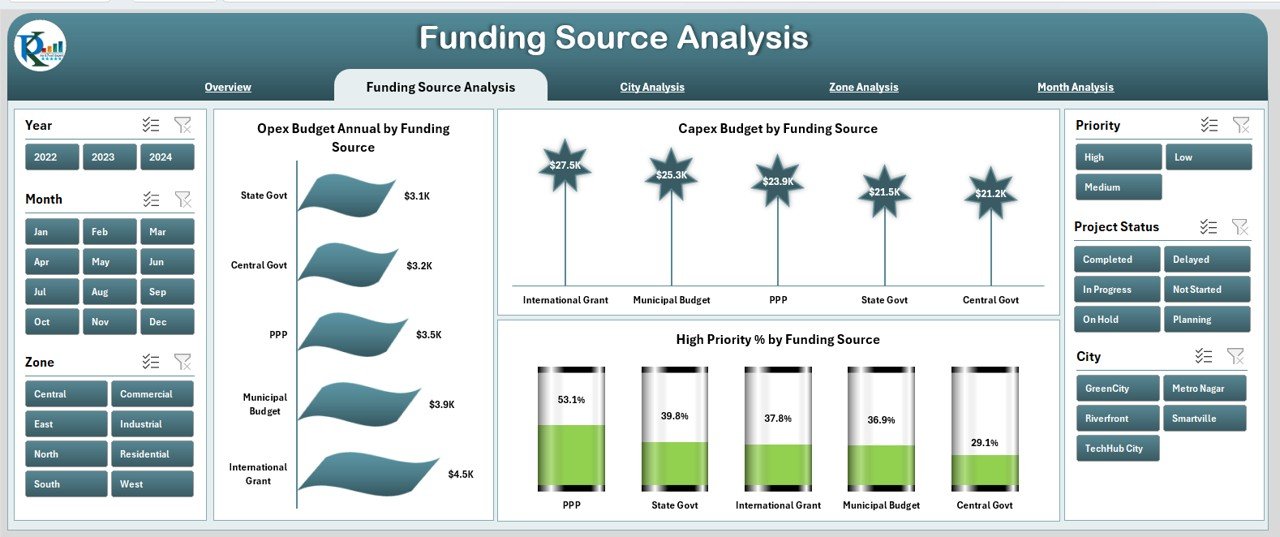
⭐ Funding Source Analysis – Understand Where the Money Comes From
✔ Charts that compare Capex & Opex budgets by funding source
✔ Visuals highlighting High Priority % by Funding Source
✔ Helps budgeting teams identify financial gaps and dependencies
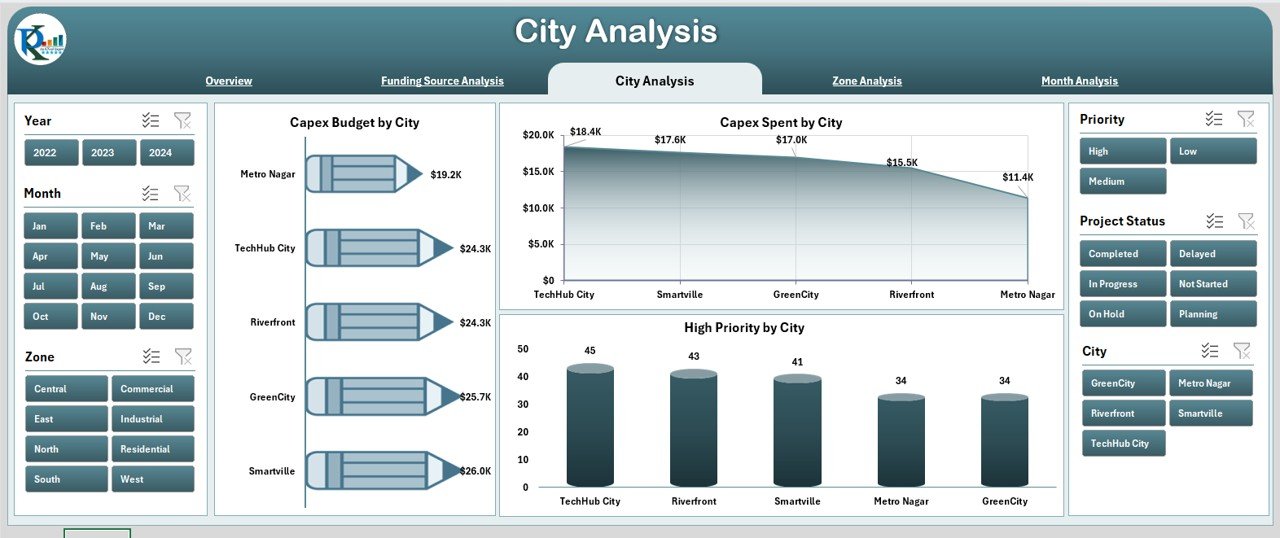
⭐ City Analysis – Compare Performance Across Cities
✔ Capex Budget by City
✔ Capex Spend by City
✔ High Priority % by City
These visuals help leaders track which cities are progressing well, which ones lag behind, and where immediate support is needed.
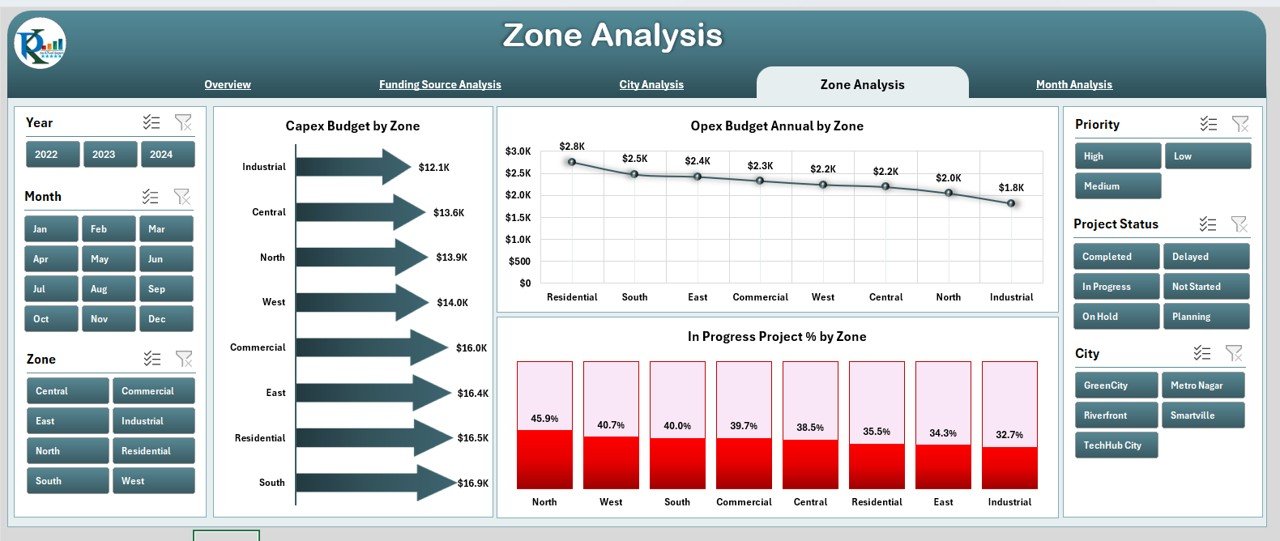
⭐ Zone Analysis – Track Development at a More Detailed Level
✔ Capex Budget by Zone
✔ Opex Budget Annual by Zone
✔ In-Progress Project % by Zone
This page helps teams spot bottlenecks and speed up execution in slow-moving zones.
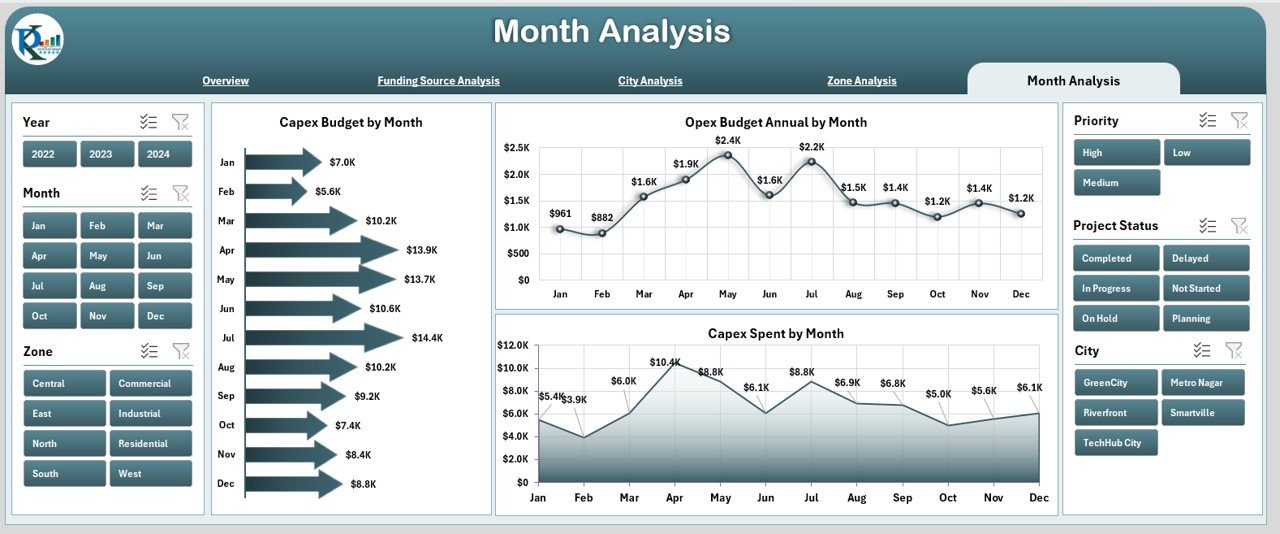
⭐ Month Analysis – Monitor Trends and Plan Resources Accurately
✔ Capex Budget by Month
✔ Opex Budget Annual by Month
✔ Capex Spend by Month
This page reveals seasonality, spending cycles, and month-over-month progress for better forecasting.
📦 What’s Inside the Smart Cities Development Dashboard in Excel
Inside the Excel file, you get:
✨ Professional dashboard layout with navigation panel
✨ Five interactive analytics pages
✨ KPI cards for instant insights
✨ Automated charts linked to your data
✨ Month, city, zone & funding-based slicers
✨ Clean, structured Data Sheet for easy updates
✨ Support sheet for internal calculations
Every component is built to simplify complex city-management workflows.
🛠️ How to Use the Smart Cities Development Dashboard in Excel
1️⃣ Open the file and go to the Data Sheet
2️⃣ Enter or paste zone-wise, city-wise, funding, budget, and project data
3️⃣ Go to any dashboard page
4️⃣ Use the slicers to filter views instantly
5️⃣ Analyze KPI cards & charts
6️⃣ Compare cities, zones, and months to identify performance gaps
7️⃣ Use the insights for planning, budgeting, and review meetings
The entire dashboard refreshes automatically—no formulas, no coding, no manual reporting.
👥 Who Can Benefit from This Smart Cities Development Dashboard in Excel
This dashboard is ideal for:
✔ Urban development teams
✔ Government planning departments
✔ Smart-city consultants
✔ Finance and budget teams
✔ Infrastructure engineers
✔ Monitoring & evaluation units
✔ City administration offices
✔ Multi-city project teams
Anyone who needs clear, visual, and reliable insights will benefit instantly.
### 📘 Click here to read the Detailed blog post
Visit our YouTube channel to learn step-by-step video tutorials
👉 Youtube.com/@PKAnExcelExpert


Reviews
There are no reviews yet.