
Managing security incidents efficiently is no longer optional—it is critical. Cyber threats, compliance risks, system vulnerabilities, and operational disruptions occur daily. However, when security data is scattered across emails, logs, and multiple Excel files, teams lose visibility, response time increases, and risks multiply.
That is exactly where the Security Dashboard in Excel becomes a game-changer.
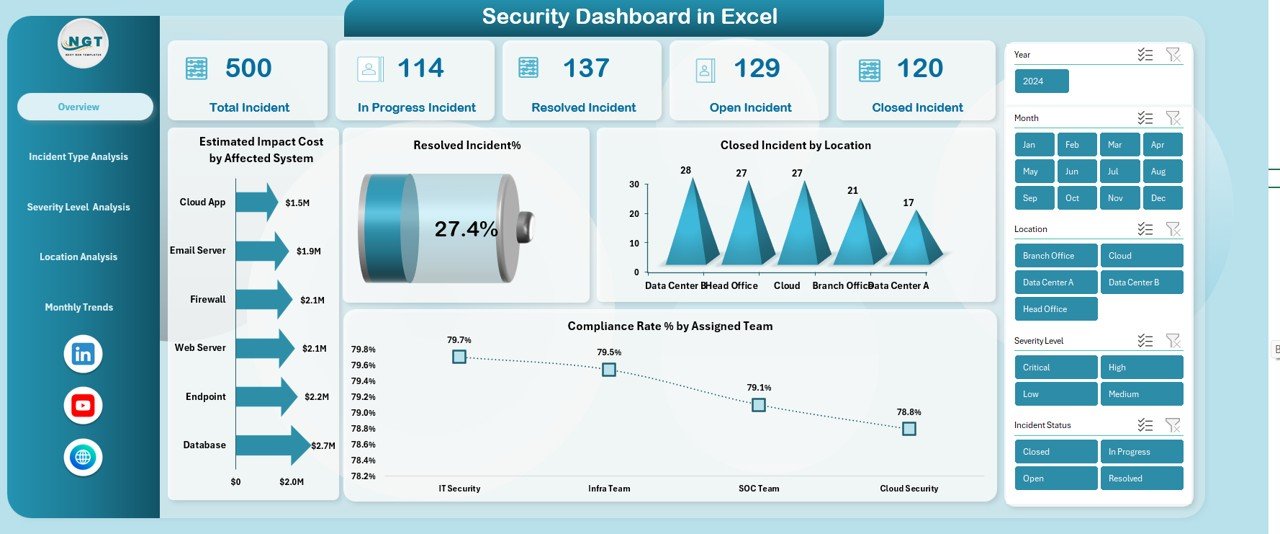
This ready-to-use Security Dashboard in Excel transforms raw security incident data into powerful visuals, KPIs, and trend-based insights. Instead of manually tracking incidents, teams gain one centralized dashboard that instantly shows what is happening, where risks exist, and how well incidents are being resolved. Because it is built entirely in Microsoft Excel, it requires no expensive software, no coding, and no complex setup.
🔑 Key Features of Security Dashboard in Excel
🛡 Centralized Incident Tracking
Monitor all security incidents—open, in progress, resolved, and closed—in one single dashboard.
📊 Executive-Ready KPIs
Track Total Incidents, Resolved Incidents %, Open Incidents, Compliance Rate %, and Estimated Impact Costs at a glance.
📍 Multi-Dimensional Analysis
Analyze incidents by type, severity level, location, assigned team, and month using interactive slicers.
⏱ Resolution Performance Monitoring
Measure average resolution time, resolution efficiency, and backlog trends to improve response speed.
💰 Impact Cost Visibility
Identify which systems, locations, or severity levels create the highest financial risk.
🔄 Fully Customizable in Excel
Modify KPIs, charts, filters, and layouts easily to match your organization’s security framework.
📁 What’s Inside the Security Dashboard in Excel
This professionally designed Excel dashboard includes multiple analytical sheets, each focused on a critical security dimension:
📌 Overview Dashboard
Provides a high-level snapshot of total incidents, in-progress cases, resolved incidents, open incidents, compliance rates, and impact costs.
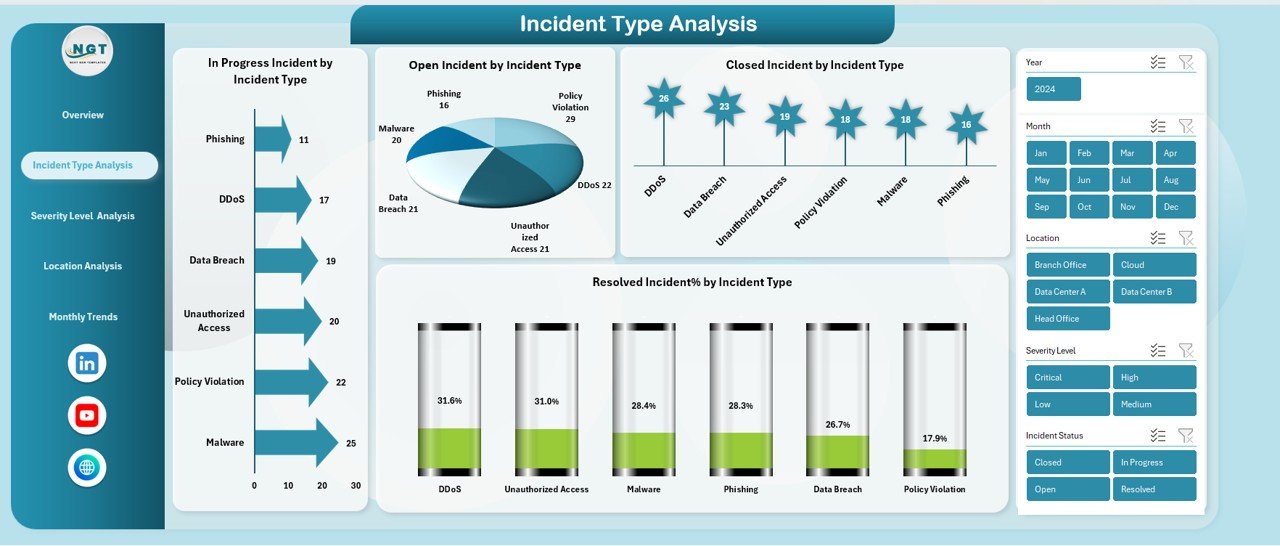
📌 Incident Type Analysis
Analyze in-progress, open, closed incidents and resolution percentage by incident type to identify recurring threats.
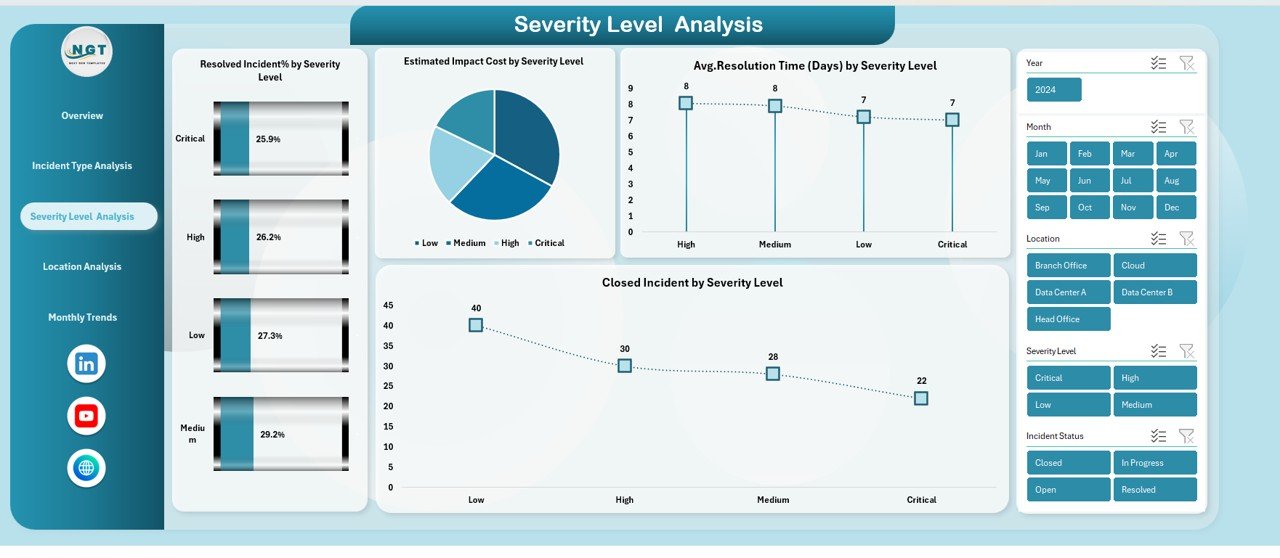
📌 Severity Level Analysis
Track resolved incident %, estimated impact cost, average resolution time (days), and closed incidents by severity level.
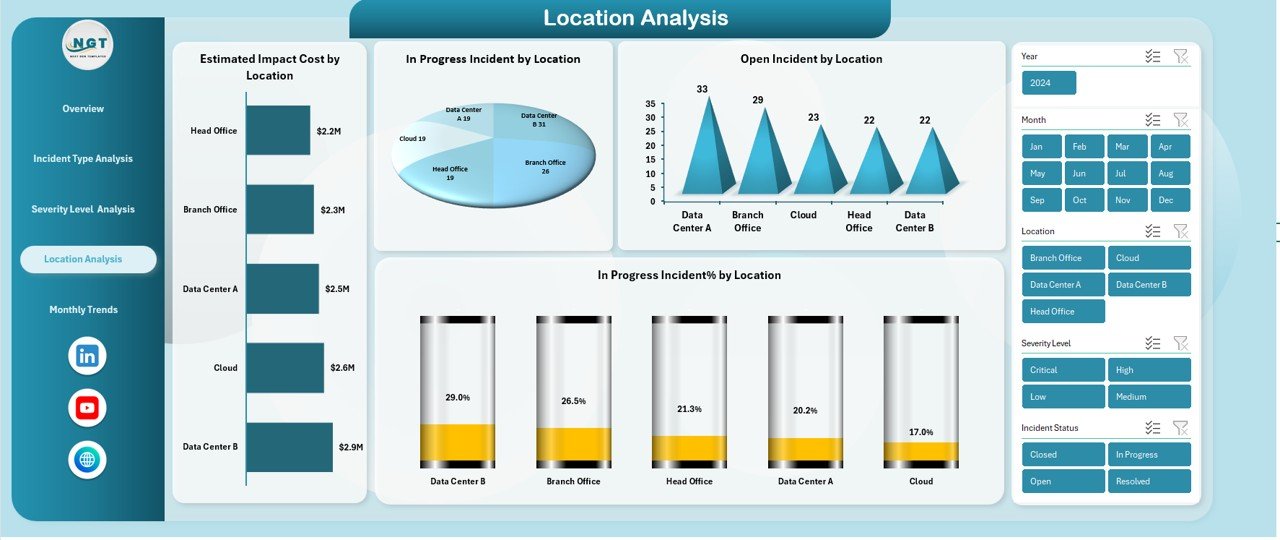
📌 Location Analysis
Understand security exposure by location using impact cost, in-progress incidents, open incidents, and efficiency percentages.
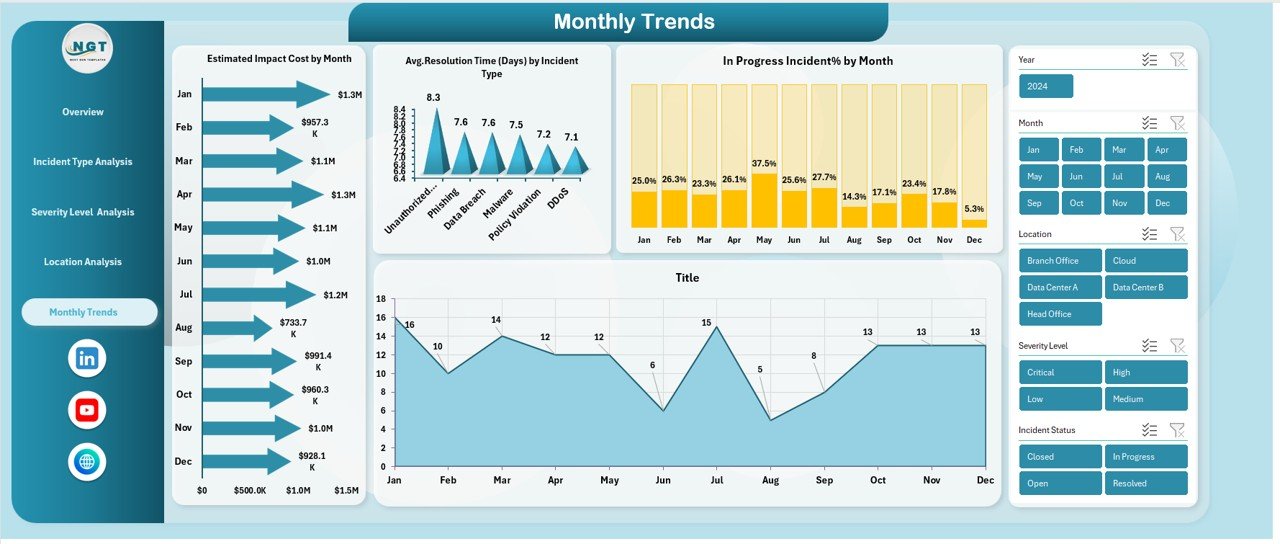
📌 Monthly Trends Analysis
Identify patterns using estimated impact cost by month, resolution time trends, and in-progress incident % over time.
All visuals are built using pivot tables, charts, and slicers, ensuring fast performance and easy customization.
⚙️ How to Use the Security Dashboard in Excel
Using the dashboard is simple and user-friendly:
1️⃣ Enter or paste your security incident data into the structured data sheet
2️⃣ Refresh pivot tables (one click)
3️⃣ Use slicers to filter by month, incident type, severity, location, or team
4️⃣ Review KPIs and charts instantly
5️⃣ Use insights for decision-making, audits, and reporting
No advanced Excel skills are required—basic Excel knowledge is enough to get started immediately.
👥 Who Can Benefit from This Security Dashboard in Excel
This dashboard is ideal for:
👮 Security Managers & Analysts – Monitor threats, response efficiency, and risk exposure
💻 IT & Operations Teams – Track incidents and resolution workloads
📑 Risk & Compliance Officers – Measure compliance rates and audit readiness
🧾 Audit Teams – Access clear, visual incident documentation
🏢 Senior Management – Get instant visibility into organizational security health
🔁 Business Continuity Teams – Identify vulnerabilities and plan preventive actions
Whether you are a small business or a large enterprise, this dashboard scales with your needs.
Click here to read the Detailed blog post
Watch the step-by-step video tutorial:
Visit our YouTube channel to learn step-by-step video tutorials
👉 Youtube.com/@PKAnExcelExpert


Reviews
There are no reviews yet.