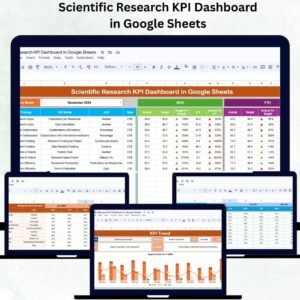
Scientific research depends on accuracy, transparency, and measurable progress. The Scientific Research KPI Dashboard in Google Sheets is a ready-to-use, data-driven solution designed to help universities, laboratories, and R&D departments track and analyze research performance in real time. From grant utilization and publication output to project delays and patent approvals, this dashboard offers complete visibility into all key metrics that define research excellence.
Built entirely in Google Sheets, this dashboard combines automation, visualization, and accessibility — empowering research leaders to make informed, data-backed decisions without needing complex tools or coding knowledge.
🔬 What Is a Scientific Research KPI Dashboard in Google Sheets?
A Scientific Research KPI Dashboard is an interactive analytics tool that consolidates research performance data into one visual interface. It helps track Month-to-Date (MTD) and Year-to-Date (YTD) KPIs, comparing actual results against targets and previous years.
It’s designed for:
-
Research institutes managing multiple projects
-
Academic departments measuring publication efficiency
-
Funding bodies analyzing grant usage and success rates
With automatic charts, conditional formatting, and trend visualization, the dashboard ensures every decision is backed by measurable insights.
📘 Dashboard Structure Overview
This comprehensive dashboard includes six interconnected worksheets, each serving a specialized purpose:
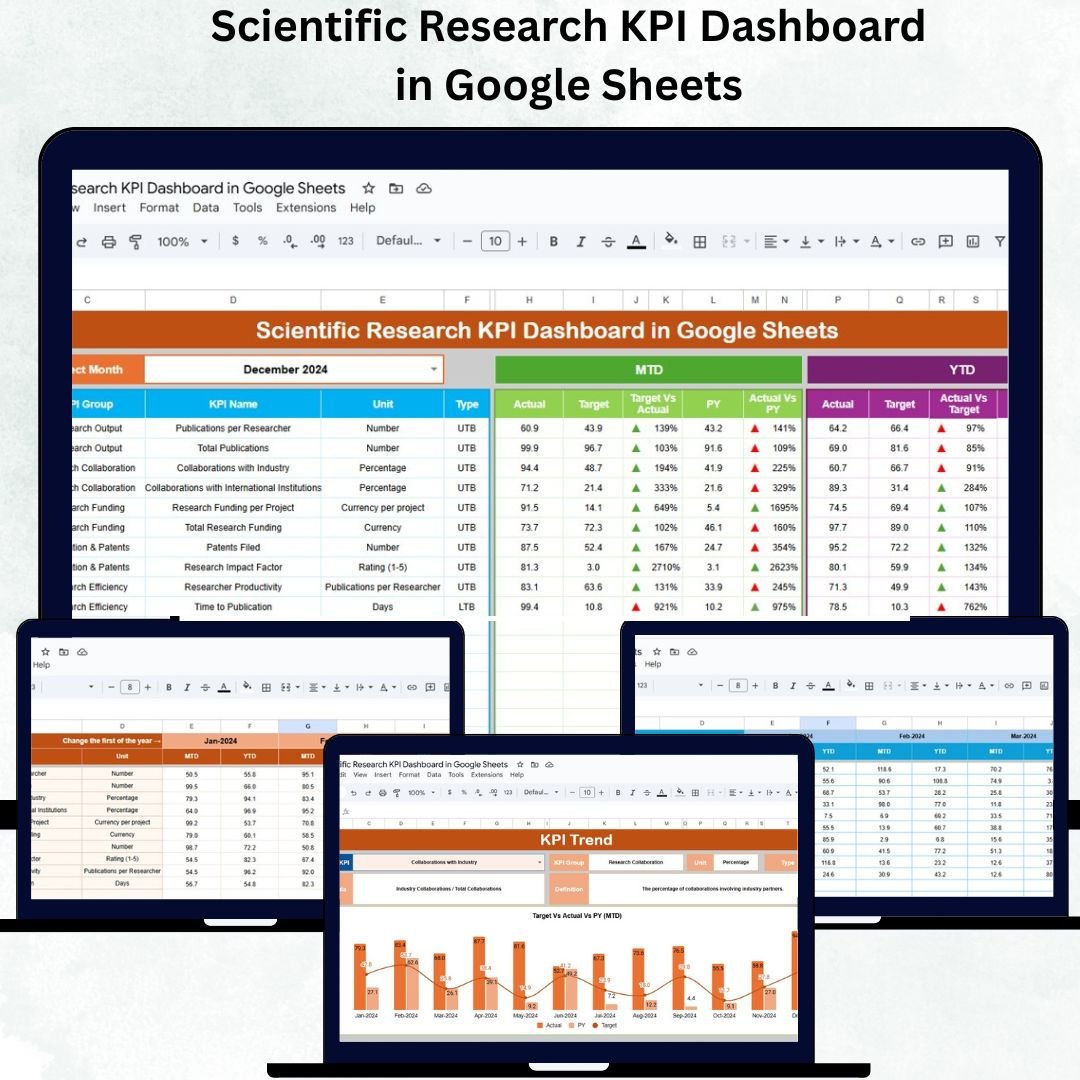
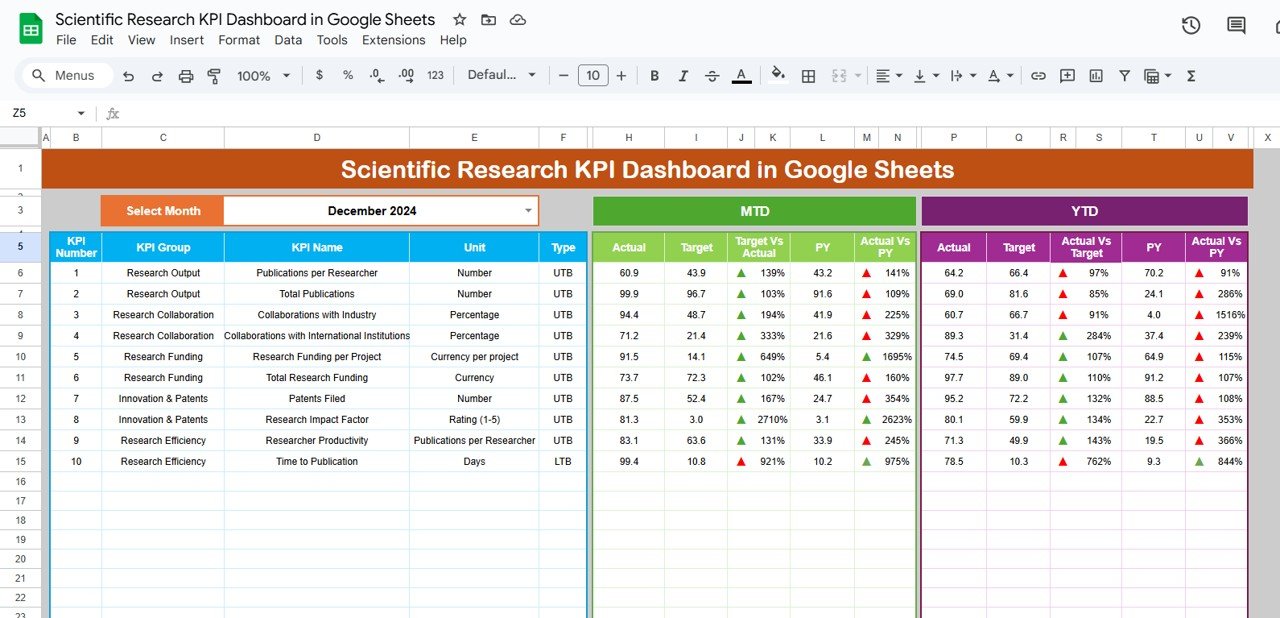
🧭 1. Dashboard Sheet Tab
This is the main interface where users see overall research performance.
-
Month Selector (Cell D3): Choose a specific month to update all visuals automatically.
-
Displays MTD and YTD Actuals, Targets, and Previous Year (PY) comparisons.
-
Conditional Formatting: Green arrows show improvement, red arrows flag decline.
-
Traffic Lights Indicators: Instantly highlight performance status for each KPI.
👉 Ideal for quick executive summaries or performance review meetings.
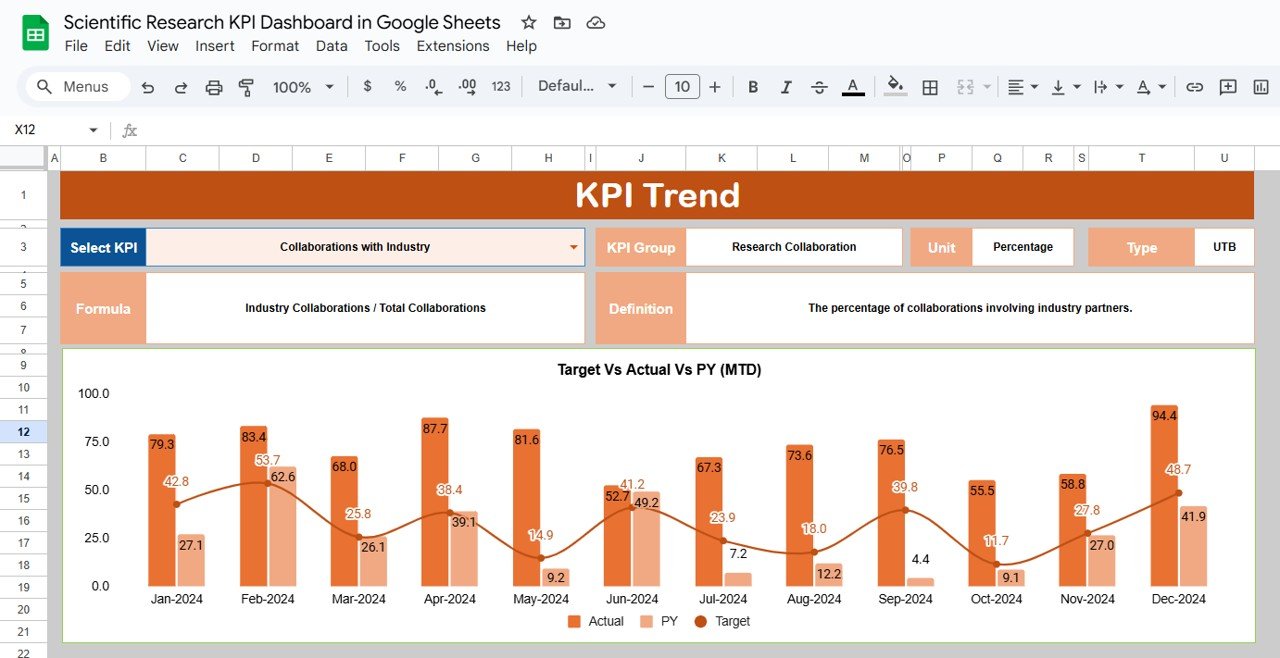
📈 2. KPI Trend Sheet Tab
Analyze the long-term behavior of each KPI:
-
Dropdown (Cell C3) lets you select any KPI to view its historical trend.
-
Displays KPI details — group, unit, formula, definition, and type (UTB/LTB).
-
Monthly trend chart auto-generates for clear visualization.
Use this to monitor progress in publication rate, funding utilization, or researcher productivity over time.
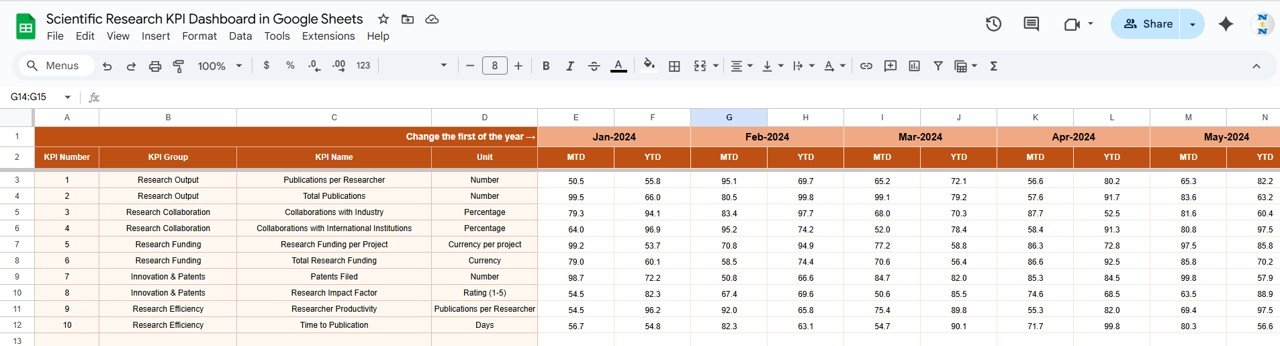
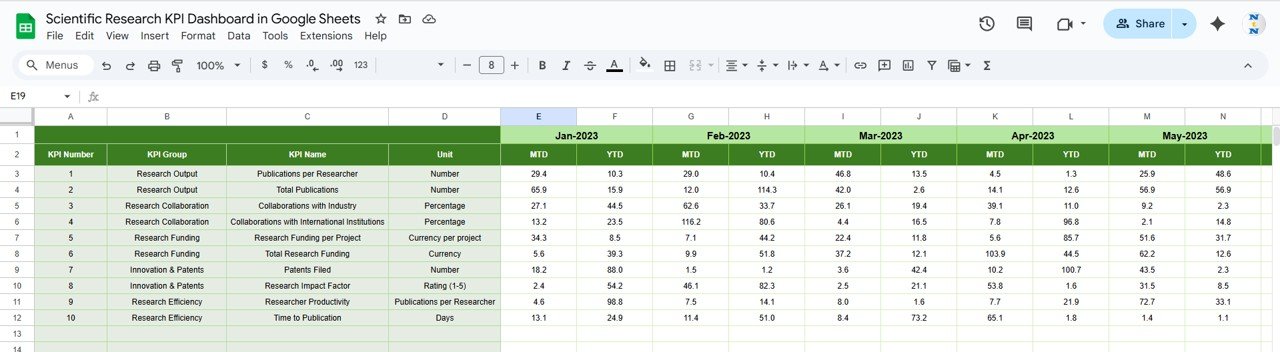
🧾 3. Actual Numbers Sheet Tab
-
Enter monthly MTD and YTD performance data.
-
Automatically linked to dashboard visuals.
-
Month selector (Cell E1) controls which month’s data feeds the main dashboard.
Keeps real-time accuracy across all visual elements.
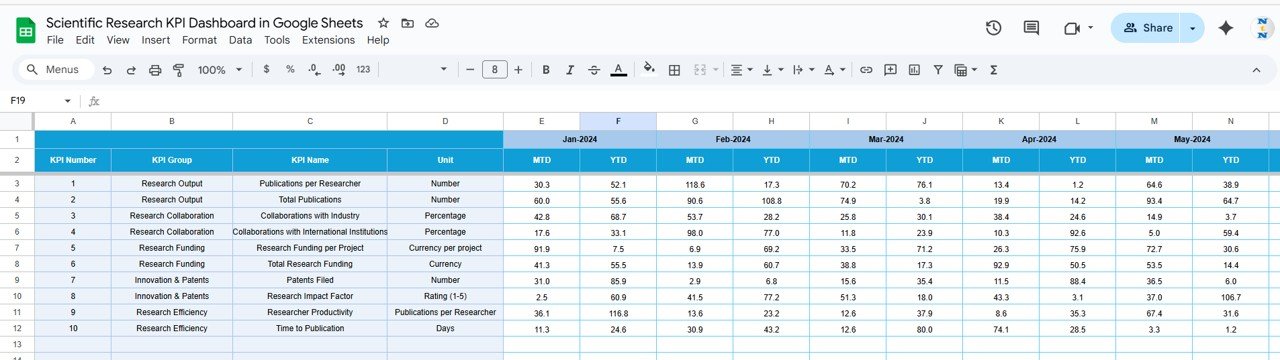
🎯 4. Target Sheet Tab
-
Set monthly MTD and YTD goals for each KPI.
-
Supports department-wise or project-wise target customization.
-
Automatically compares targets with actual results in the dashboard.
🕰️ 5. Previous Year Numbers Sheet Tab
-
Stores historical KPI data from the prior year.
-
Enables YoY (Year-over-Year) comparison and growth tracking.
For example:
📚 Papers Published: 135 this year (↑15% YoY)
💡 Grant Utilization: 92% (↑ from 87% last year)
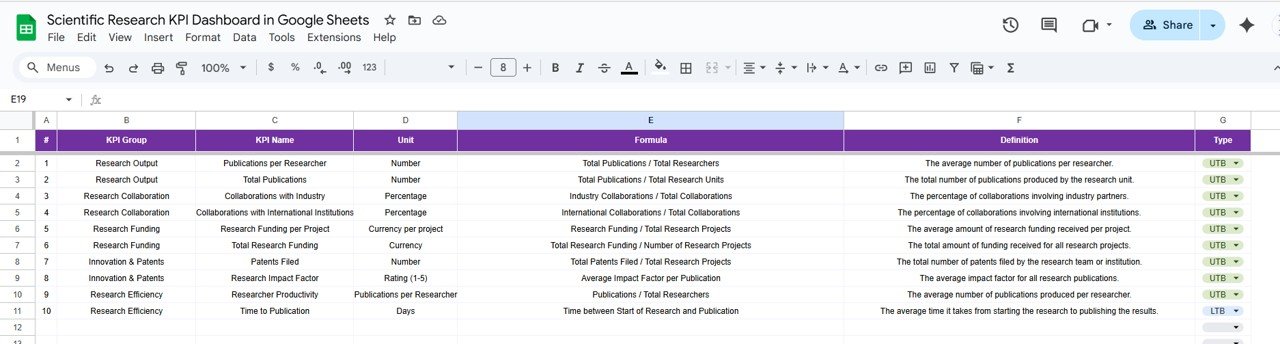
📚 6. KPI Definition Sheet Tab
Acts as your KPI dictionary — ensuring clarity and consistency.
Columns include:
-
KPI Group (Publication, Grants, Projects, Innovation, etc.)
-
KPI Name
-
Unit
-
Formula
-
Definition
-
Type (UTB / LTB)
🌟 Advantages of the Scientific Research KPI Dashboard
-
🧭 Centralized Research Monitoring: View all performance metrics in one place.
-
🧮 Interactive Visualization: Dynamic charts and auto-calculated summaries.
-
📈 Data Accuracy: Reduces manual reporting errors.
-
👩🔬 Performance Transparency: Instantly compare actuals with targets and PY data.
-
🔗 Collaboration-Friendly: Built in Google Sheets for cloud access.
-
🧩 Customizable: Add KPIs specific to your research domain.
-
🧠 Decision Support: Enables faster, data-backed strategic planning.
🚀 Opportunities for Improvement
Enhance your dashboard with advanced functionality:
-
📧 Automated Email Alerts: Notify teams about underperforming KPIs.
-
🧾 Google Forms Integration: Collect research data directly into the sheet.
-
📊 Looker Studio Visualization: Create advanced, interactive reports.
-
⏰ Monthly Summary PDF: Auto-generate research performance reports.
-
👥 Department-Level Filters: Add slicers for team or researcher view.
💡 Best Practices for Using the Dashboard
✅ Update Actual, Target, and PY sheets monthly.
✅ Define SMART KPIs (Specific, Measurable, Achievable, Relevant, Time-bound).
✅ Use the Trend Sheet for forecasting and early issue detection.
✅ Maintain consistent units (%, Count, USD, etc.) for accurate comparisons.
✅ Limit edit permissions for sensitive funding or research data.
✅ Encourage cross-department reviews for collaboration and transparency.
👥 Who Can Use This Dashboard
-
University Research Departments – Track publications and project outcomes.
-
Scientific Labs – Monitor ongoing experiments and funding utilization.
-
R&D Divisions – Measure innovation success and efficiency.
-
Funding Agencies – Evaluate grant usage and impact.
-
Institutional Administrators – Review global research KPIs monthly.
✅ Conclusion
The Scientific Research KPI Dashboard in Google Sheets is an all-in-one monitoring and reporting solution for research institutions. It simplifies complex data, drives accountability, and enables real-time insight into every research indicator — from funding to publication impact.
If your goal is to manage research performance smarter and faster, this dashboard is the perfect tool for maintaining excellence and transparency across your projects.


Reviews
There are no reviews yet.