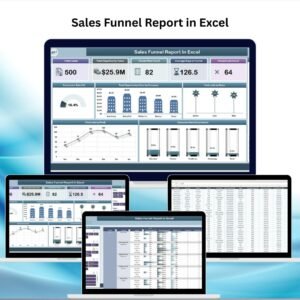
In today’s fast-paced business environment, guessing your way through sales decisions is a recipe for lost opportunities. Data-driven decision-making is the key to achieving higher sales, improved forecasting, and sustainable growth. Our Sales Business Intelligence Report in Excel is a ready-to-use, fully interactive tool designed to help businesses of all sizes track, analyze, and visualize sales performance in real time – without expensive software or steep learning curves.
Whether you’re managing a small sales team or overseeing nationwide operations, this dashboard empowers you to make confident, informed decisions. With its dynamic charts, slicers, and KPI tracking, it turns raw sales data into visually clear and actionable business intelligence.
✨ Key Features of the Sales Business Intelligence Report in Excel
✅ Ready-to-Use Template – No setup hassle. Just input your data and start tracking.
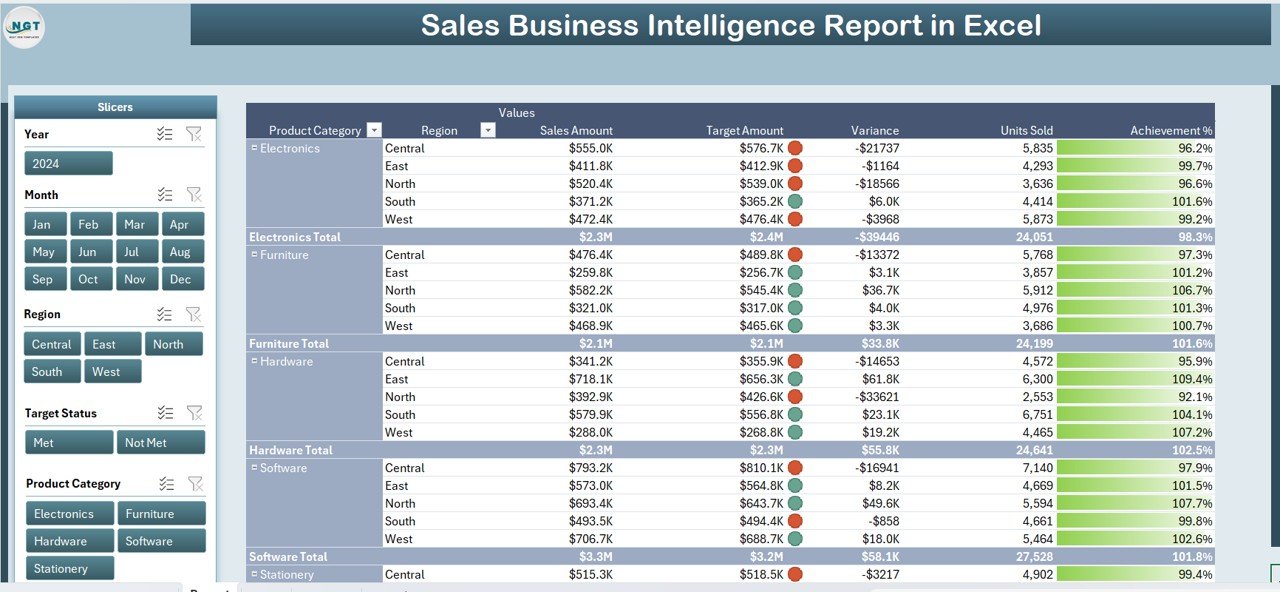
✅ Interactive KPI Dashboard – Instantly see total sales, targets, and performance metrics.
✅ Drill-Down Filters (Slicers) – Analyze by region, product category, salesperson, or time period.
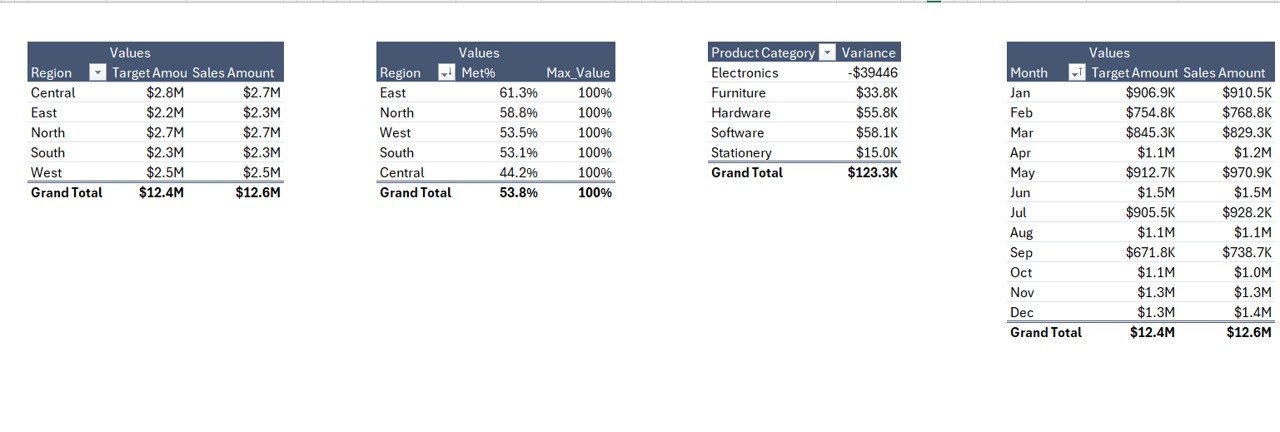
✅ Comprehensive Charts & Graphs – Compare actual sales vs. target, track monthly trends, and identify high-performing areas.
✅ Multiple Pages for In-Depth Analysis – Summary, Report, Data, and Support sheets for complete sales intelligence.
✅ 100% Customizable – Tailor KPIs, colors, and layouts to suit your business needs.
✅ Compatible with All Excel Versions – No need for additional software.
📂 What’s Inside the Sales Business Intelligence Report
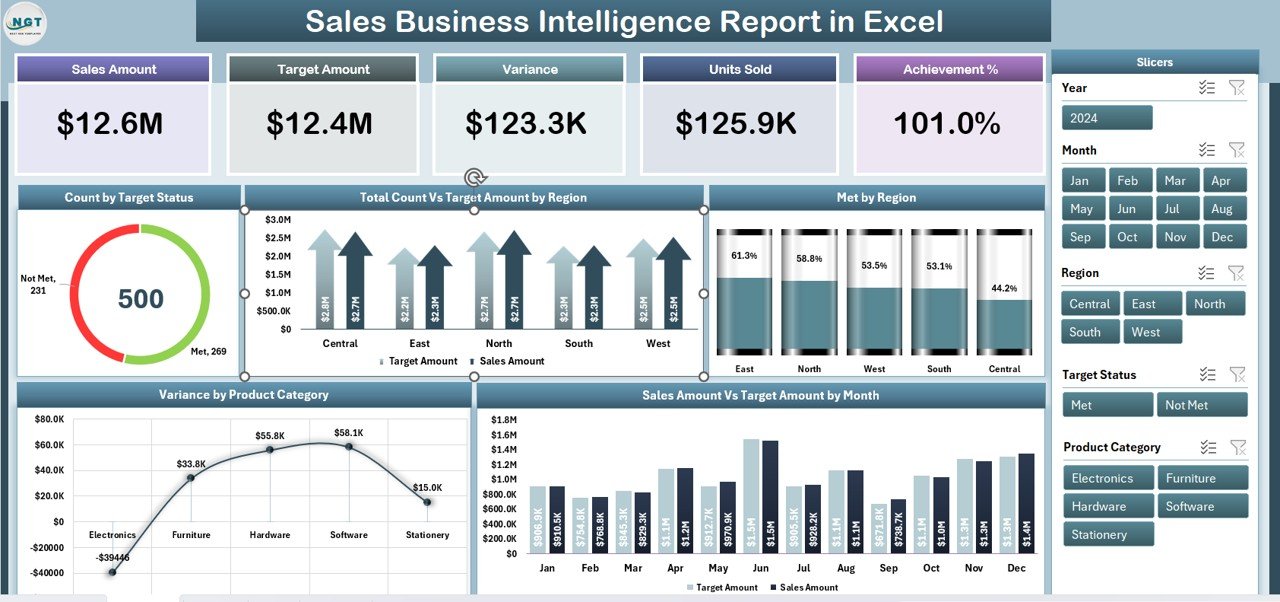
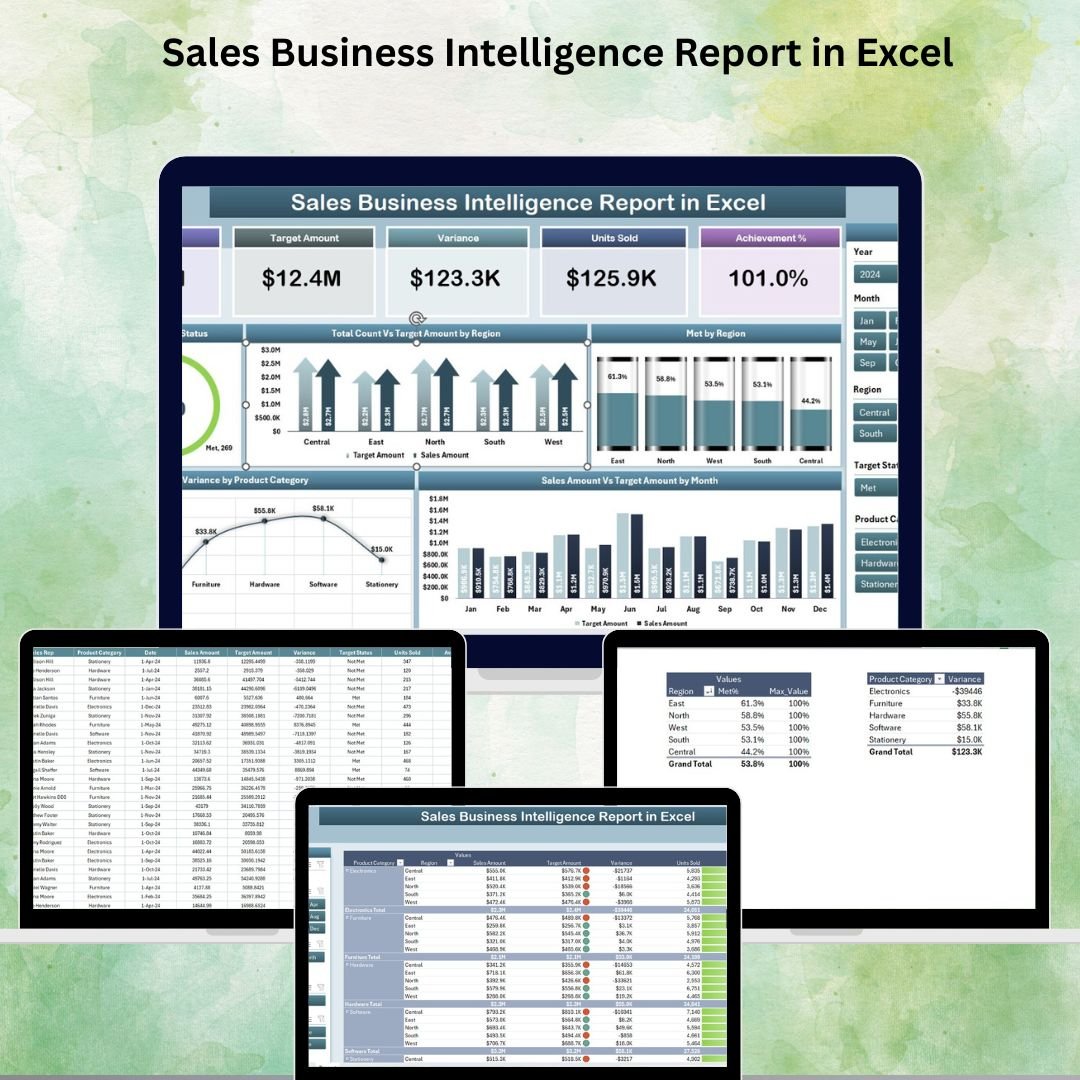
1️⃣ Summary Page – The main dashboard with five KPI cards and interactive charts to monitor sales performance at a glance.
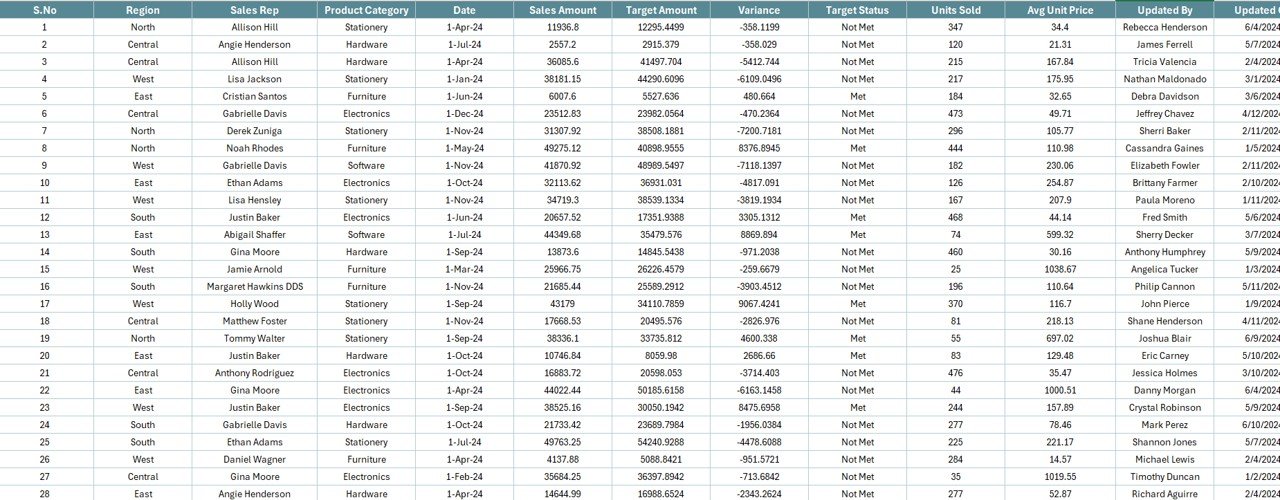
2️⃣ Report Page – A detailed breakdown of transactions with powerful filtering options to isolate the exact data you need.
3️⃣ Data Sheet – The backbone of the report where all your raw sales data is stored and structured.
4️⃣ Support Sheet – Contains reference lists, formulas, and tables that power the interactive dashboard.
Each page is carefully designed for clarity and speed, making it easier than ever to track targets, measure progress, and spot trends.
🛠️ How to Use the Sales Business Intelligence Report
💡 Step 1 – Gather Your Data: Export sales data from your CRM, ERP, or accounting software.
💡 Step 2 – Input Data into the Template: Simply paste your data into the Data Sheet.
💡 Step 3 – Refresh the Dashboard: Use Excel’s refresh option to instantly update KPIs and charts.
💡 Step 4 – Analyze & Take Action: Use slicers to filter results and identify opportunities or problem areas.
💡 Step 5 – Customize if Needed: Add your company logo, adjust KPIs, or change visuals to match your branding.
🎯 Who Can Benefit from This Sales BI Report
🔹 Small & Medium Businesses – Track sales without investing in expensive BI tools.
🔹 Sales Managers – Monitor team performance and set achievable goals.
🔹 Retail & E-commerce Owners – Identify top-selling products and underperforming categories.
🔹 Corporate Executives – Get a high-level overview of company sales in seconds.
🔹 Marketing Teams – Align campaigns with sales performance data.
By using this Sales Business Intelligence Report in Excel, you’ll save time, reduce manual work, and always have a clear picture of where your business stands.
📌 Click here to read the Detailed Blog Post
Visit our YouTube channel to learn step-by-step video tutorials 🎥


Reviews
There are no reviews yet.