In today’s competitive market, understanding sales performance isn’t optional — it’s essential. The Sales Business Intelligence Dashboard in Google Sheets provides a powerful, ready-to-use solution that transforms your raw sales data into meaningful insights. Whether you’re managing regional performance, tracking product category growth, or evaluating your sales reps’ achievements, this dashboard helps you make smarter, data-driven decisions — all without needing expensive BI software or coding knowledge.
Built entirely in Google Sheets, it’s designed for sales managers, executives, and business owners who need instant, visual clarity on performance metrics. With its dynamic charts, KPI cards, and automated variance analysis, this dashboard delivers complete visibility into your sales health.
📘 What Is a Sales Business Intelligence Dashboard in Google Sheets?
A Sales Business Intelligence (BI) Dashboard is a centralized, interactive analytics tool that consolidates all your sales performance data into one visual report.
This dashboard enables users to:
✅ Track sales across regions, products, and sales reps.
✅ Compare actual vs target performance in real time.
✅ Identify trends, gaps, and opportunities instantly.
Unlike complex BI tools, this Google Sheets-based solution is simple, collaborative, and completely customizable — making it ideal for small to mid-sized businesses looking for a cost-effective BI system.
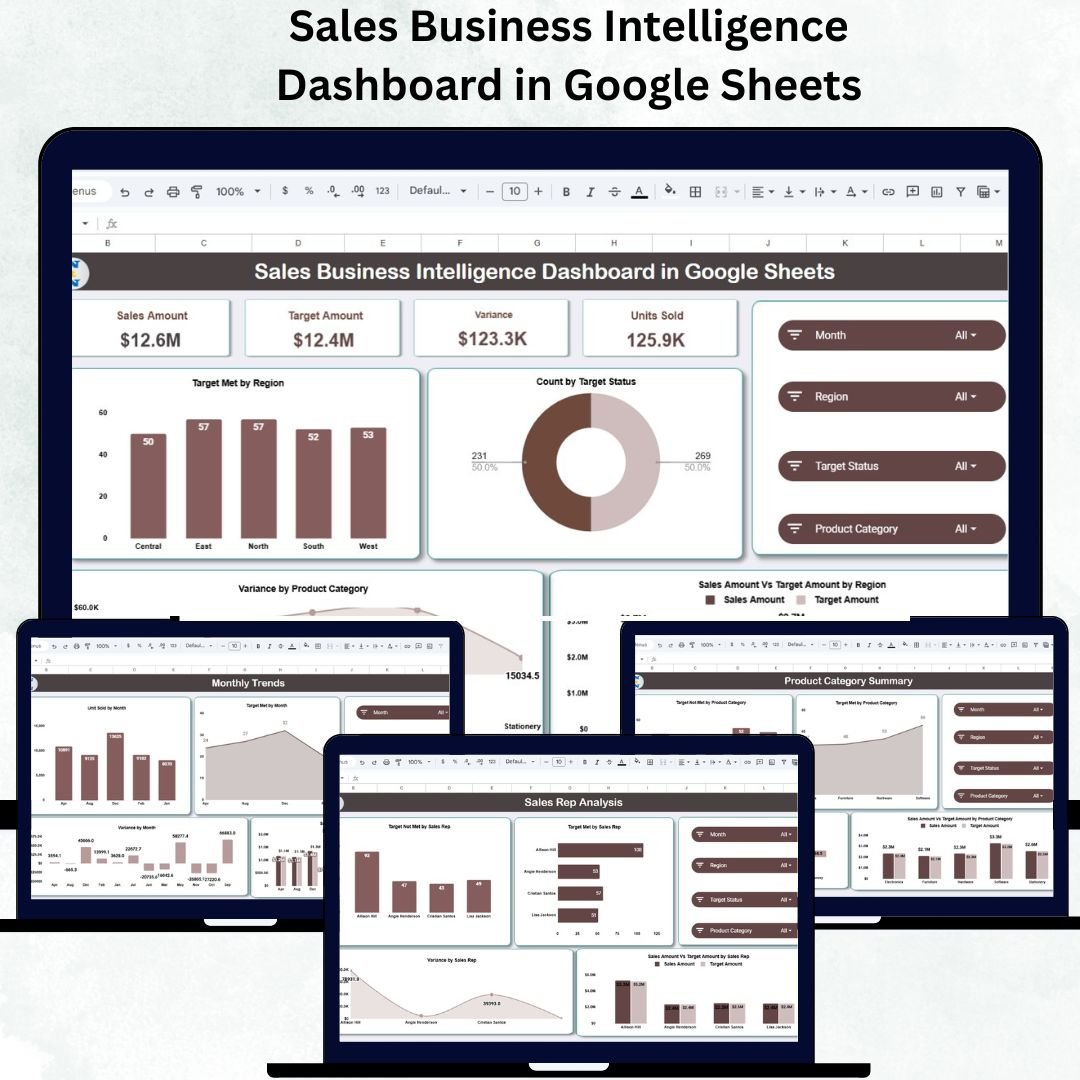
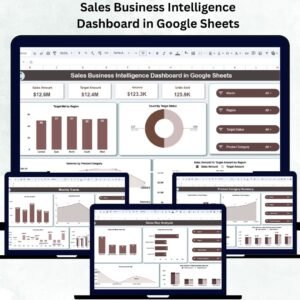
📊 Dashboard Overview
The Sales Business Intelligence Dashboard in Google Sheets includes multiple analysis sections — each designed to give you a complete view of your business performance.
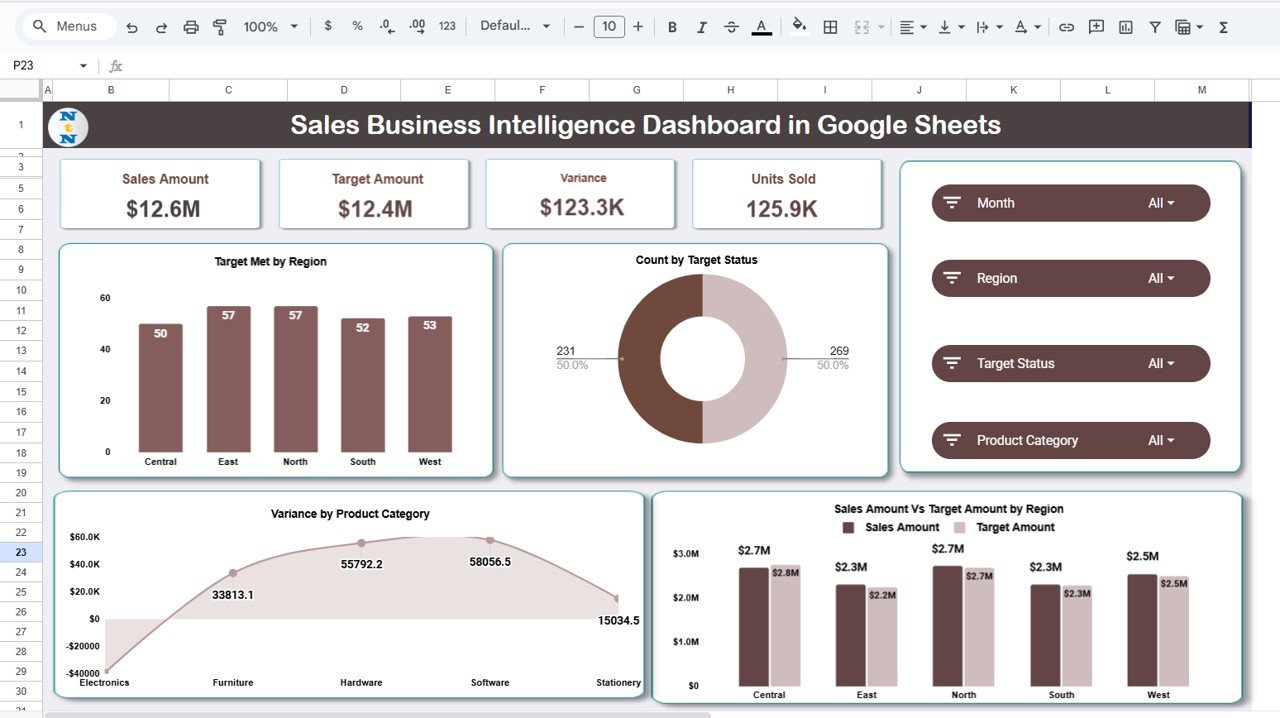
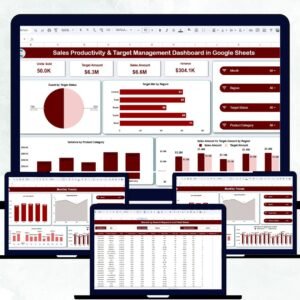
🧭 Overview Sheet (Main Dashboard)
This is the control center of your BI dashboard. It provides an at-a-glance summary of your key metrics.
KPI Cards:
-
Sales Amount: Total revenue achieved.
-
Target Amount: Expected goal for the selected period.
-
Variance: Difference between actual and target values (auto-highlighted with color-coded arrows).
-
Units Sold: Total products sold.
Key Charts:
-
Target Met by Region: See which regions hit their sales goals.
-
Count by Target Status: Breakdown of regions meeting or missing targets.
-
Sales vs Target by Region: Compare regional performance.
-
Variance by Product Category: Identify which categories overperform or underperform.
This section gives leadership an instant financial pulse of the business.
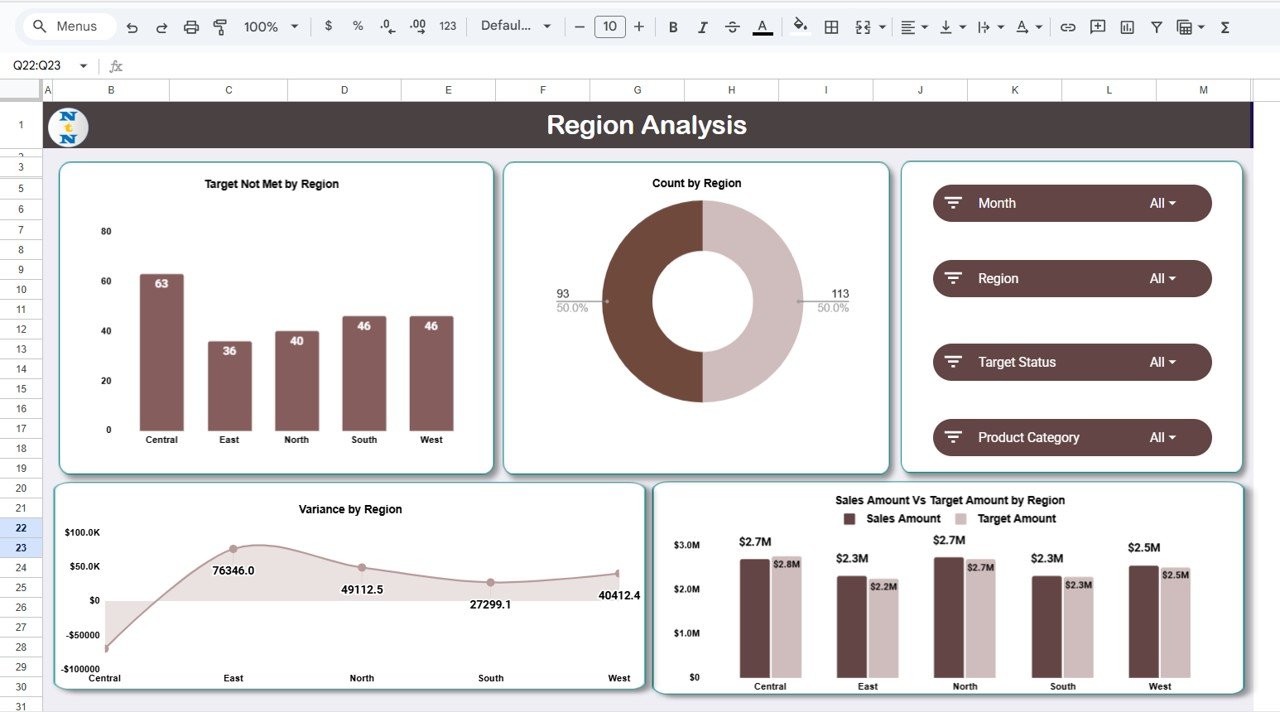
🌍 Region Analysis
Dive deeper into performance by region.
-
Target Not Met by Region: Quickly see areas below expectations.
-
Sales vs Target by Region: Compare numbers visually.
-
Variance by Region: Identify underperforming markets.
Ideal for regional heads and territory managers to spot performance gaps early.
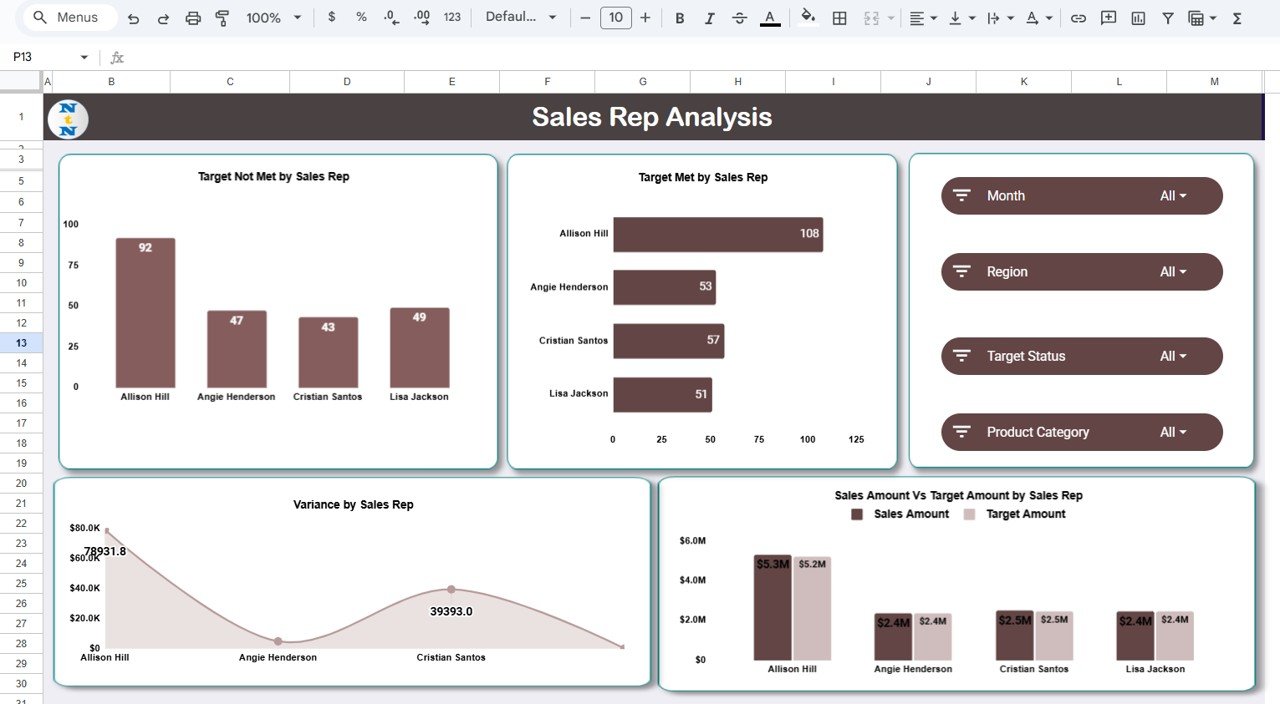
👥 Sales Representative Analysis
Evaluate your team’s productivity with precision.
Charts include:
-
Target Met vs Not Met by Rep
-
Sales vs Target by Sales Rep
-
Variance by Sales Rep
These visuals make it easy to reward top performers and identify training needs.
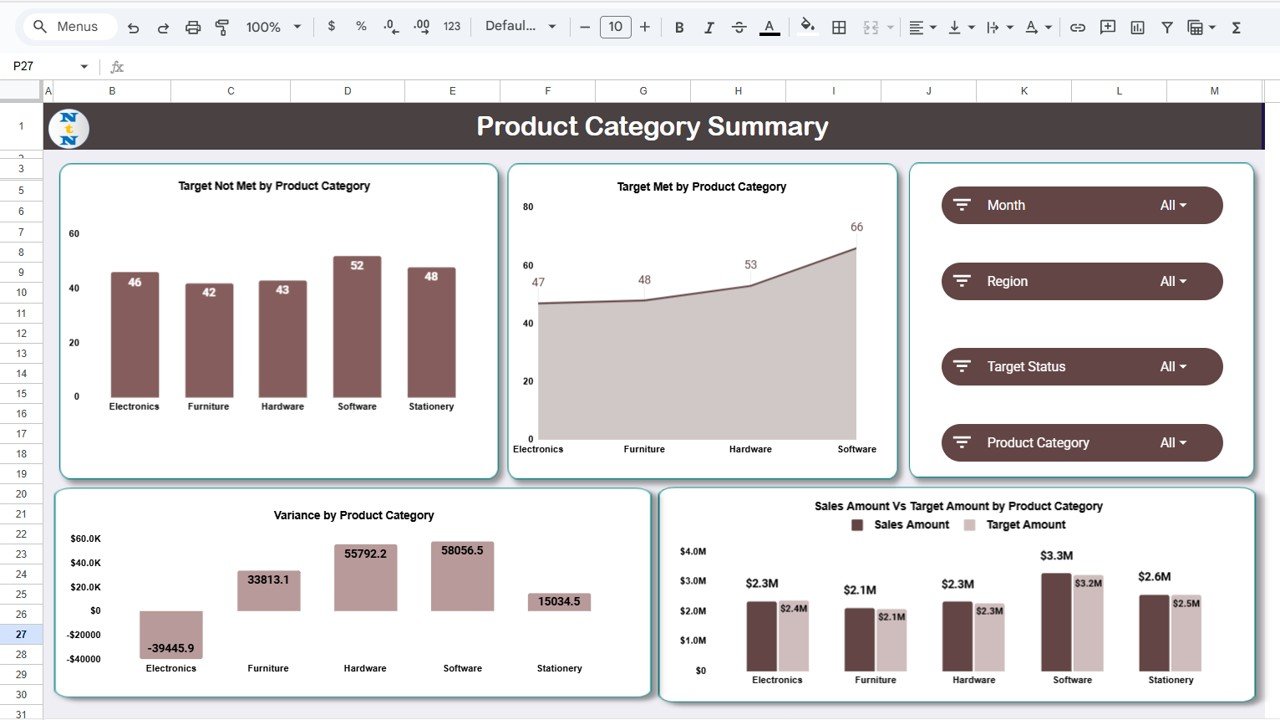
📦 Product Category Summary
Analyze revenue distribution across product lines.
-
Sales Amount vs Target by Product Category
-
Target Achievement by Category
-
Variance by Category
This helps product and marketing teams focus on high-performing items while improving weak categories.
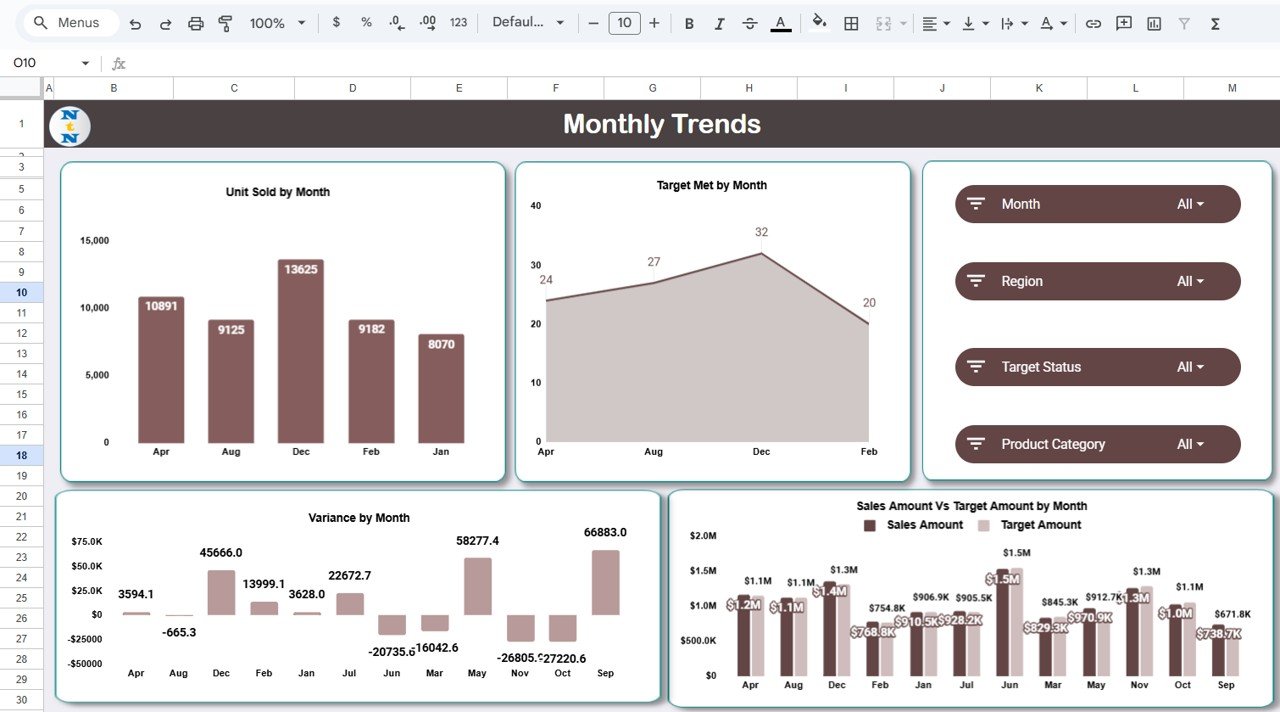
📅 Monthly Trends
Monitor sales behavior over time.
-
Sales Amount vs Target Amount by Month
-
Units Sold by Month
-
Variance by Month
Great for spotting seasonal trends and planning future targets more effectively.
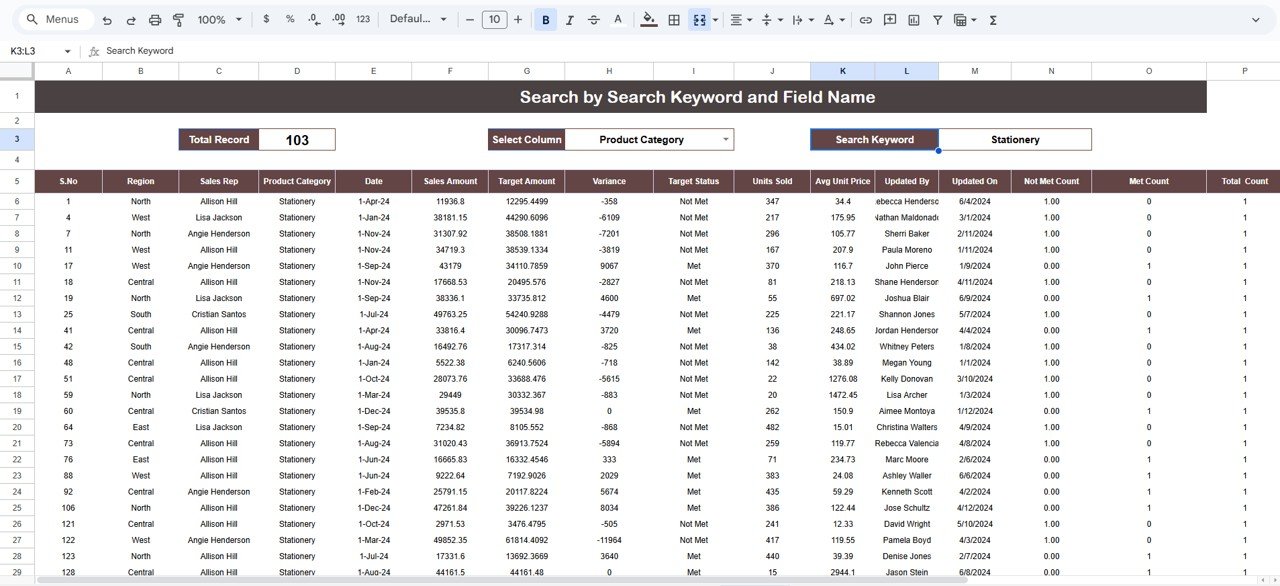
🔍 Search Tab
Find any record instantly. Type keywords like “East Region,” “John Smith,” or “Electronics” to filter all related results automatically — no scrolling required.
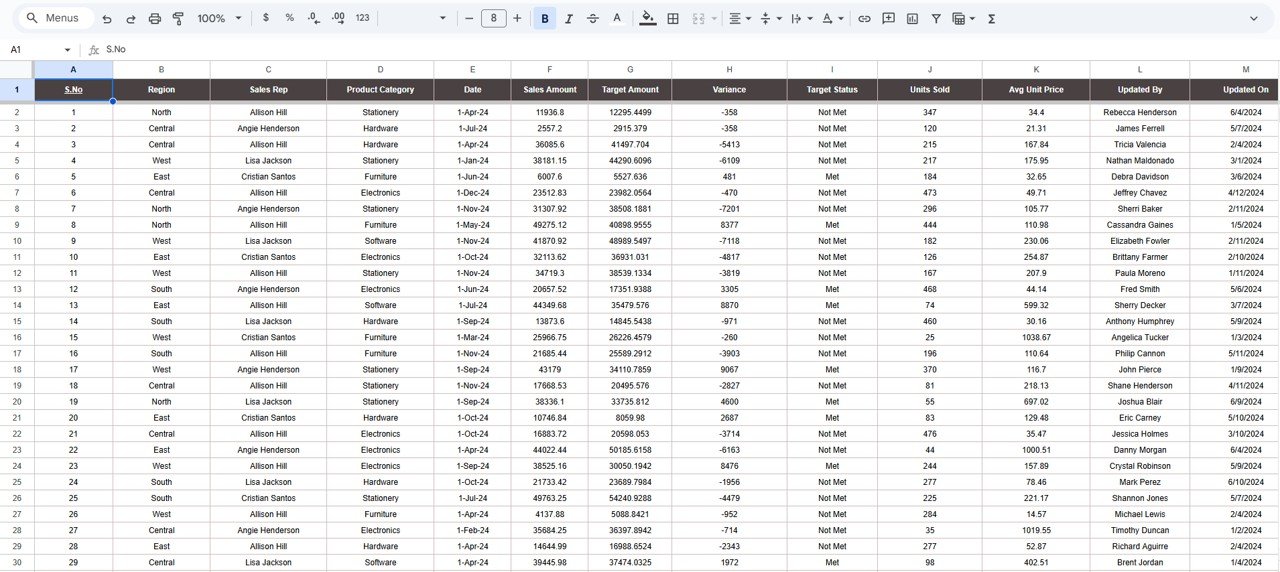
🗂️ Data Sheet
The foundation of the dashboard where all sales data resides.
Columns Include:
Date | Region | Sales Rep | Product Category | Sales Amount | Target Amount | Units Sold | Target Status
Once updated, all visuals refresh automatically — ensuring your reports stay accurate and live.
🌟 Advantages of the Sales BI Dashboard
-
⚡ Instant Visualization: Transform data into dynamic charts automatically.
-
🌍 Real-Time Collaboration: Multiple users can view and update simultaneously.
-
📈 Comprehensive Insights: Analyze by region, rep, product, and time.
-
💡 Decision-Ready Analytics: Identify underperforming areas in seconds.
-
🧩 Customizable: Add KPIs, filters, or charts easily.
-
☁️ Cloud-Based: Access it anywhere — desktop or mobile.
-
🧮 Error-Free Automation: Built-in formulas reduce manual work.
🚀 Opportunities for Improvement
You can take this dashboard further by adding:
-
🔗 CRM Integration: Auto-import sales data from HubSpot or Salesforce.
-
📧 Email Notifications: Alert managers when targets are missed or exceeded.
-
🔮 Forecast Charts: Predict future revenue trends.
-
🗺️ Geo Mapping: Visualize regional performance on Google Maps.
-
⚙️ Dynamic Filters: Add slicers for custom data views.
💡 Best Practices for Using the Dashboard
✅ Update sales data weekly or monthly.
✅ Maintain consistent formatting for currency and dates.
✅ Review variance trends regularly for improvement.
✅ Set achievable, realistic targets.
✅ Share view-only links with your team for reporting.
✅ Back up monthly data for historical reference.
👥 Who Can Use This Dashboard
-
Sales Managers: Monitor performance across teams.
-
Regional Heads: Compare territories and results.
-
Executives: Evaluate business-wide sales trends.
-
Product Managers: Track product-specific revenue growth.
-
Entrepreneurs: Gain complete control over sales analytics.
✅ Conclusion
The Sales Business Intelligence Dashboard in Google Sheets is your all-in-one sales analytics hub. With its visual KPIs, interactive reports, and real-time updates, it transforms data into clear insights that empower smarter decisions.
Whether you’re reviewing regional performance, tracking monthly targets, or evaluating product sales — this dashboard delivers clarity, precision, and control.
If you want to turn your sales data into action, this Google Sheets BI dashboard is the perfect solution.
🔗 Click here to read the detailed blog post
Watch the step-by-step video Demo:


Reviews
There are no reviews yet.