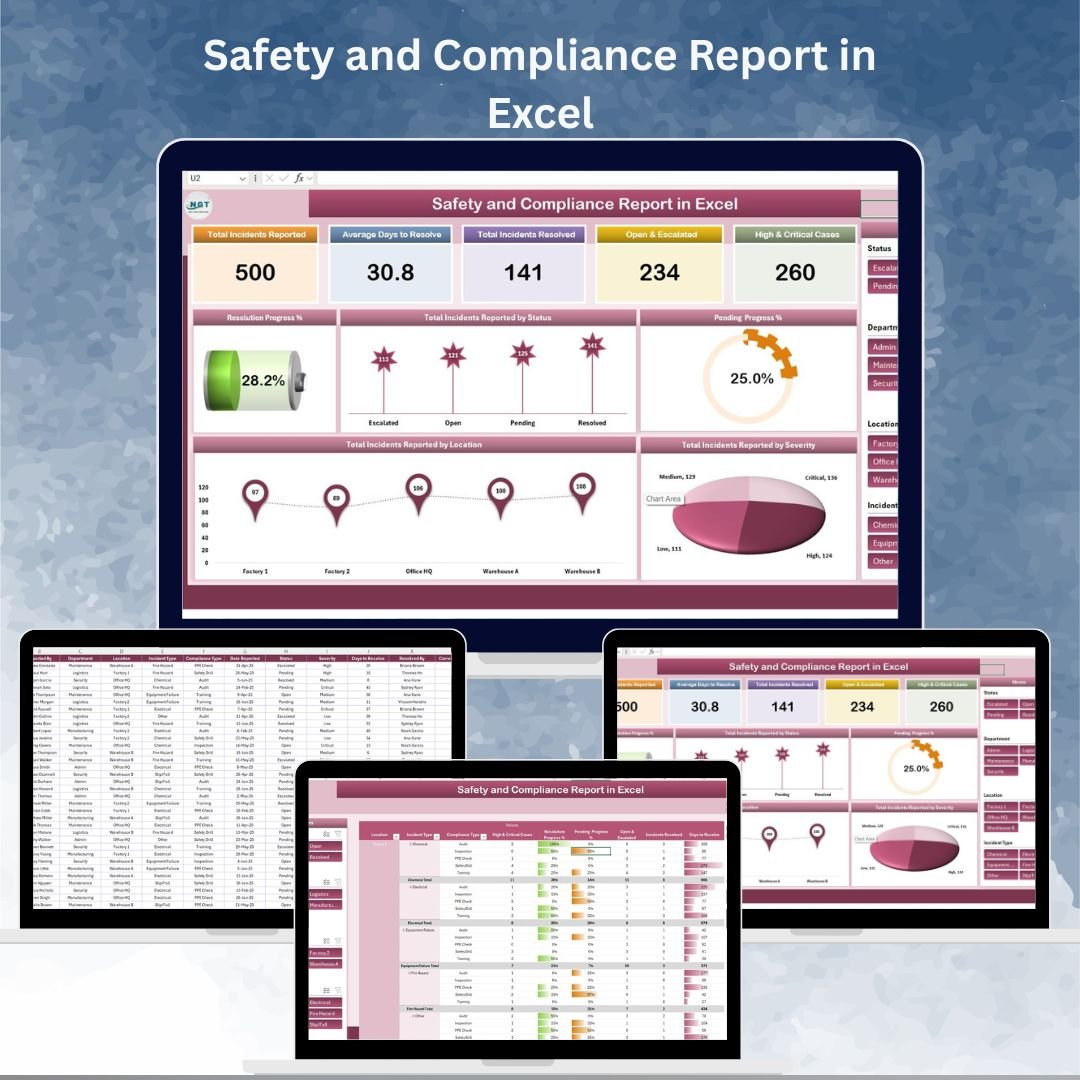
Maintaining a safe, compliant, and risk-free workplace is essential for every organization — but without proper reporting, critical issues can easily be overlooked. The Safety and Compliance Report in Excel is a ready-to-use, fully customizable tool designed to help safety managers, compliance officers, and operations teams monitor workplace incidents, track resolution progress, and proactively improve safety performance.
This comprehensive Excel report consolidates all safety incidents into one centralized platform, allowing you to track incident status, severity, resolution times, and compliance trends at a glance. With summary cards, visual charts, and drill-down analysis, you can quickly identify high-risk areas, prioritize escalated cases, and ensure regulatory adherence across the organization.
Whether you manage one office or multiple facilities, this report empowers you with real-time insights to improve workplace safety and make proactive, data-driven decisions.
🔑 Key Features of the Safety and Compliance Report
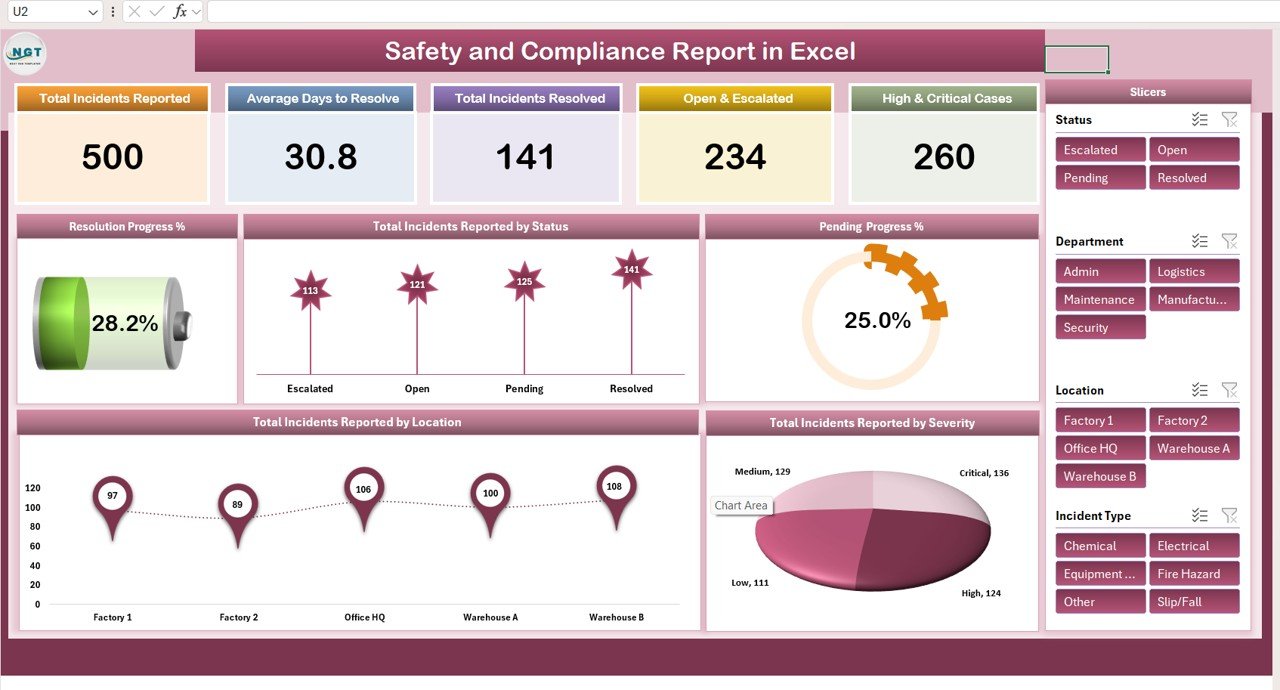
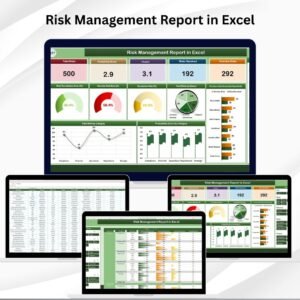
📌 Summary Sheet Tab – High-Level Safety Overview
Cards Include:
-
Total Incidents Reported
-
Average Days to Resolve
-
Total Incidents Resolved
-
Open & Escalated Cases
-
High & Critical Cases
Charts Include:
-
Resolution Progress (%)
-
Total Incidents by Status
-
Pending Progress (%)
-
Total Incidents by Severity
-
Total Incidents by Location
A quick and clear view of current safety performance and compliance status.
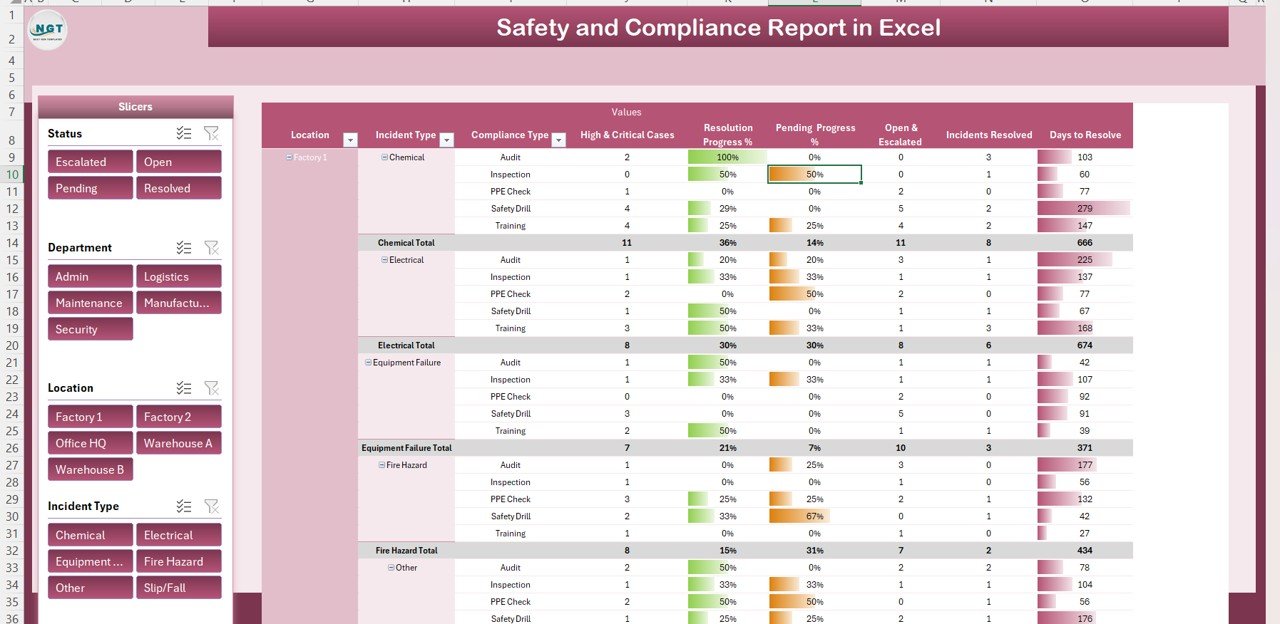
📌 Report Sheet Tab – Detailed Pivot Table Analysis
-
Filter incidents by department, location, or severity
-
Separate views for open, resolved, and escalated cases
-
Analyze resolution times by incident type or team
-
Drill down into high-risk or critical incidents for corrective action
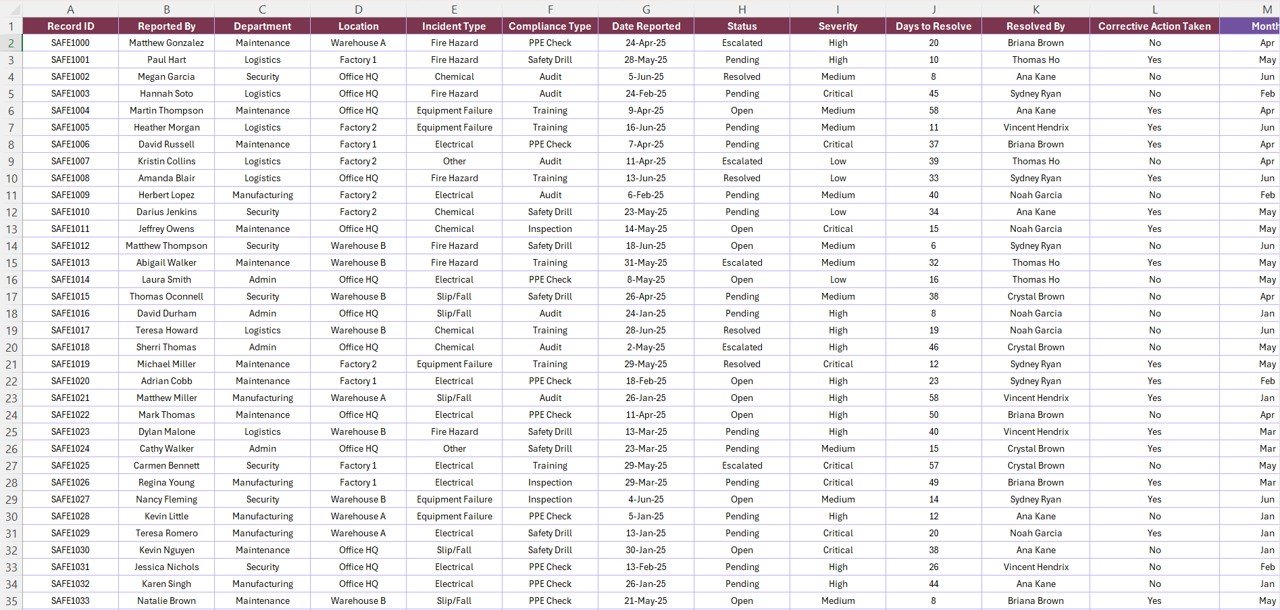
📌 Data Sheet Tab – Centralized Incident Database
-
Fields Include:
-
Incident ID & Description
-
Date Reported & Resolution Date
-
Department & Location
-
Status (Open / Resolved / Escalated)
-
Severity (Low / Medium / High / Critical)
-
Days to Resolve
-
-
All metrics and visualizations update automatically when data is entered
📦 What’s Inside the Safety and Compliance Report?
✅ Summary Sheet – Dashboard with KPIs & charts
✅ Report Sheet – Pivot-based analysis and drill-down views
✅ Data Sheet – Full incident log (input)
✅ Pre-Built Formulas & Charts – No setup required
✅ Customizable Layout – Add custom KPIs or categories
✅ Sample Data – Quickly understand how everything works
🧠 How to Use the Report
-
Open the file and go to the Data Sheet
-
Enter or update incident information
-
Review the Summary Sheet for quick insights
-
Use the Report Sheet to drill down into severity, location, and progress
-
Update regularly to monitor performance and improve safety outcomes
👥 Who Can Benefit from This Report?
-
👷 Safety Managers – Track incidents and prioritize critical cases
-
🛡️ Compliance Officers – Ensure adherence to regulatory requirements
-
🏢 Operations Managers – Monitor safety status across locations
-
📊 Management Teams – Analyze trends and support strategic planning
🔗 Click here to read the Detailed blog post
Watch the step-by-step video Demo:


Reviews
There are no reviews yet.