

Retail businesses operate in a highly competitive environment where profit margins remain under constant pressure. Costs fluctuate, supplier prices change, discounts increase, and customer demand shifts quickly. Therefore, retailers must track profit margins continuously to protect profitability and stay competitive. However, many teams still depend on scattered spreadsheets or delayed financial reports. As a result, margin analysis becomes slow, inconsistent, and reactive.
That is exactly why a Retail Profit Margin KPI Dashboard in Google Sheets becomes a powerful and practical decision-making tool.
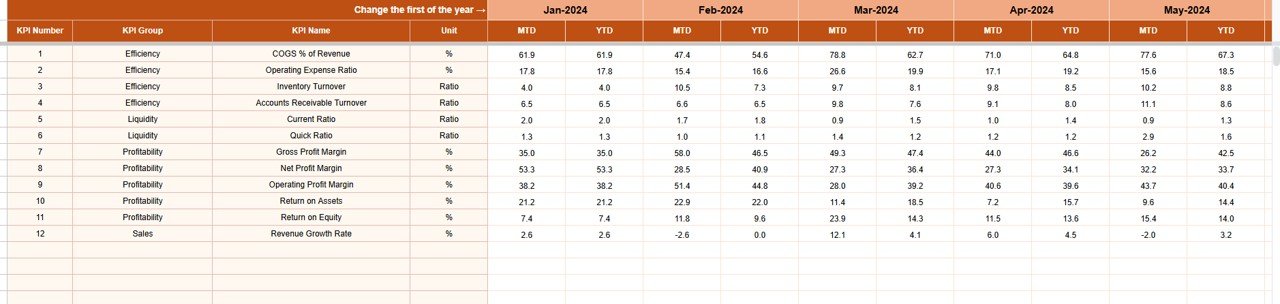
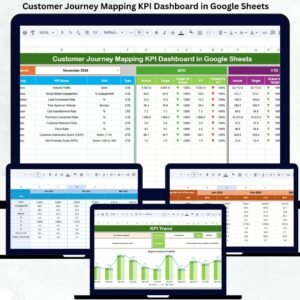
This ready-to-use dashboard converts raw retail sales and cost data into clear profit margin KPIs, visual comparisons, and actionable insights. It allows retailers to track Month-to-Date (MTD) and Year-to-Date (YTD) profit margins while comparing results against targets and previous-year performance. Instead of guessing which products, stores, or pricing strategies hurt margins, teams gain data-driven clarity.
Because the dashboard runs entirely in Google Sheets, it supports real-time collaboration, fast updates, and easy customization—without expensive BI software or complex setup.

📊 Key Features of the Retail Profit Margin KPI Dashboard
📅 Monthly KPI Selector
Select any month from the dropdown, and the dashboard updates instantly.
📈 MTD & YTD Profit Margin Tracking
Monitor short-term performance while keeping a clear view of long-term profitability trends.
🎯 Target vs Actual Margin Comparison
Measure whether actual margins meet planned targets.
📊 Previous Year Comparison
Identify improvement or decline compared to last year.
🚦 Visual Performance Indicators
Up and down arrows highlight margin improvement or deterioration instantly.
🧩 Fully Customizable KPI Structure
Edit KPIs, targets, formulas, and definitions to match your retail model.
📦 What’s Inside the Retail Profit Margin KPI Dashboard
🧭 Dashboard Sheet Tab – Executive Profit View
This sheet provides a high-level profitability summary for leadership.
Month Selection
-
Available in Cell D3
-
Updates all KPIs automatically
MTD KPIs Displayed
-
MTD Actual
-
MTD Target
-
MTD Previous Year
-
Target vs Actual (%)
-
PY vs Actual (%)
YTD KPIs Displayed
-
YTD Actual
-
YTD Target
-
YTD Previous Year
-
Target vs Actual (%)
-
PY vs Actual (%)
Directional arrows clearly show margin improvement or decline.
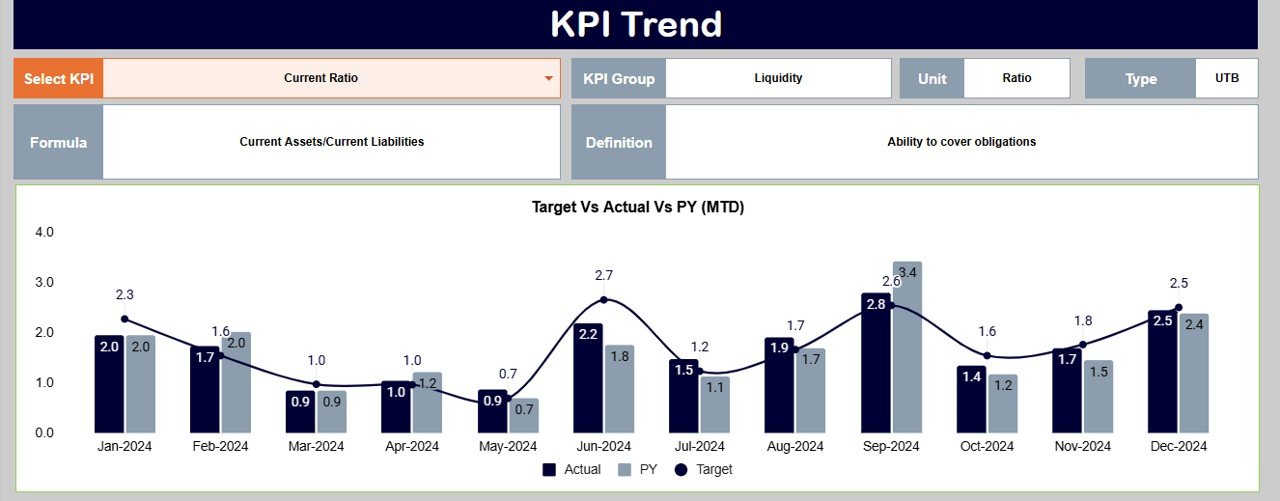
📉 KPI Trend Sheet Tab – KPI Deep Dive
This sheet explains each KPI in detail.
How It Works
-
Select KPI from dropdown in Cell C3
-
The sheet updates dynamically
Displayed Information
-
KPI Group
-
KPI Unit
-
KPI Type (Upper the Better / Lower the Better)
-
KPI Formula
-
KPI Definition
This ensures every stakeholder understands margin calculations clearly.
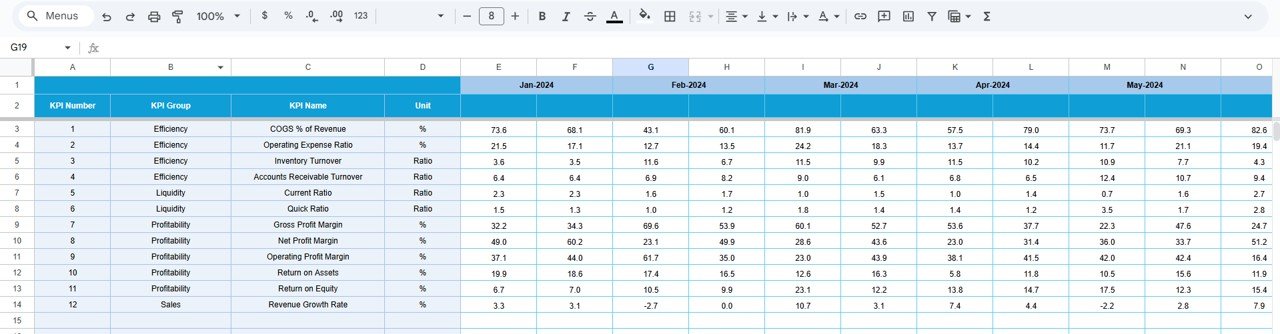
🧮 Actual Number Sheet Tab
This sheet captures real performance data.
Process
-
Select the first month of the year in Cell E1
-
Enter MTD Actual and YTD Actual values
-
Dashboard updates automatically
This structure prevents formula errors and improves reporting accuracy.
🎯 Target Sheet Tab
This sheet defines expected margin performance.
Why It Matters
-
Sets clear margin goals
-
Aligns pricing and cost strategies
-
Enables objective evaluation
📊 Previous Year Number Sheet Tab
This sheet stores historical margin data.
Benefits
-
Year-over-year analysis
-
Seasonal trend identification
-
Early detection of recurring margin issues
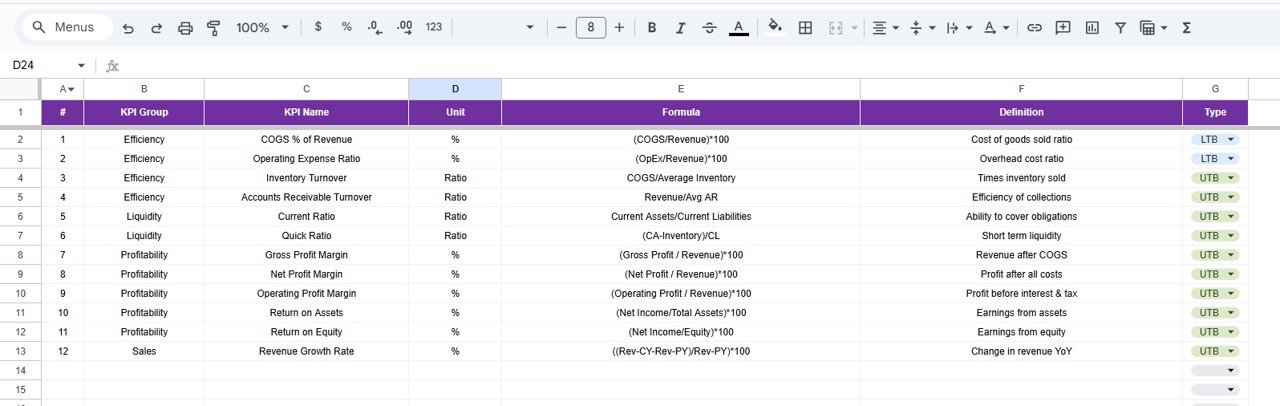
📚 KPI Definition Sheet Tab
This sheet acts as the KPI master reference.
Includes
-
KPI Name
-
KPI Group
-
Unit
-
Formula
-
Definition
-
KPI Type
It ensures consistency, governance, and audit readiness.
🎯 Who Can Use This Dashboard
-
🛒 Retail Owners & Store Managers
-
💰 Finance & Accounting Teams
-
📊 Category & Pricing Managers
-
🧾 Merchandising Teams
-
🚀 Retail Leadership Teams
🛠️ How to Use the Dashboard Effectively
-
Update sales and cost data regularly
-
Review MTD and YTD margins monthly
-
Compare Actual vs Target consistently
-
Analyze year-over-year trends
-
Share insights with pricing and procurement teams
Consistent usage leads to stronger margin control and smarter pricing decisions.


Reviews
There are no reviews yet.