


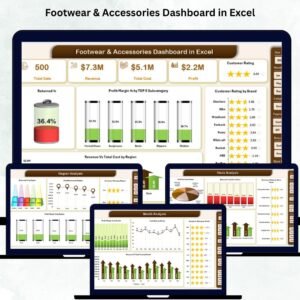
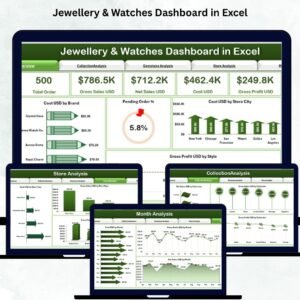
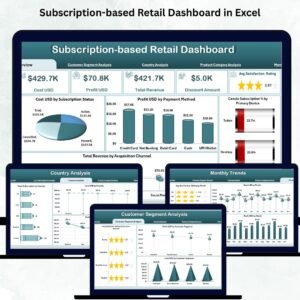
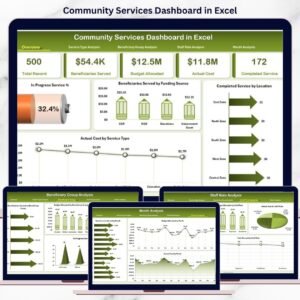
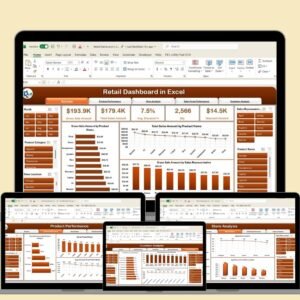
In the competitive retail landscape, staying on top of key performance indicators (KPIs) is essential for success. The Retail Dashboard in Excel is a comprehensive tool designed to help retail managers and business owners monitor critical metrics such as sales growth, inventory turnover, and customer satisfaction. With this dashboard, you can easily track performance across multiple areas, analyze trends, and make data-driven decisions to enhance the overall effectiveness of your retail business.

Key Features:
-
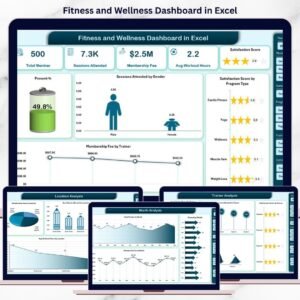
Interactive Dashboard Sheet: Select the month, and all data updates automatically for real-time insights, allowing you to monitor performance consistently.
-
KPI Trend Sheet: Track the performance of individual KPIs over time, including detailed information on each metric, with clear definitions and formulas.
-
Actual and Target Sheets: Easily input actual values and target numbers, and track both Month-To-Date (MTD) and Year-To-Date (YTD) performance.
-
Previous Year Comparison: Compare your current performance against previous year data to assess growth and identify areas for improvement.
-
Customizable KPI Definitions: Modify the names, units, and formulas for each KPI, allowing you to tailor the dashboard to your retail business needs.
Benefits:
-
Enhanced Decision-Making: With real-time data and interactive visualizations, make informed decisions that can drive growth and improve your retail operations.
-
Increased Accountability: Track progress towards key retail goals, monitor KPIs, and identify areas that require improvement. This promotes accountability across teams and departments.
-
Resource Optimization: By identifying trends and patterns in the data, allocate resources more effectively to areas that need the most attention, improving overall business efficiency.
-
Regulatory Compliance: Stay compliant with industry regulations and best practices by monitoring key retail metrics and ensuring that your business meets the required standards.
How to Use:
-
Access the Template: Open the provided Excel template link and make a copy to your system.
-
Customize Metrics: Modify the existing KPIs or add new ones that align with your specific retail goals.
-
Input Data: Regularly update the dashboard with actual performance data to keep it current.
-
Analyze Trends: Use the visualizations, charts, and graphs to analyze trends, identify anomalies, and track your progress over time.
-
Share Insights: Share the dashboard with stakeholders, department heads, or other team members to facilitate collaborative decision-making and drive performance improvements.
Who Can Benefit:
-
Retail Managers: Oversee the performance of retail operations and ensure all departments meet their objectives. Track sales, customer engagement, and inventory turnover with ease.
-
Business Analysts: Use the dashboard to provide actionable insights into retail performance and recommend strategies for improvement.
-
Inventory Managers: Monitor stock levels, manage inventory turnover, and optimize product restocking strategies.
-
Marketing Teams: Analyze the effectiveness of marketing campaigns by tracking KPIs such as customer acquisition cost, conversion rates, and return on investment.
By implementing the Retail Dashboard in Excel, retail businesses can enhance their ability to monitor performance, optimize operations, and make data-driven decisions that will lead to improved efficiency and profitability.
🔗 Click here to read the Detailed blog post
Visit our YouTube channel to learn step-by-step video tutorials
Youtube.com/@PKAnExcelExpert


Reviews
There are no reviews yet.