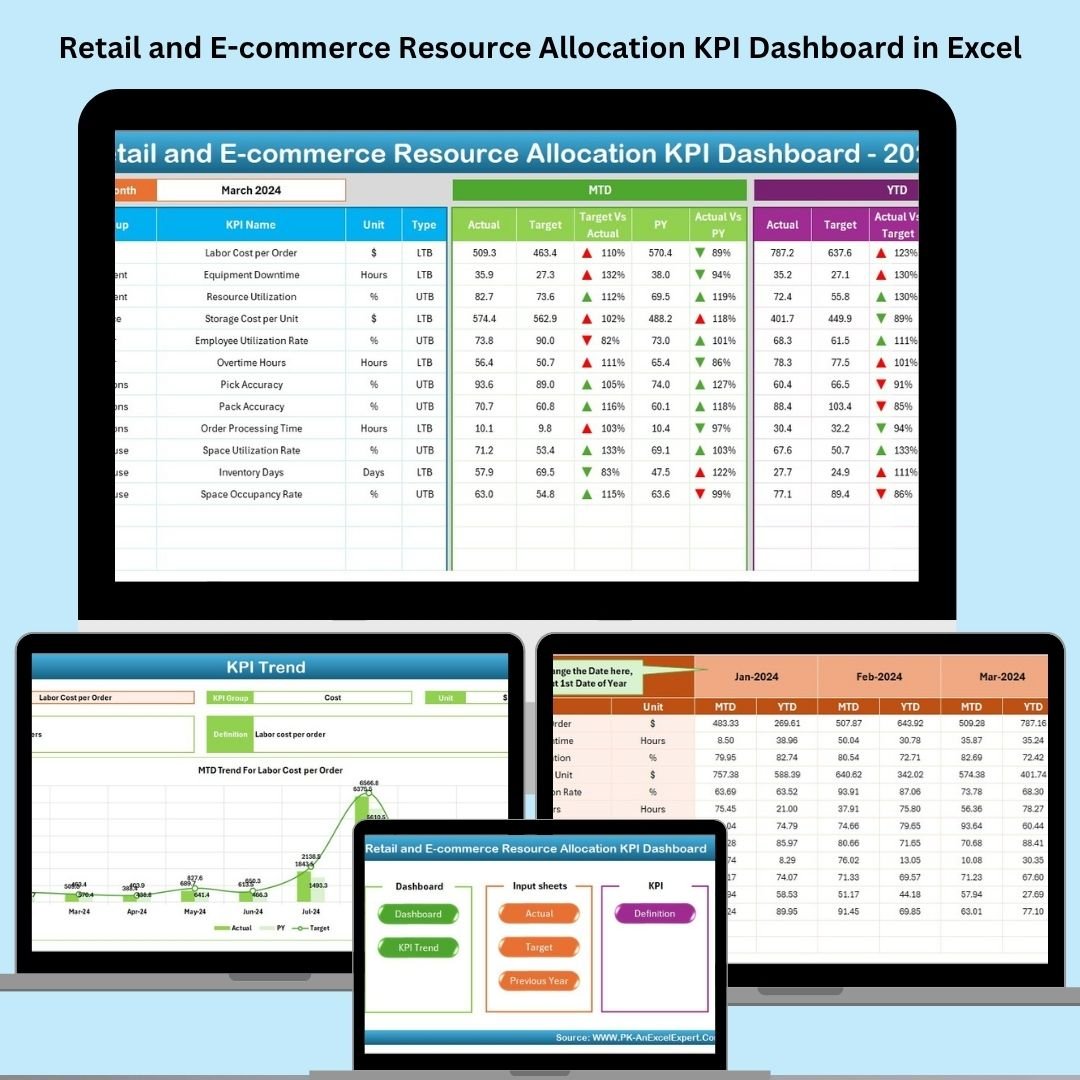
Maximize your resource efficiency and unlock real-time performance insights with our Retail and E-commerce Resource Allocation KPI Dashboard — a powerful, ready-to-use Excel template designed for retail managers, ecommerce analysts, and business leaders.
Whether you’re overseeing in-store sales, digital campaigns, inventory levels, or workforce planning, this Excel dashboard gives you the clarity to make fast, data-driven decisions. No subscriptions. No steep learning curve. Just streamlined analysis that adapts to your strategy.
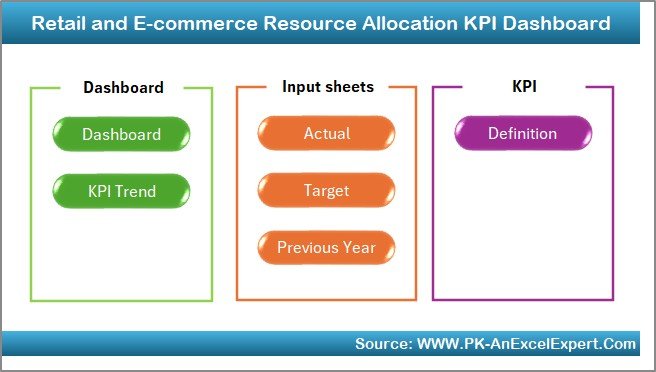
🧩 What’s Included in the Dashboard?
1️⃣ Home Sheet – Navigation Hub
-
Central landing page with 6 quick-access buttons to all major tabs
-
Helps users navigate the workbook without searching through sheets
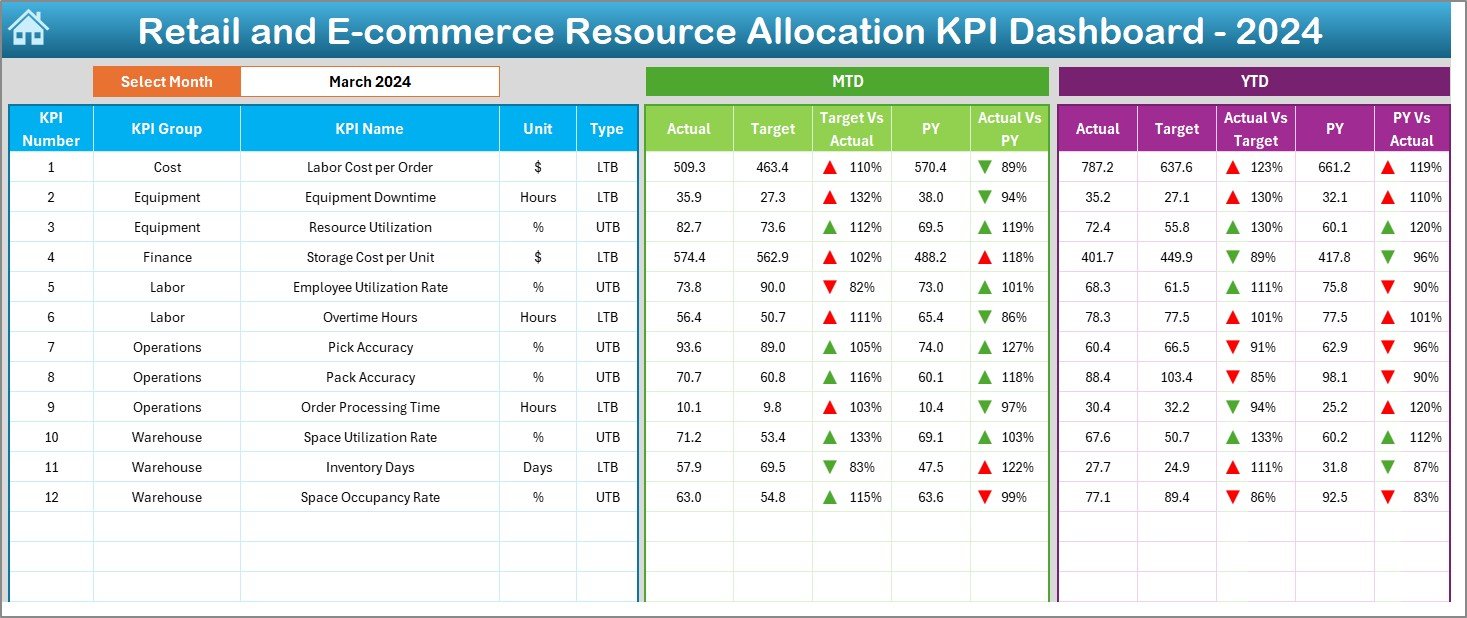
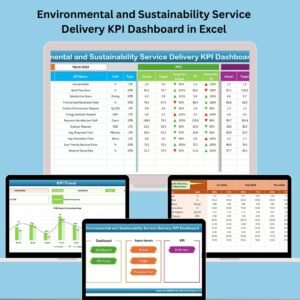
2️⃣ Dashboard Sheet – Month-to-Date & YTD Overview
-
Drop-down month selector (Cell D3): Instantly updates all metrics
-
Tracks:
-
MTD Actual vs. Target vs. PY
-
YTD Actual vs. Target vs. PY
-
-
Green/red arrow indicators show performance trends
-
Ideal for spotting real-time gaps and wins
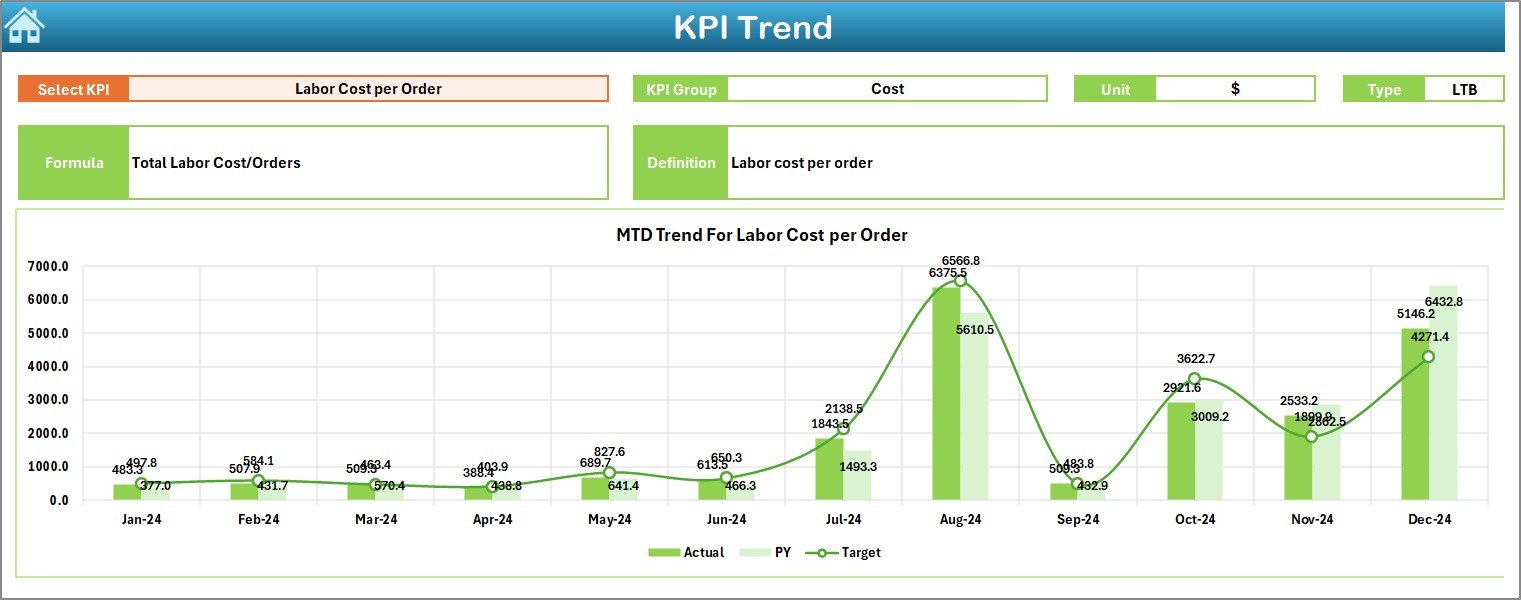
3️⃣ KPI Trend Sheet – Visual Trends Over Time
-
Choose any KPI (Cell C3) and see:
-
KPI Type (LTB or UTB)
-
Group (e.g., Inventory, Labor)
-
Unit, Formula & Definition
-
Dual line charts: MTD + YTD actual vs. target vs. PY
-
-
Clean, isolated visualization for each KPI
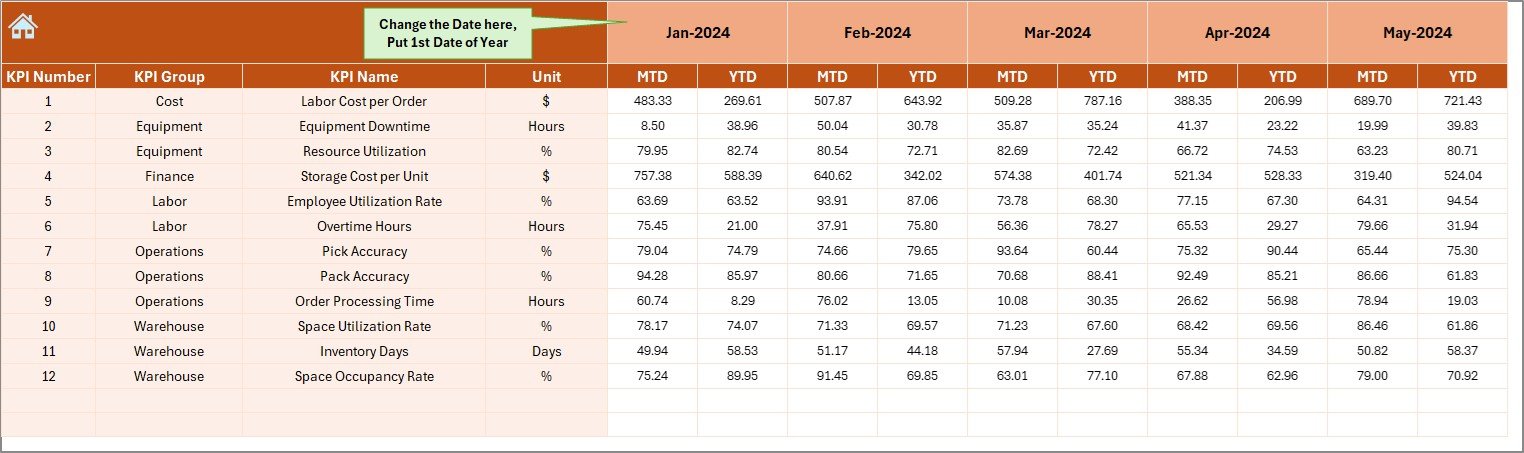
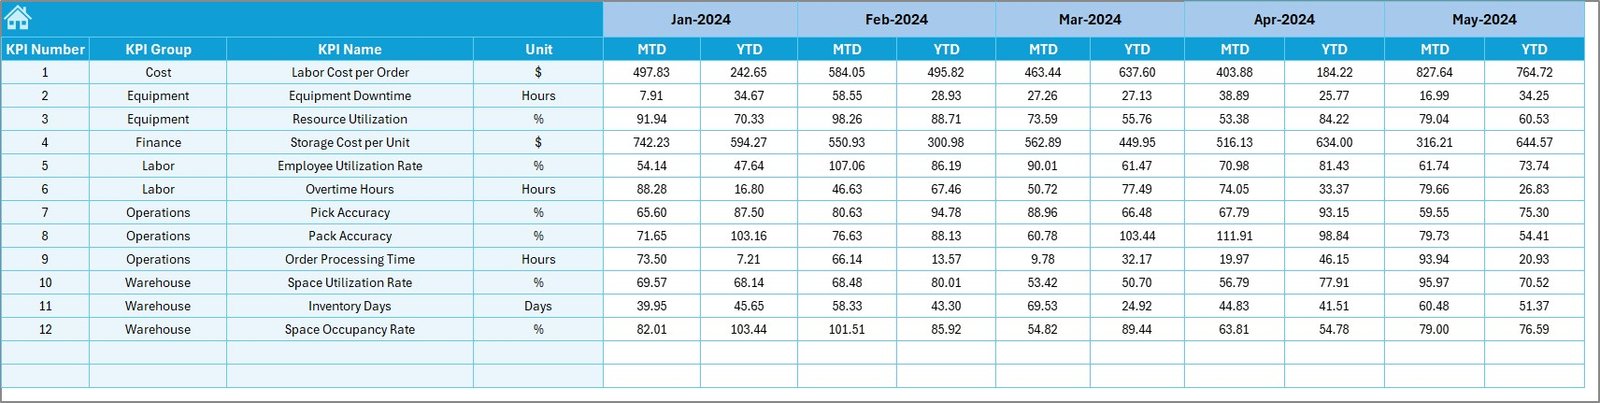
4️⃣ Actual Numbers Input Sheet
-
Set Fiscal Start Month (Cell E1)
-
Record monthly MTD and YTD values per KPI
-
Clean separation of data and formulas
5️⃣ Target Sheet
-
Enter monthly and YTD targets for each KPI
-
Easily track progress toward defined goals
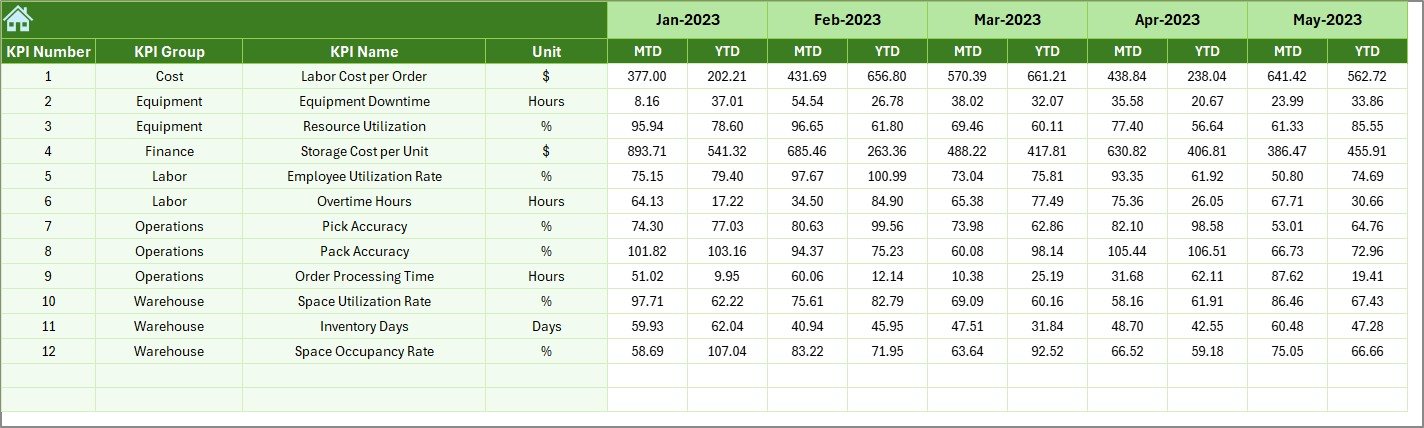
6️⃣ Previous Year Numbers Sheet
-
Record historical data from the previous year
-
Enables YoY performance comparisons
-
Great for benchmarking trends and seasonal shifts
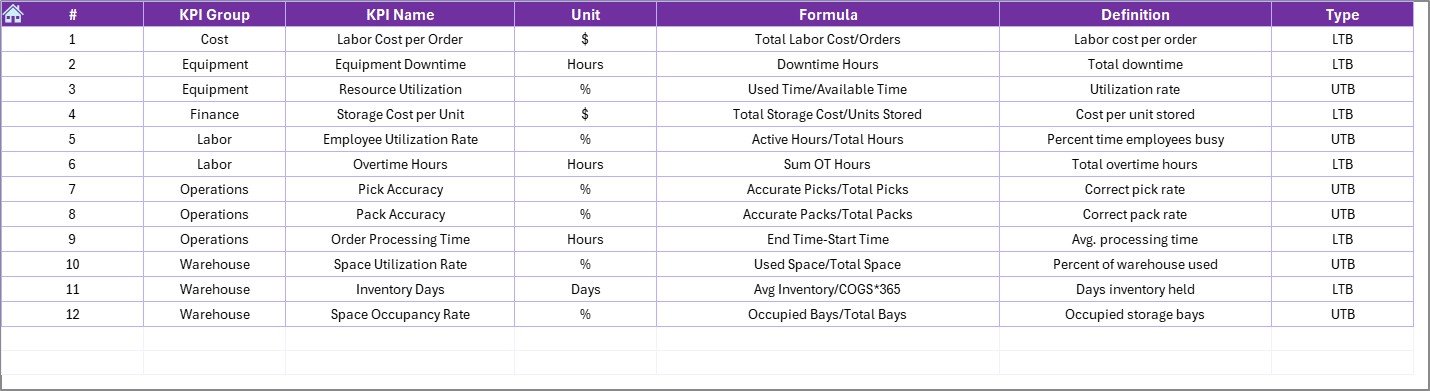
7️⃣ KPI Definition Sheet
-
Maintain clarity across teams with:
-
KPI Name
-
Group (e.g., Fulfillment, Marketing)
-
Unit
-
Formula
-
Short Definition
-
-
Keeps your dashboard consistent and transparent
💼 Who Should Use This?
-
Retail & E-commerce Business Owners
-
Operations Managers
-
Marketing Teams
-
Financial Analysts
-
Supply Chain Managers
🔍 What Can You Track?
📦 Inventory Utilization
📈 Marketing ROI
👨💼 Staff Allocation Efficiency
🕒 Order Fulfillment Time
💵 Channel Cost Per Acquisition
🎯 Sales per Resource Unit
And many more…
⚙️ Key Benefits
✅ Real-Time Visibility
Quickly compare actual performance against targets and previous year’s figures.
✅ Excel-Native Solution
No add-ins or external software required. Works seamlessly with Excel 2016 and above.
✅ Customizable & Scalable
Easily add KPIs, adjust chart styles, or integrate with Power Query / Power BI.
✅ Drop-Down Driven Navigation
Interactive selectors let users drill down without technical skills.
✅ Collaborative Ready
Use via OneDrive, SharePoint, or Excel Web for team-wide access and updates.
🛠️ Best Practices for Use
-
Set realistic targets based on past performance and upcoming goals
-
Assign ownership for data inputs—ensure accuracy and timeliness
-
Lock formula cells and use data validation to prevent errors
-
Save a snapshot each month for long-term performance tracking
-
Use conditional alerts for quick attention to critical metrics (e.g., low conversions)
📈 How to Customize the Dashboard
-
Add New KPI – Update KPI Definition sheet and input sheets
-
Change Fiscal Start – Adjust E1 in Actual Numbers sheet
-
Modify Visuals – Use Excel’s Chart Design tab
-
Automate Inputs – Connect your ERP or CRM via Power Query
-
Filter by Channel – Add slicers or segment KPIs by in-store vs. online
🎥 Need Help Getting Started?
📺 Visit our YouTube channel for tutorials, demos, and Excel tips
👉 youtube.com/@PKAnExcelExpert


Reviews
There are no reviews yet.