Managing a religious or faith-based organization involves far more than hosting weekly services. Leaders must track donations, attendance, spiritual programs, volunteer activities, outreach events, and community engagement — all while ensuring transparency and accountability. However, when this information is scattered across multiple files, notebooks, and volunteer logs, decision-making becomes slow and unclear.
The Religious & Faith-Based Organizations KPI Dashboard in Excel solves these challenges by bringing every important KPI into one interactive, automated, and easy-to-use dashboard. Built for temples, churches, mosques, spiritual centers, nonprofits, and faith-based ministries, this dashboard helps leaders view performance insights instantly and manage their mission more effectively.
Whether you’re tracking worship attendance, donation trends, new members, event participation, community outreach, or volunteer hours — this Excel dashboard gives you clear, visual, month-by-month insights that support growth and stronger community impact.
✨ Key Features of the Religious & Faith-Based Organizations KPI Dashboard in Excel
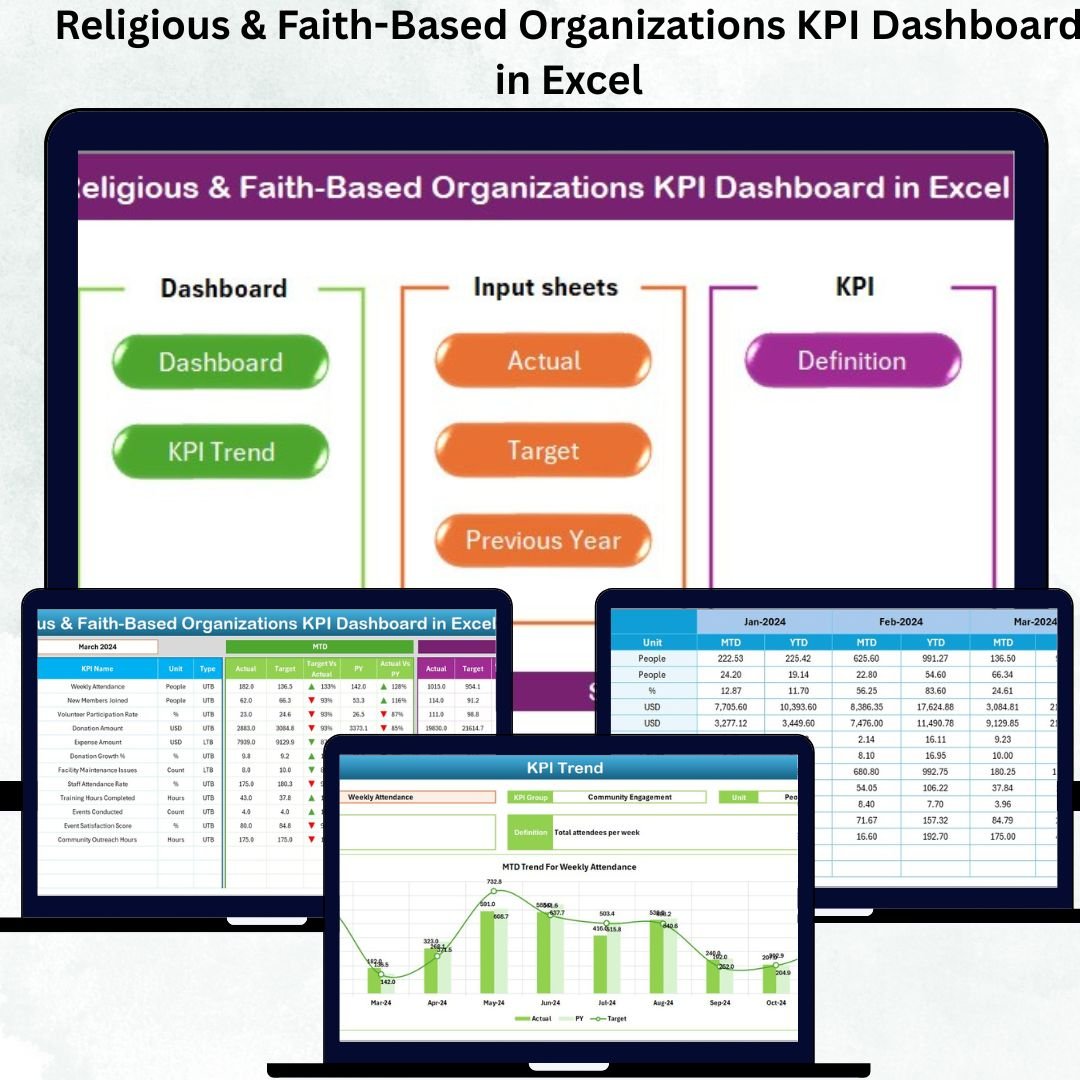
This dashboard is designed to feel like a complete application inside Excel. With seven organized worksheets and interactive visuals, it ensures smooth navigation and effortless reporting for administrators, volunteers, and leadership teams.
📌 Central Summary Page
The Summary Page works like the dashboard’s home screen. It includes six quick-access navigation buttons that instantly take you to:
-
Dashboard
-
Trend Analysis
-
Actual Input
-
Target Input
-
Previous Year Numbers
-
KPI Definition
This eliminates the need to scroll through tabs and makes the file user-friendly for everyone.
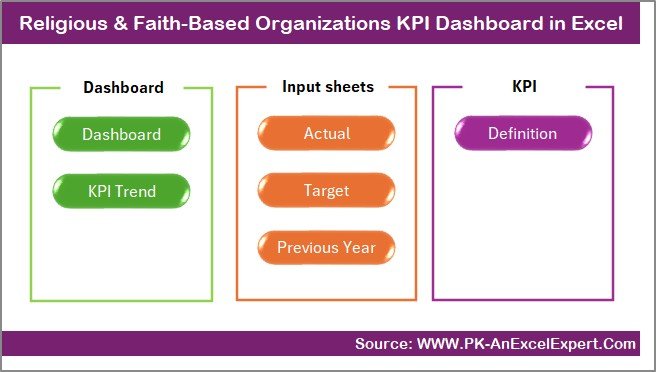
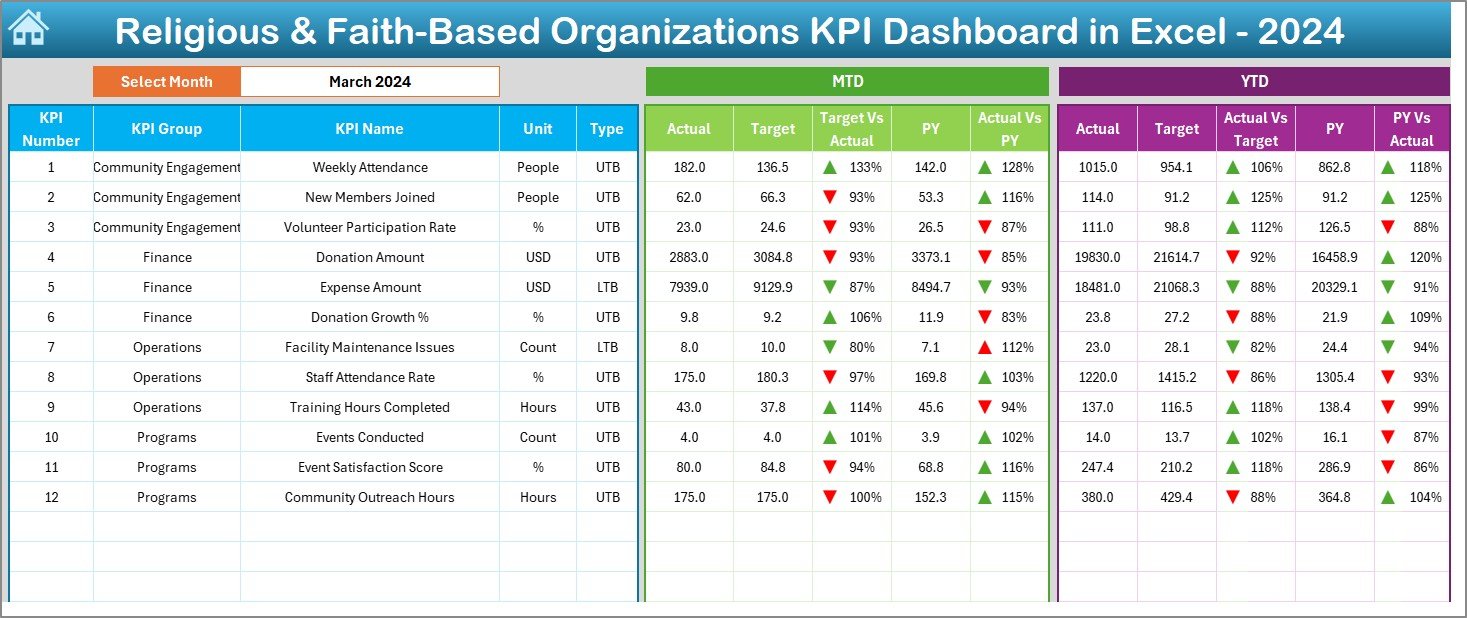
📊 Powerful Dashboard Page
The Dashboard page is the heartbeat of this tool. With a month selector in cell D3, all visuals refresh instantly to show:
-
MTD Actual / Target / Previous Year
-
YTD Actual / Target / Previous Year
-
Performance arrows (up/down) showing improvement or decline
-
Clear KPIs grouped logically for fast interpretation
Leaders can assess progress in seconds without reading long tables.
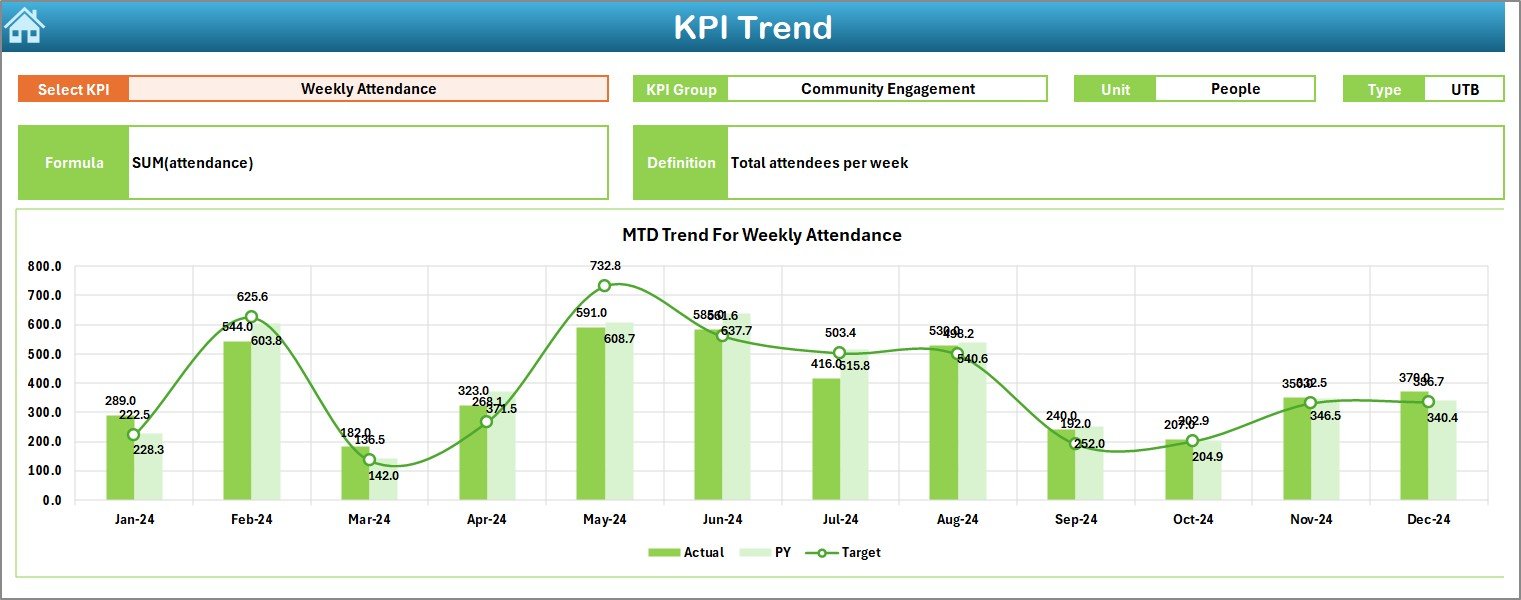
📈 Trend Analysis Sheet
Every KPI tells a story. This sheet helps you:
-
Choose any KPI from a drop-down
-
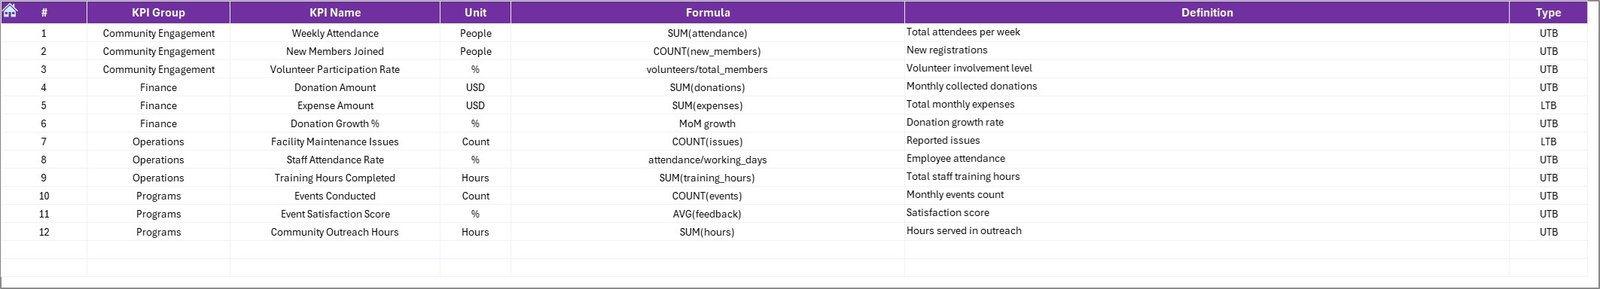
View its Group, Unit, Type (UTB/LTB), Formula & Definition
-
Analyze monthly and yearly trend charts
-
Compare Actual vs Target vs Previous Year
This page is essential for understanding long-term performance.
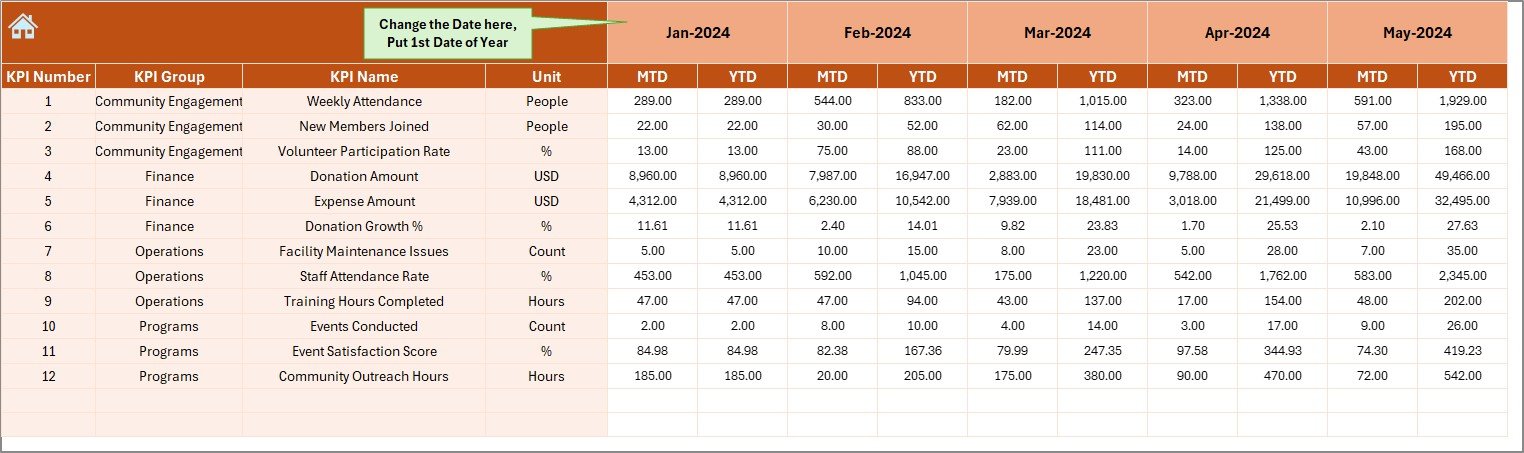
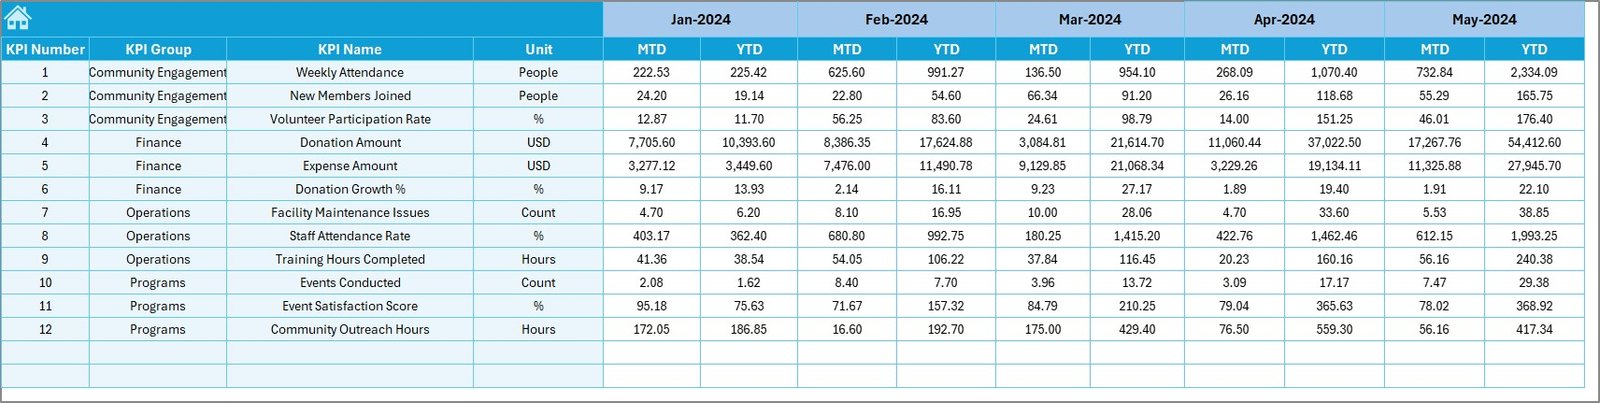
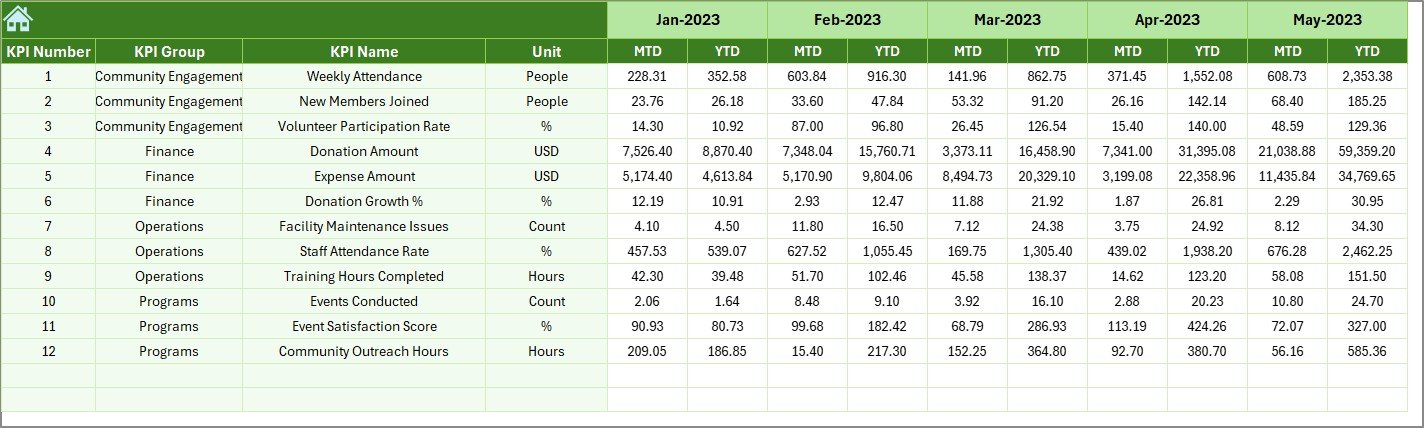
📝 Data Entry Sheets (Actual, Target, Previous Year)
All three data sheets are designed for simplicity:
-
Enter Actual MTD & YTD numbers
-
Enter Target MTD & YTD numbers
-
Enter Previous Year MTD & YTD numbers
Once data is updated, the dashboard auto-refreshes — no formulas or manual calculations required.
📚 KPI Definition Sheet
This sheet documents every KPI clearly. It helps volunteers and staff understand what each metric means, how it’s measured, and how it impacts organizational goals.
📦 What’s Inside the Religious & Faith-Based Organizations KPI Dashboard in Excel
This ready-to-use template includes everything your organization needs for structured performance reporting:
-
✔️ Fully automated Excel dashboard
-
✔️ Month selector for dynamic views
-
✔️ KPI Trend Analysis page
-
✔️ Actual, Target & Previous Year input sheets
-
✔️ KPI Definition sheet with editable fields
-
✔️ Prebuilt formulas for comparison logic
-
✔️ Conditional formatting with visual arrows
-
✔️ Clean, professional layout
-
✔️ Editable & customizable as per your mission’s needs
You receive a complete reporting system that eliminates manual work and enables smarter decisions.
🛠️ How to Use the Religious & Faith-Based Organizations KPI Dashboard in Excel
Using this dashboard is incredibly simple — even for users with basic Excel skills.
Step 1: Enter Your Actual Data
Go to the Actual Input sheet and update your MTD & YTD numbers for each month.
Step 2: Enter Your Target Values
Update the Target sheet with your planned values for each KPI. This helps you compare planned vs actual performance.
Step 3: Add Previous Year Numbers
Enter last year’s MTD & YTD values to analyze year-over-year performance.
Step 4: Select the Month
On the Dashboard page, use the drop-down in cell D3 to see instant updates.
Step 5: Analyze KPI Trends
Visit the Trend sheet to explore long-term performance for each KPI.
Within minutes, you get complete clarity across all programs, services, and community initiatives.
🎯 Who Can Benefit from This Religious & Faith-Based Organizations KPI Dashboard?
This dashboard is ideal for:
-
Temples & Churches looking to manage attendance, donations & events
-
Mosques & Spiritual Centers tracking community engagement
-
Faith-Based Nonprofits measuring outreach performance
-
Ministry Teams monitoring youth programs & spiritual activities
-
Community Organizations evaluating volunteer and event participation
-
Administrative Staff preparing reports for leaders and committees
-
Fundraising Teams analyzing donation trends for campaigns
If your organization wants clarity, transparency, and data-driven insights, this dashboard is the perfect solution.
Click here to read the Detailed blog post
Watch the step-by-step video tutorial:


Reviews
There are no reviews yet.