Managing refinery projects without clear visibility often leads to cost overruns, safety risks, and missed deadlines. Refinery projects involve high capital investment, multiple departments, strict safety requirements, and constant monitoring. When project data is scattered across spreadsheets, emails, and static reports, decision-makers lose control and react too late.
That is exactly why the Refinery Project Management Dashboard in Power BI is a powerful and essential solution. 🚀
This professionally designed Power BI dashboard converts complex refinery project data into clear KPIs, interactive visuals, and real-time insights. As a result, project teams gain full visibility into budgets, costs, safety impact, progress status, and trends — all from one centralized dashboard.
Built for large-scale industrial environments, this dashboard helps refinery operators, EPC contractors, and leadership teams manage projects proactively instead of reactively.
Key Features of Refinery Project Management Dashboard in Power BI 🔑
📊 Centralized Project Visibility
Track all refinery projects from a single dashboard with complete transparency.
📈 Real-Time KPI Monitoring
Instantly view In-Progress Project %, High Safety Impact Projects, Planned Budget, and Actual Cost.
🧭 Interactive Slicers & Filters
Analyze projects by refinery location, department, project manager, project type, or time period.
📉 Department & Manager Performance Insights
Identify departments and project managers driving cost overruns or delays.
📅 Monthly Trend Analysis
Track budget movement, cost patterns, and workload trends over time.
⚡ Faster Decision-Making
Visual insights help leadership identify risks and take action early.
💼 Executive & Audit-Ready Reporting
Perfect for project reviews, safety assessments, and management reporting.
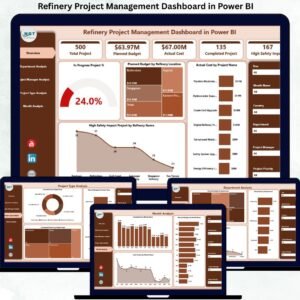
What’s Inside the Refinery Project Management Dashboard in Power BI 📁
This ready-to-use Power BI solution includes five professionally structured analytical pages, each answering a critical project management question.
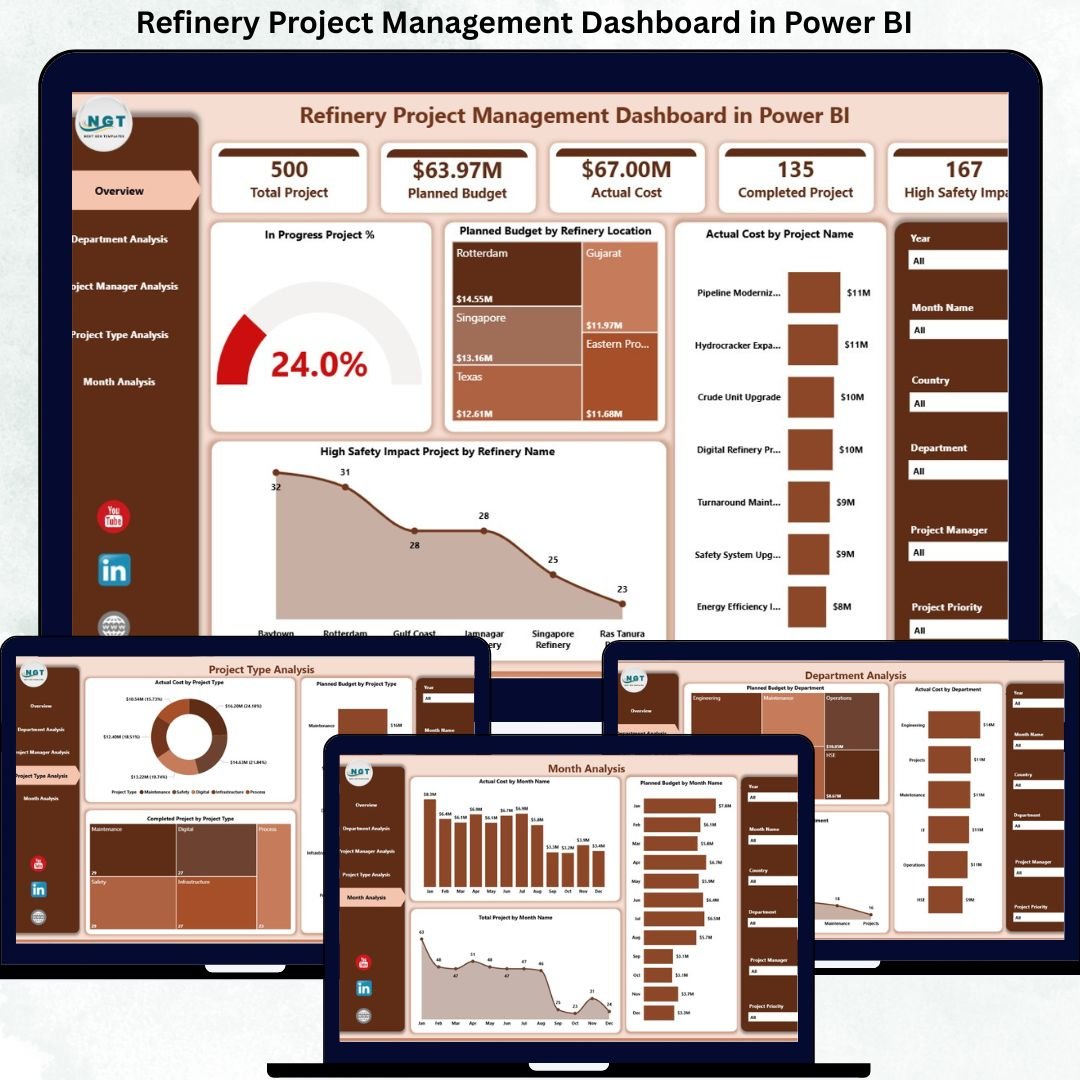
📄 Overview Page
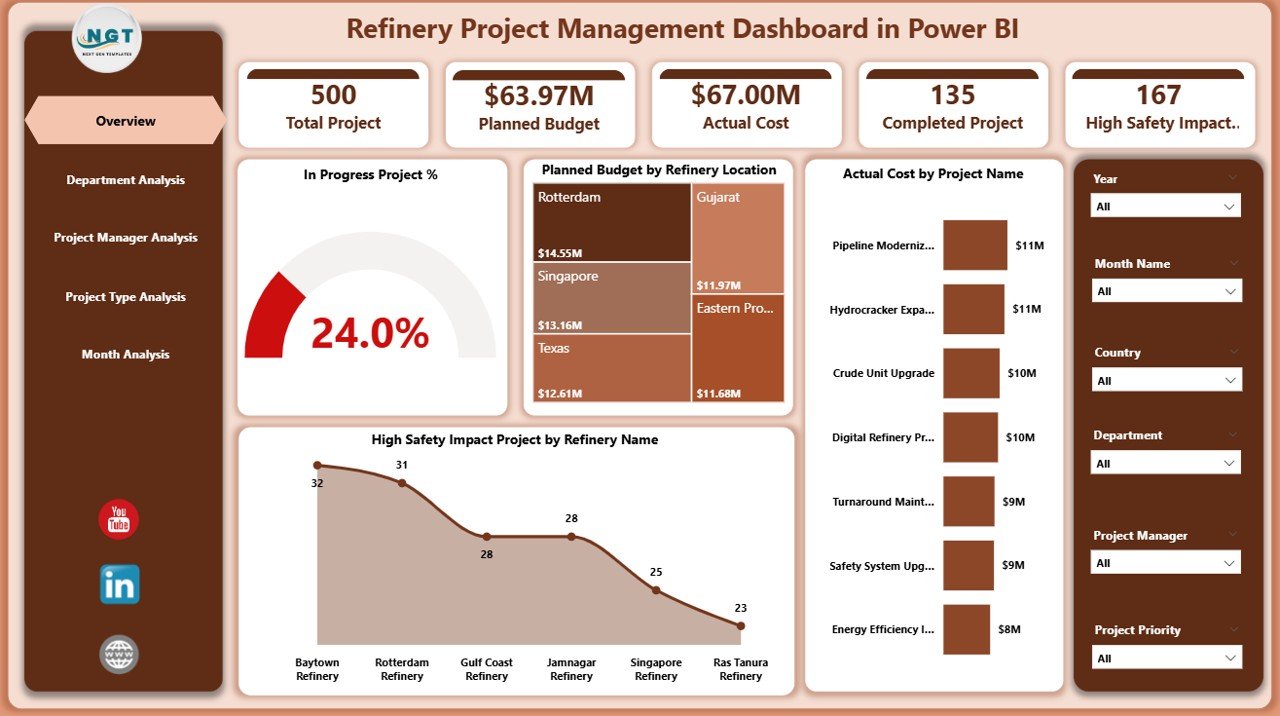
Provides a complete snapshot of all refinery projects using KPI cards and charts such as:
-
In-Progress Project %
-
High Safety Impact Projects
-
Planned Budget by Refinery Location
-
Actual Cost by Project Name
This page acts as the executive control center for quick reviews.
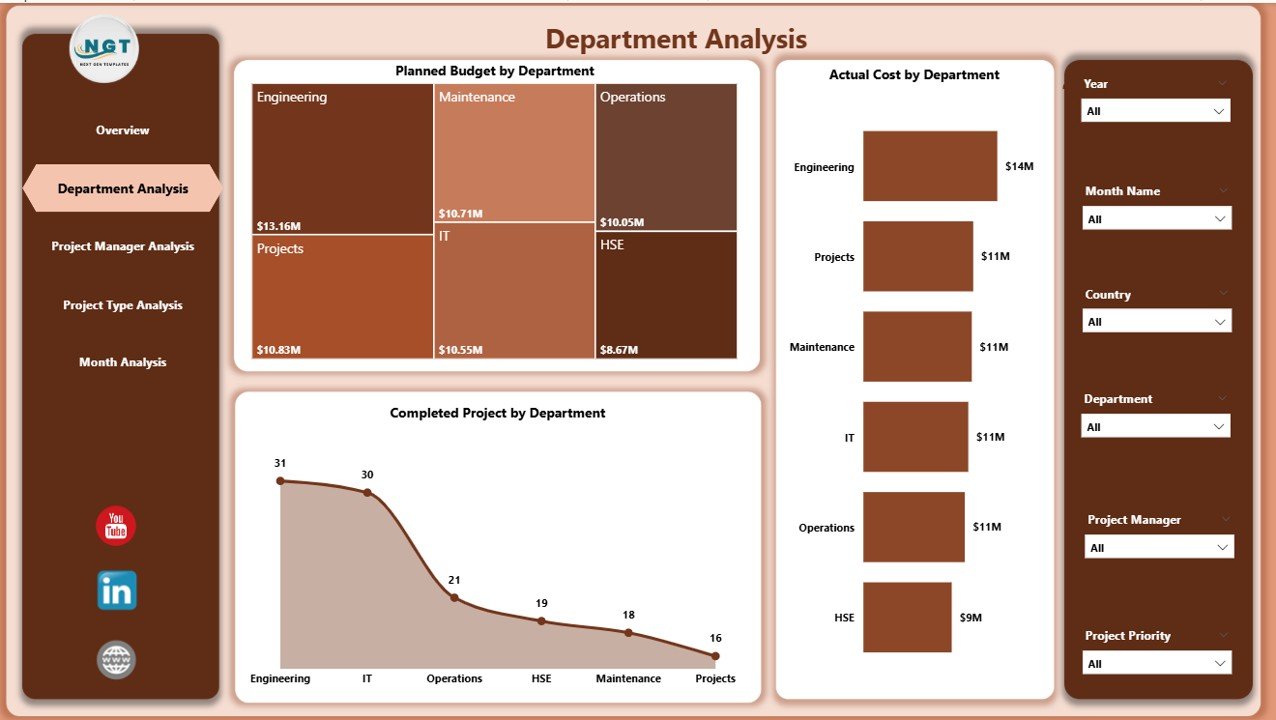
📄 Department Analysis Page
Evaluates department-wise project performance using:
-
Planned Budget by Department
-
Actual Cost by Department
-
Completed Projects by Department
Helps identify departments with budget or delivery challenges.
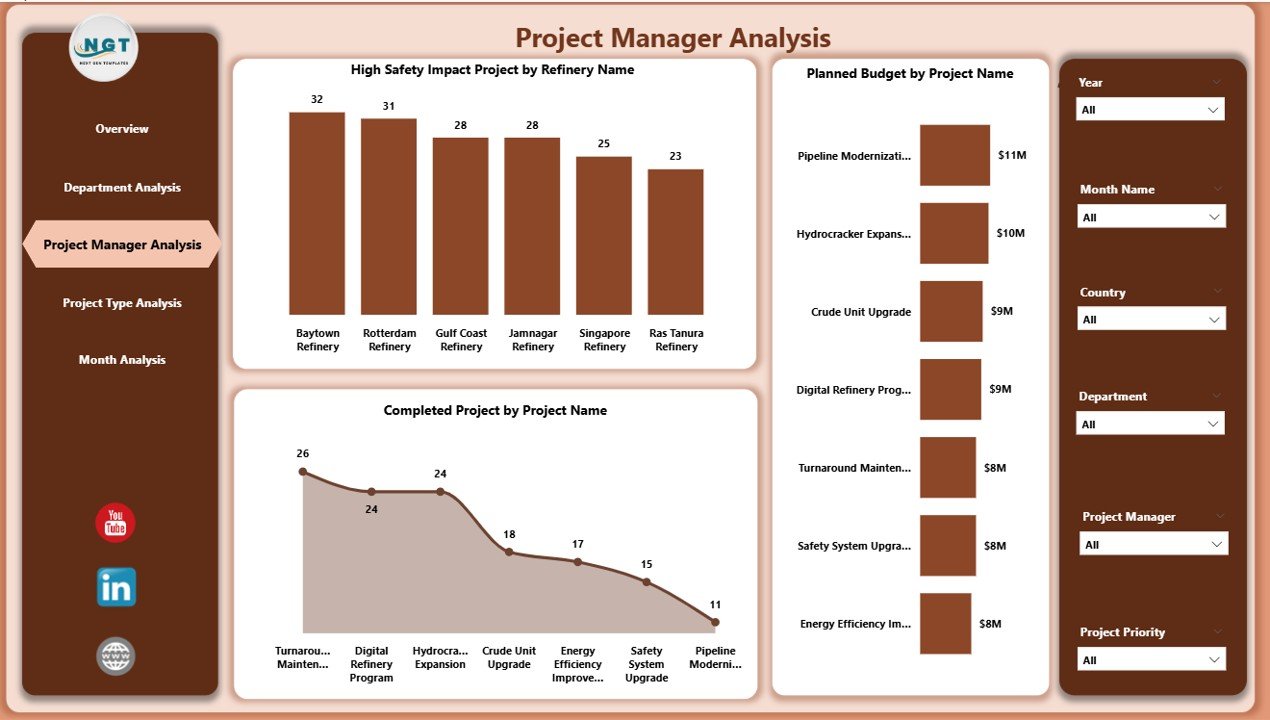
📄 Project Manager Analysis Page
Tracks individual project manager performance through:
-
Completed Projects by Project Manager
-
High Safety Impact Projects
-
Planned Budget Responsibility
Supports accountability and performance benchmarking.
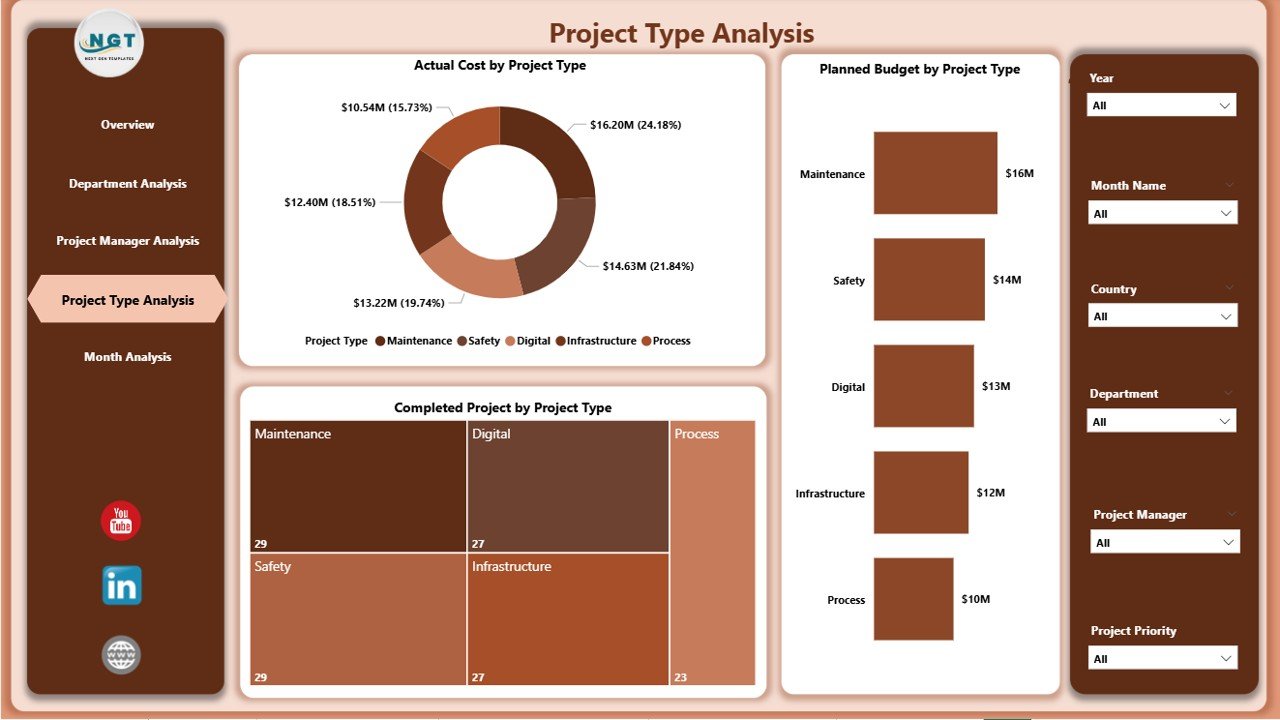
📄 Project Type Analysis Page
Analyzes different project categories using:
-
Actual Cost by Project Type
-
Planned Budget by Project Type
-
Completed Projects by Project Type
Helps refine investment strategy across project types.
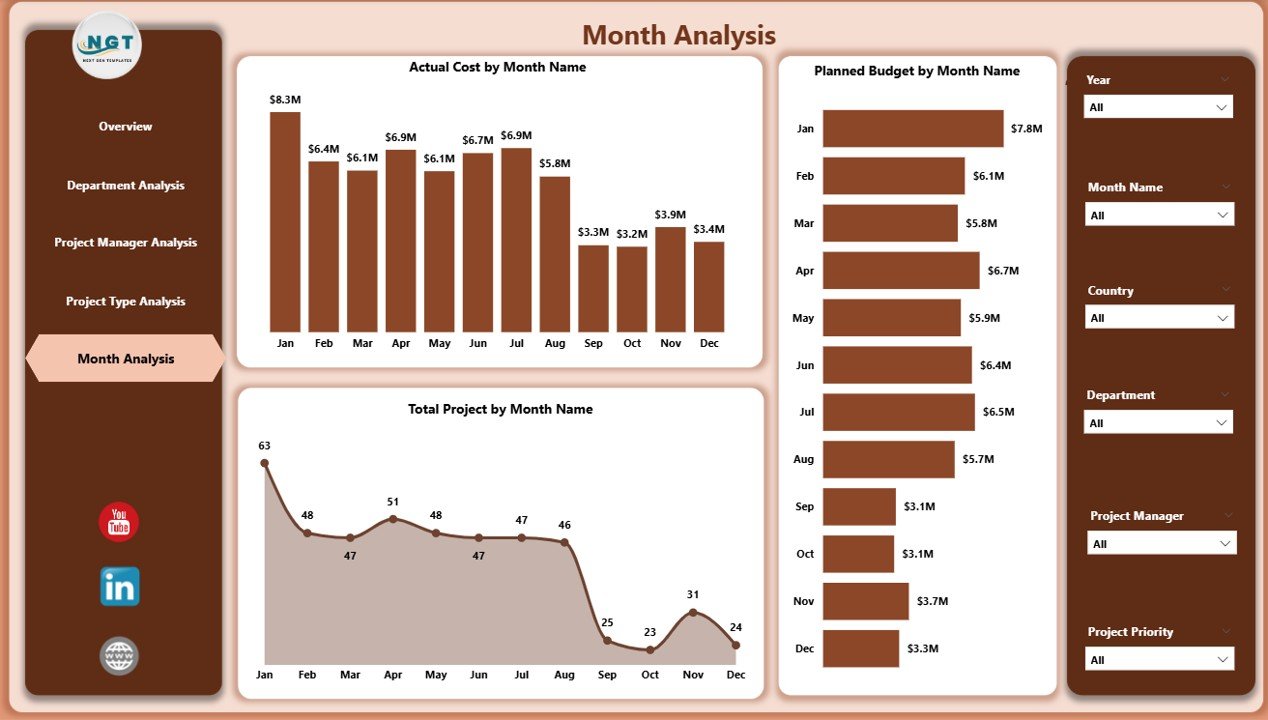
📄 Monthly Trends Page
Shows time-based insights using:
-
Actual Cost by Month
-
Planned Budget by Month
-
Total Projects by Month
Supports forecasting, budgeting, and seasonal planning.
All pages include slicers for fast and focused analysis.
How to Use the Refinery Project Management Dashboard in Power BI 🛠️
1️⃣ Load project data from Excel or connected systems
2️⃣ Refresh the Power BI dashboard
3️⃣ Use slicers to filter by refinery, department, or project manager
4️⃣ Review KPIs, safety indicators, and cost trends
5️⃣ Use insights for planning, reviews, and corrective actions
No advanced technical knowledge is required. The dashboard is intuitive and easy to use.
Who Can Benefit from This Refinery Project Management Dashboard 👥
🏭 Refinery Project Managers – Track progress and risks clearly
📊 Department Heads – Monitor budgets and delivery performance
⚠️ Safety Officers – Identify high-risk projects early
💰 Finance Teams – Control project spending
👔 Executive Leadership – Make confident, data-driven decisions
Ideal for both single-refinery and multi-location project environments.


Reviews
There are no reviews yet.