
Radiology and imaging departments generate massive volumes of clinical, operational, and financial data every single day. However, when this data is scattered across multiple spreadsheets and manual reports, performance tracking becomes slow, unclear, and error-prone.
That is where the Radiology & Imaging KPI Dashboard in Excel becomes a game-changer 🚀.
This ready-to-use Excel dashboard transforms raw radiology data into clear KPIs, dynamic visuals, and actionable insights. Instead of spending hours preparing reports, hospitals and diagnostic centers can instantly monitor performance, compare targets, and identify improvement areas—all in one powerful Excel file.
Designed with simplicity and usability in mind, this dashboard works 100% inside Excel, making it affordable, flexible, and easy to adopt without any advanced BI tools.
⭐ Key Features of Radiology & Imaging KPI Dashboard in Excel
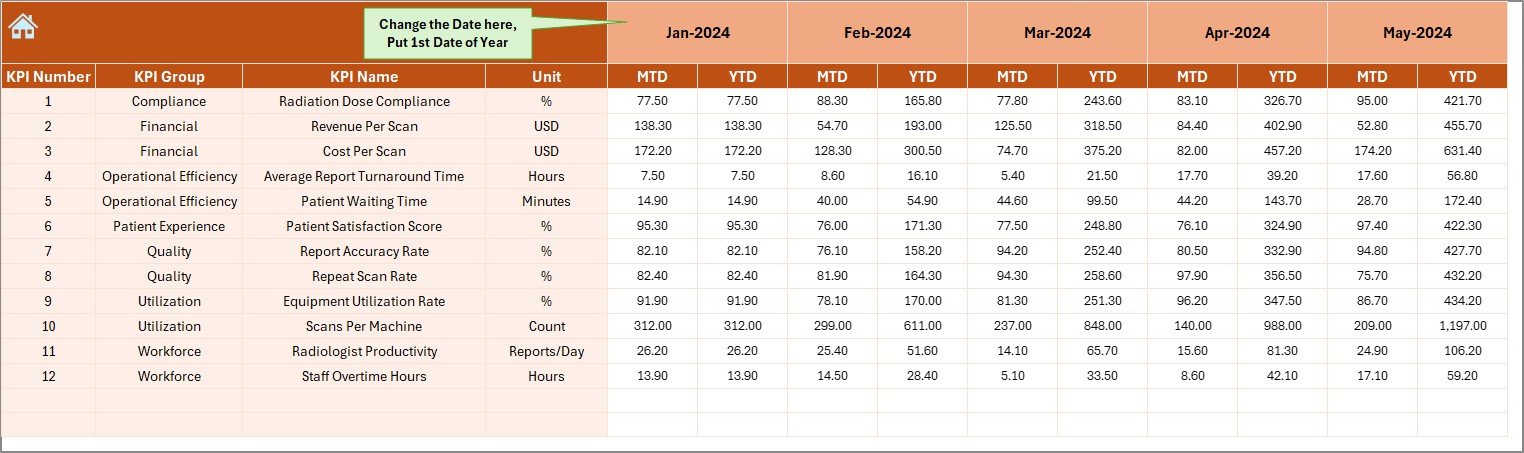
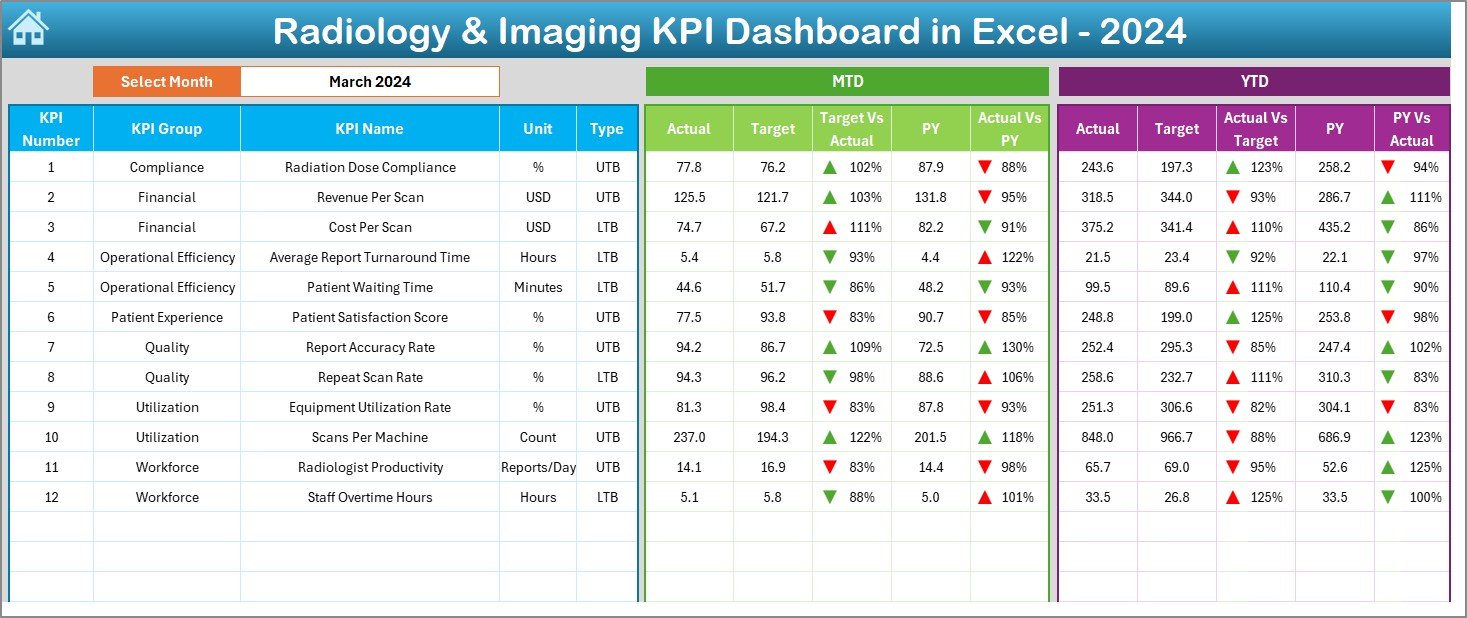
📅 Dynamic Month Selection – Change the reporting month using a simple dropdown and watch the entire dashboard update instantly.
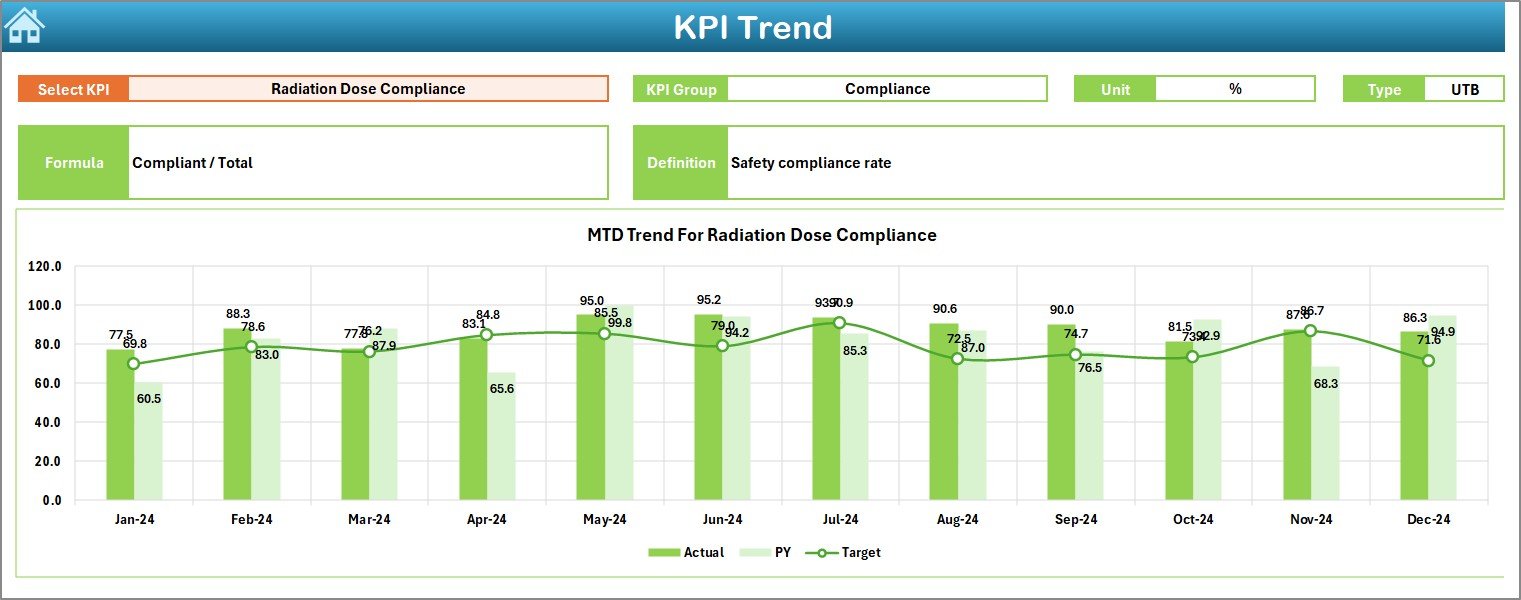
📈 MTD & YTD Analysis – Track short-term performance and long-term trends side by side.
🎯 Target vs Actual Comparison – Instantly identify gaps using variance analysis.
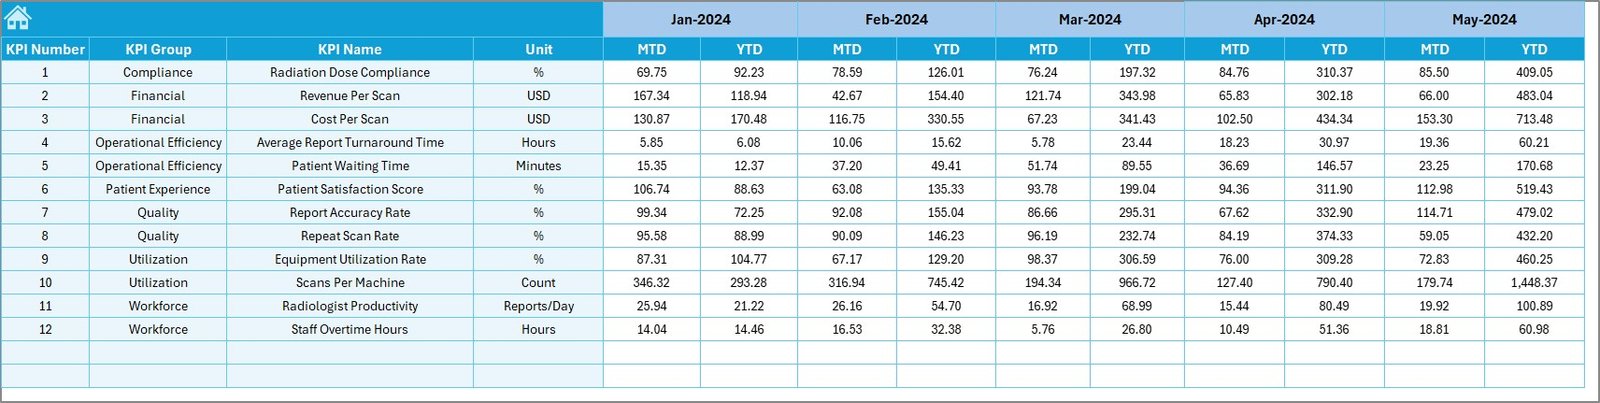
📊 Previous Year Comparison – Measure growth, decline, and consistency with YoY insights.
🚦 Smart Conditional Formatting – Visual up/down arrows highlight performance trends at a glance.
🧭 Easy Navigation Panel – Jump between dashboard pages using one-click buttons.
📌 Centralized KPI Governance – Clearly defined KPIs ensure consistency and transparency.
📦 What’s Inside the Radiology & Imaging KPI Dashboard in Excel
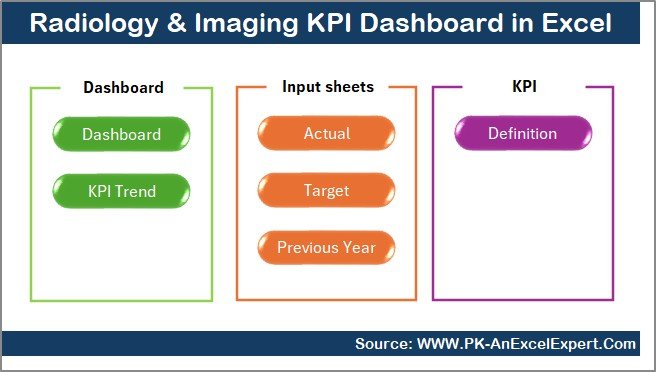
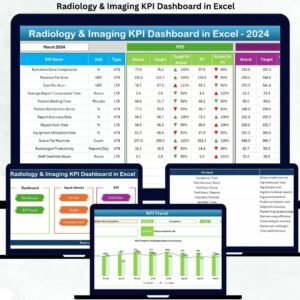
This digital product includes 7 professionally designed Excel worksheets, each serving a specific analytical purpose:
📍 Summary Page – Acts as a navigation hub with quick-access buttons to all sheets.
📍 Dashboard Sheet – The main performance view showing MTD & YTD Actuals, Targets, and Previous Year values with visual indicators.
📍 Trend Sheet – Deep KPI-level analysis with interactive dropdowns and trend charts.
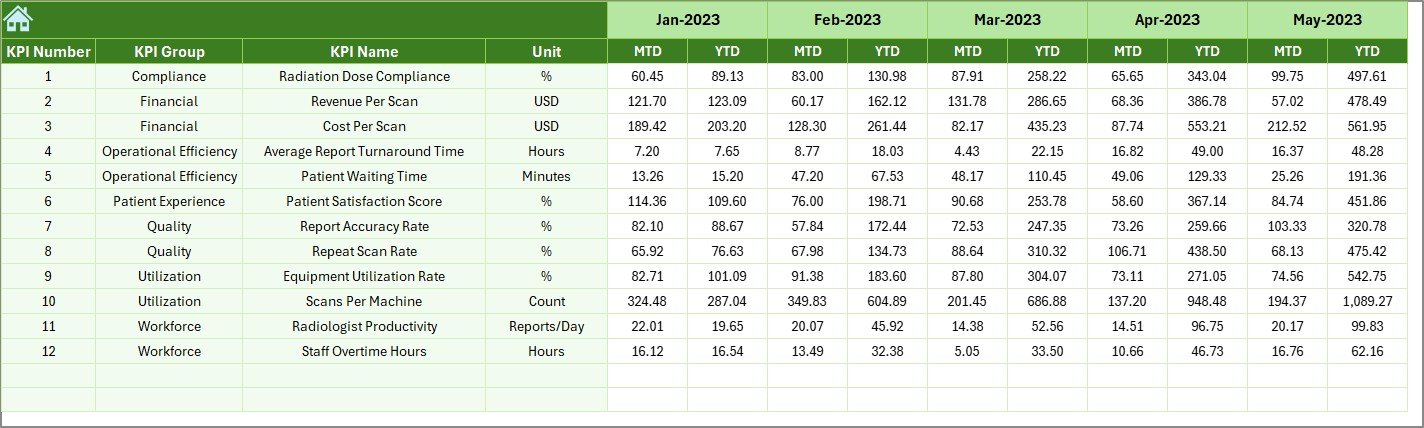
📍 Actual Numbers Input Sheet – Structured entry for real MTD and YTD performance data.
📍 Target Sheet – Define monthly and cumulative targets for each KPI.
📍 Previous Year Numbers Sheet – Capture historical data for YoY comparisons.
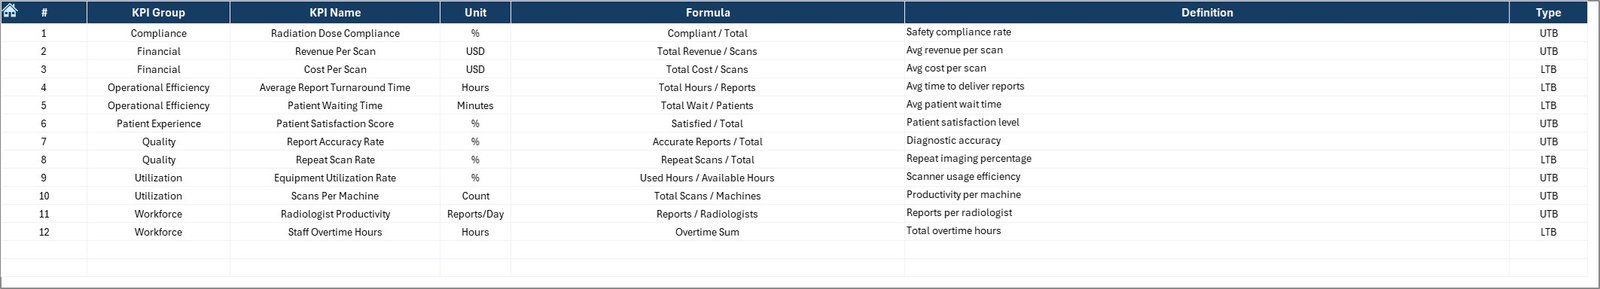
📍 KPI Definition Sheet – Document KPI name, group, unit, formula, and definition for governance and clarity.
🚀 How to Use the Radiology & Imaging KPI Dashboard in Excel
Using this dashboard is simple—even for non-technical users:
1️⃣ Enter actual performance data in the Actual Numbers sheet
2️⃣ Define monthly and yearly goals in the Target sheet
3️⃣ Add last year’s data in the Previous Year Numbers sheet
4️⃣ Select the reporting month from the dropdown
5️⃣ Instantly review KPIs, trends, and comparisons on the dashboard
No complex setup. No coding. Just plug, analyze, and decide ✅.
👥 Who Can Benefit from This Radiology & Imaging KPI Dashboard in Excel
🏥 Radiology Department Heads
📊 Hospital Administrators
🧪 Diagnostic Center Managers
📉 Healthcare Analysts
💰 Finance & Operations Teams
📋 Quality & Compliance Managers
Whether you manage a small imaging clinic or a multi-specialty hospital, this dashboard scales easily to your needs.
Click here to read the Detailed Blog Post
Watch the step-by-step video tutorial:


Reviews
There are no reviews yet.