
In today’s dynamic digital publishing environment, success depends on how well you track, analyze, and act on performance data. The Publishing Dashboard in Excel is a powerful, ready-to-use solution designed for publishers, editors, and content strategists who want to simplify their workflows and make smarter, data-driven decisions — all within the comfort of Microsoft Excel.
This fully interactive Excel dashboard centralizes your publishing data, transforming raw numbers into clear visuals and actionable insights. Whether you manage a media house, blog network, online magazine, or corporate publication, this tool helps you monitor KPIs like revenue, views, author productivity, publication rate, and platform performance — without needing any specialized BI software.
⚙️ Key Features of the Publishing Dashboard in Excel
📊 Five Analytical Pages + Support Sheet:
Includes Overview, Department Analysis, Category Analysis, Platform Analysis, and Monthly Trends — plus a data-driven Support Sheet to store all source information.
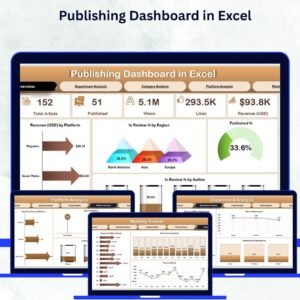
📈 Overview Page – The Control Center:

View top KPIs such as Total Revenue (USD), Total Views, In Review %, Published %, and Average Word Count. Dynamic charts highlight:
-
Revenue by Platform
-
In Review % by Region
-
Published % by Author
-
Overall Publishing Rate
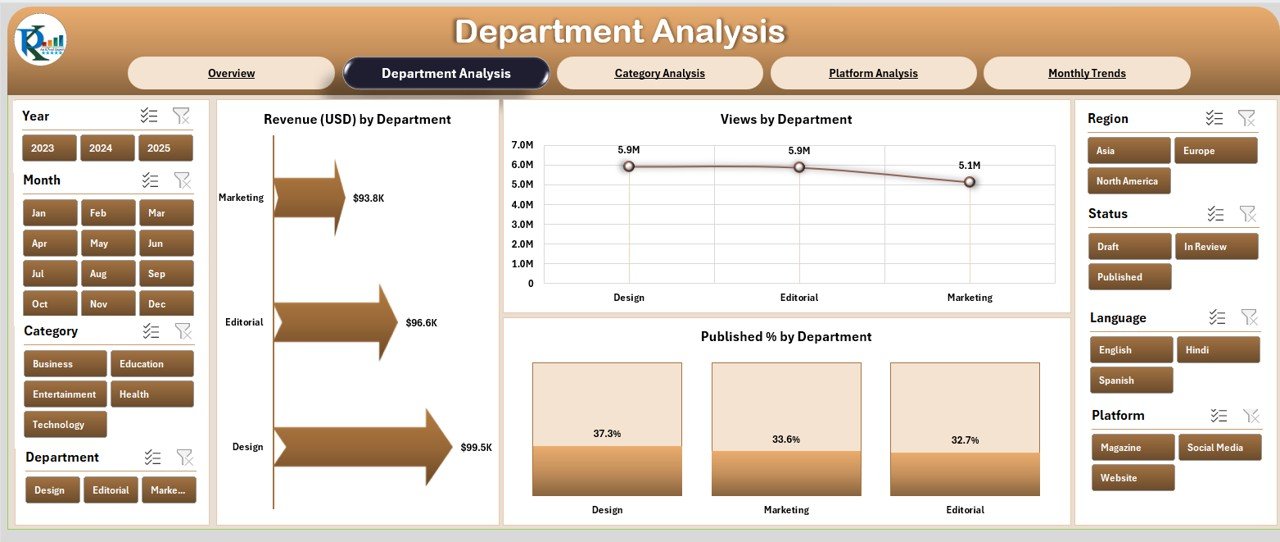
📑 Department Analysis Page:
Compare performance across teams — Editorial, Design, SEO, and Marketing. See Revenue, Views, and Published % by Department to assess contribution and productivity.
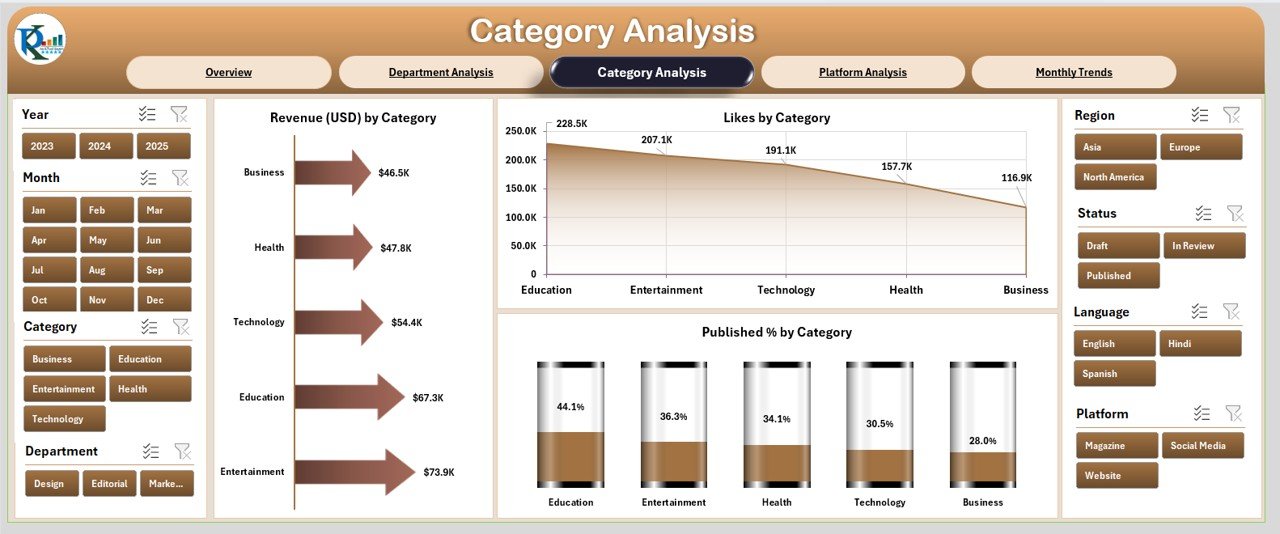
📚 Category Analysis Page:
Analyze how various content types perform with visuals like Revenue (USD) by Category, Likes by Category, and Published % by Category.
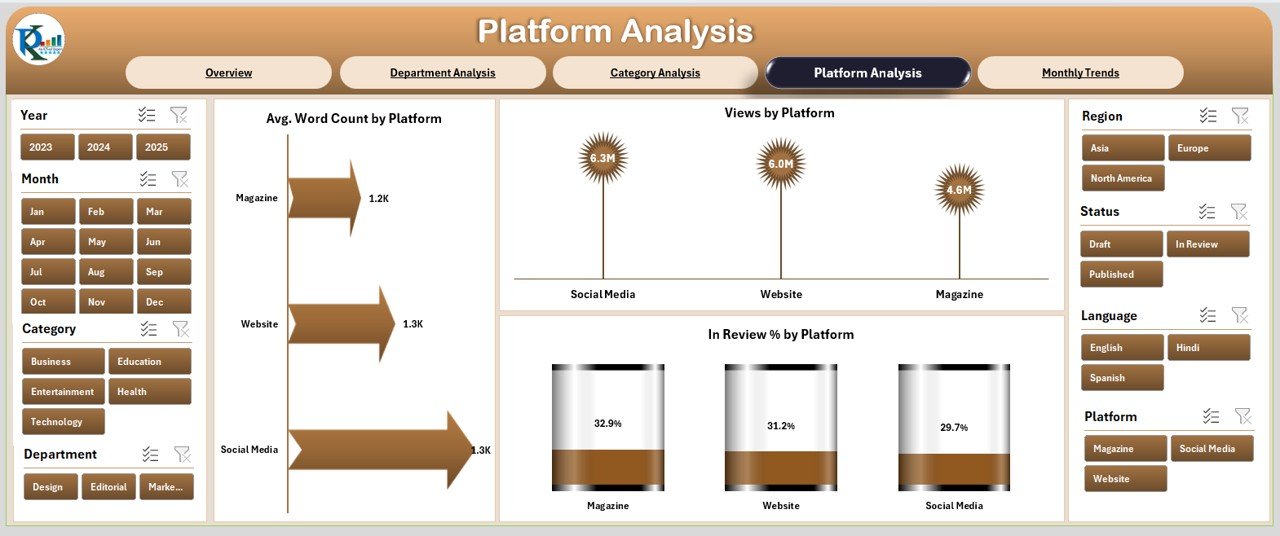
🌐 Platform Analysis Page:
Evaluate content performance across platforms (Website, Medium, WordPress, LinkedIn, Substack, etc.) using Average Word Count, Views, and In Review % by Platform.
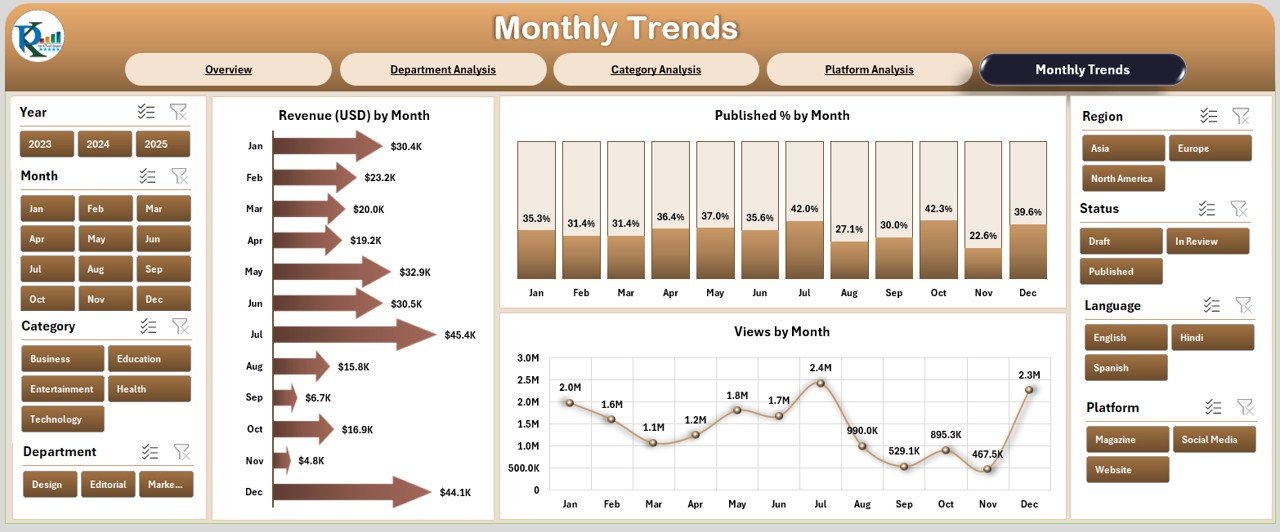
📆 Monthly Trends Page:
Discover seasonal performance with visuals like Revenue by Month, Published % by Month, and Views by Month. Spot high-performing periods instantly.
📊 Support Sheet (Data Backbone):
Stores all records such as publication date, author, department, platform, category, revenue, and views. Updating this sheet automatically refreshes all dashboard visuals.
💡 Interactive Filters & Slicers:
Filter data by Month, Platform, Region, or Department for precise analysis.
🎨 Clean and Professional Layout:
Designed with intuitive color coding, dynamic pivot charts, and clear navigation buttons for smooth page transitions.
📊 What’s Inside the Publishing Dashboard in Excel
1️⃣ Overview Page: High-level summary of key publishing KPIs and visual metrics.
2️⃣ Department Analysis Page: Team-wise breakdown of engagement and performance.
3️⃣ Category Analysis Page: Content-type analysis for strategy alignment.
4️⃣ Platform Analysis Page: Platform-level insights for multi-channel publishing.
5️⃣ Monthly Trends Page: Visual trend charts for performance tracking.
6️⃣ Support Sheet: Data hub that powers every chart and metric.
This structured design ensures scalability, automation, and transparency — empowering teams to make confident editorial and strategic decisions.
🧭 How to Use the Publishing Dashboard in Excel
✅ Step 1: Enter or import your publishing data into the Support Sheet.
✅ Step 2: Refresh pivot tables and slicers to update visuals automatically.
✅ Step 3: Navigate across pages using buttons or tabs.
✅ Step 4: Filter by Month, Platform, or Department to explore insights.
✅ Step 5: Review KPIs regularly to identify trends, bottlenecks, and growth areas.
Within minutes, your Excel file becomes a powerful business intelligence dashboard tailored to your publishing needs.
👥 Who Can Benefit from This Dashboard
📰 Digital Publishers: Monitor content reach, engagement, and revenue.
📈 Marketing Teams: Evaluate the ROI of campaigns and platforms.
✍️ Content Strategists: Identify top-performing categories and writers.
🏢 Corporate Communicators: Track newsletter and internal publication impact.
🎓 Educational Publishers: Assess content performance by subject or audience.
🤝 Freelance Agencies: Manage client deliverables and author productivity.
🌟 Advantages of the Publishing Dashboard in Excel
✅ Real-Time Tracking: Stay updated with live publishing metrics.
✅ Centralized Data Source: Access all KPIs in one Excel file.
✅ Simplified Reporting: Replace manual reports with automated visuals.
✅ Actionable Insights: Quickly identify trends and performance gaps.
✅ Collaboration Ready: Multiple users can update data simultaneously.
✅ Customizable Design: Add charts, change themes, or expand KPIs easily.
✅ Cost-Effective: Achieve advanced analytics using Excel — no extra software required.
🔗 Click here to read the Detailed Blog Post
🎥 Visit our YouTube channel for step-by-step tutorials
🔗 YouTube.com/@PKAnExcelExpert


Reviews
There are no reviews yet.