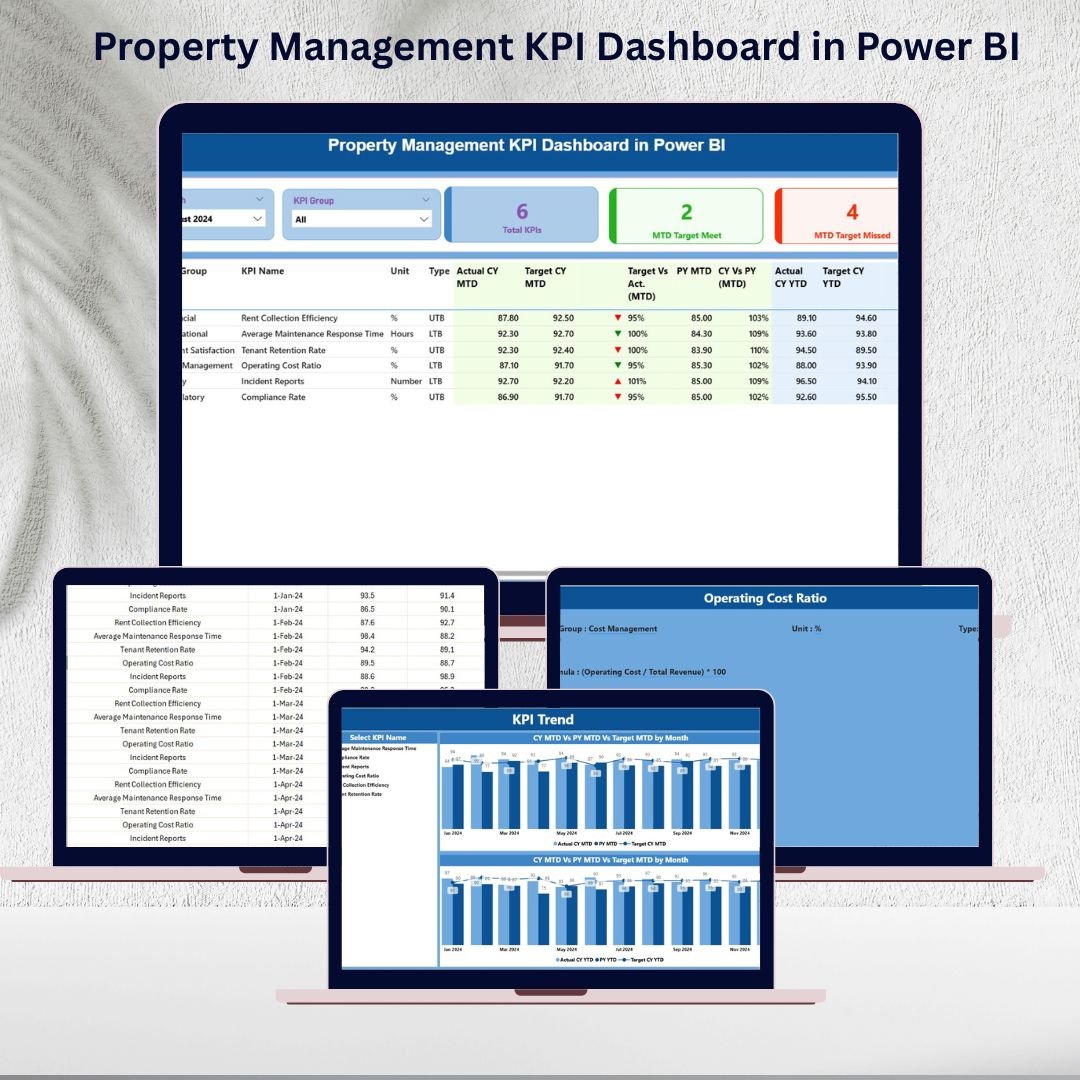
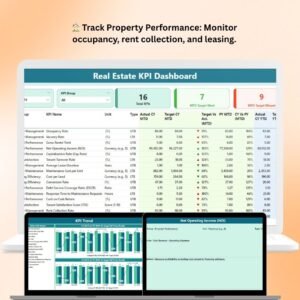
🏢 Managing property portfolios is complex—rental income, occupancy, maintenance, tenant satisfaction, and ROI all need to be monitored closely. Spreadsheets and manual reports often fall short, leading to delays and missed opportunities. That’s why the Property Management KPI Dashboard in Power BI is a game-changer for real estate professionals. 🚀
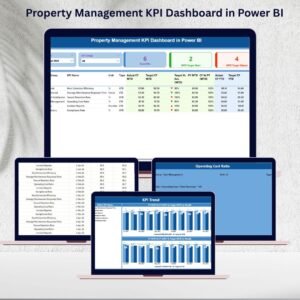
This interactive dashboard consolidates property performance data into a single, visual, and dynamic platform. With three core pages—Summary, KPI Trend, and KPI Definition—it provides clear insights into portfolio health, operational costs, and tenant satisfaction. By integrating with Excel or property management software, managers get real-time reporting without the hassle of manual updates.
🌟 Key Features of the Property Management KPI Dashboard in Power BI
-
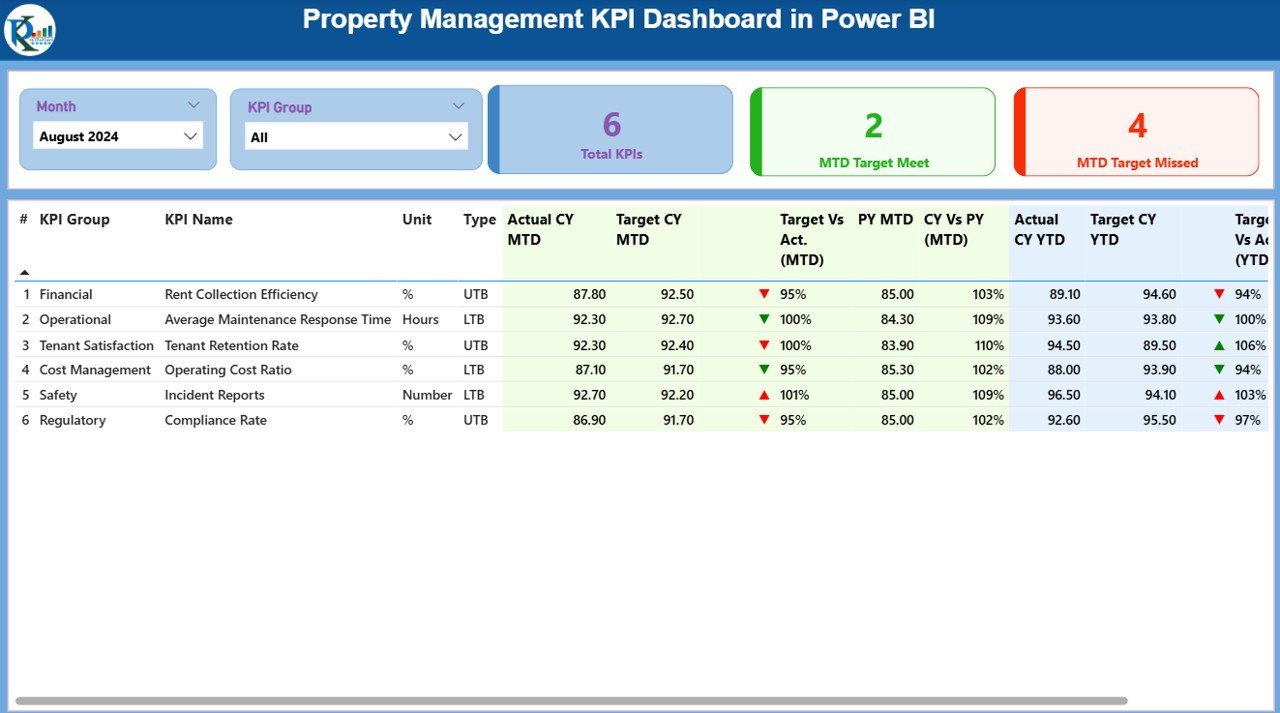
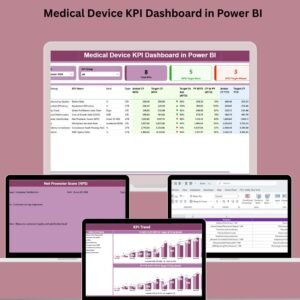
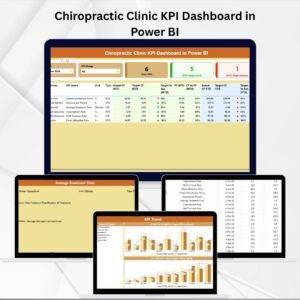
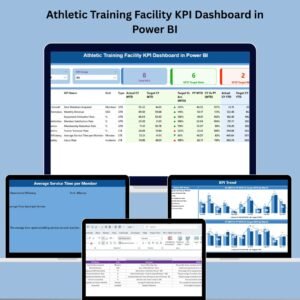
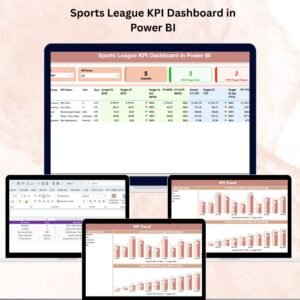
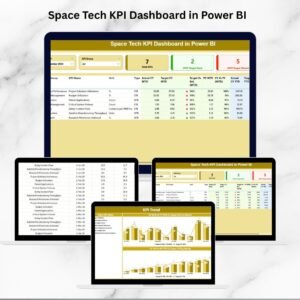
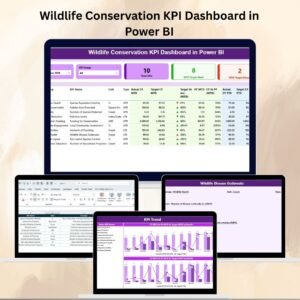
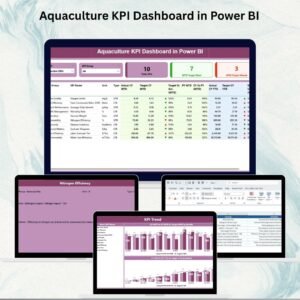
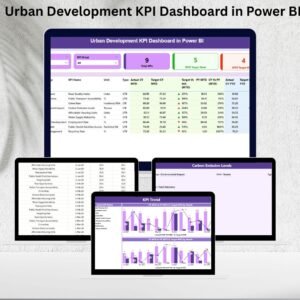
📊 Summary Page – The central hub with:
-
KPI cards showing Total KPI count, MTD Target Met, and Target Missed
-
A detailed KPI table with Actual vs Target values, Variance %, CY vs PY comparisons, and performance icons (green ▲ or red ▼).
-
Slicers for Month and KPI Group filtering.
-
-
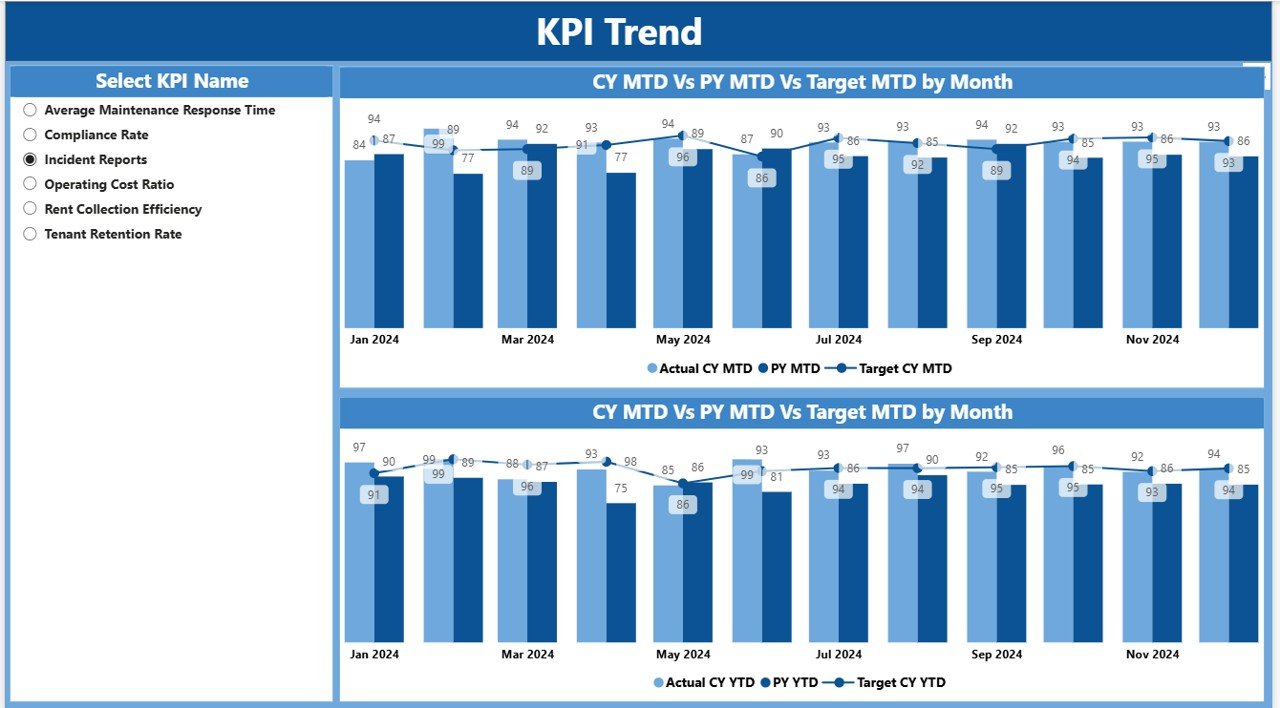
📈 KPI Trend Page – Analyze performance over time with:
-
Combo charts comparing Current Year vs Previous Year vs Targets.
-
A KPI slicer for drilling into specific metrics like occupancy, rent collection, or maintenance costs.
-
-
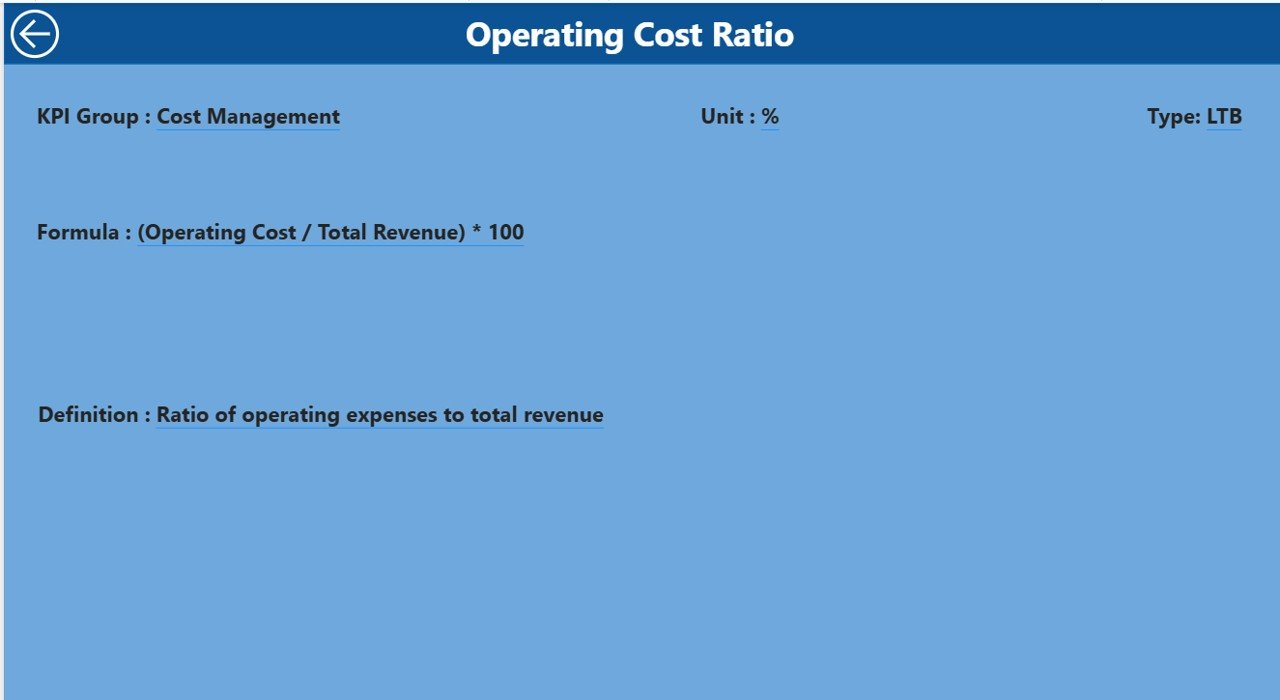
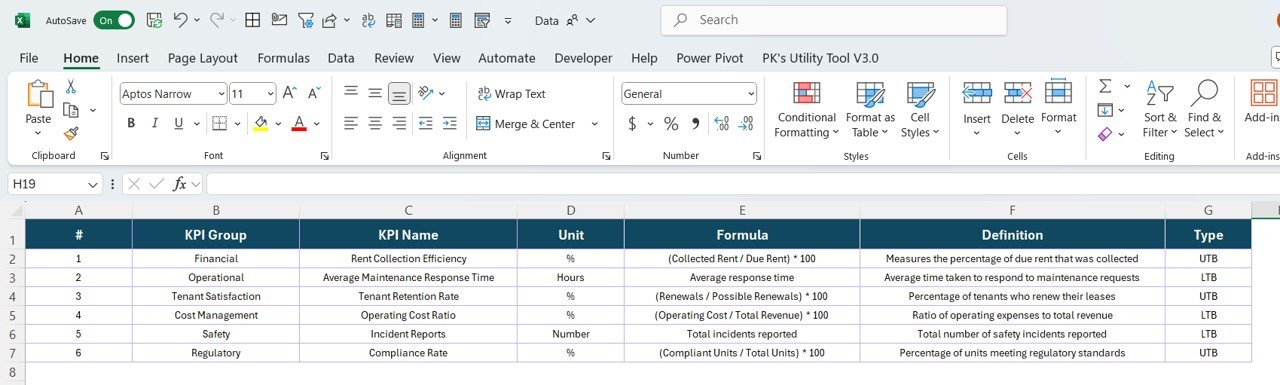
📖 KPI Definition Page – A transparent drill-through view showing:
-
KPI Number, Group, Unit, Formula, Definition, and Type (LTB/UTB).
-
Ensures all stakeholders understand KPI calculations.
-
-
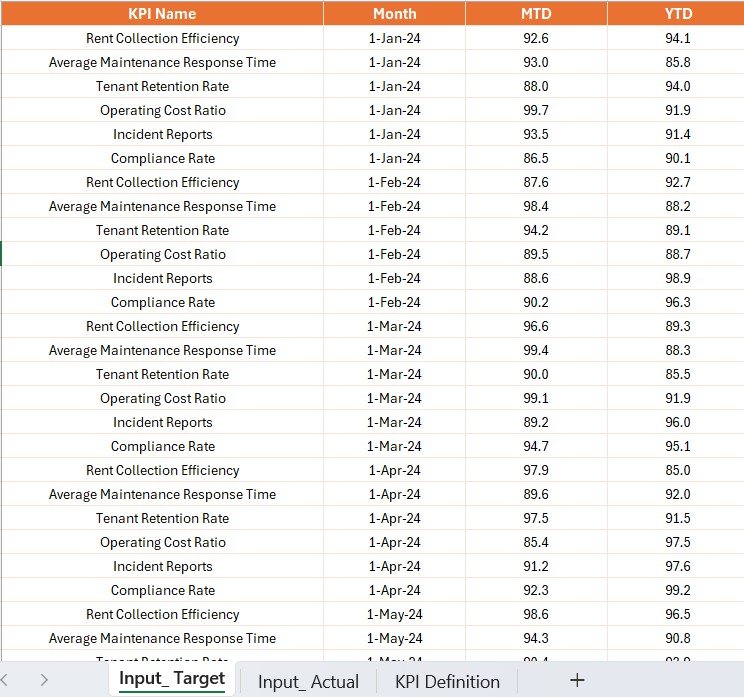
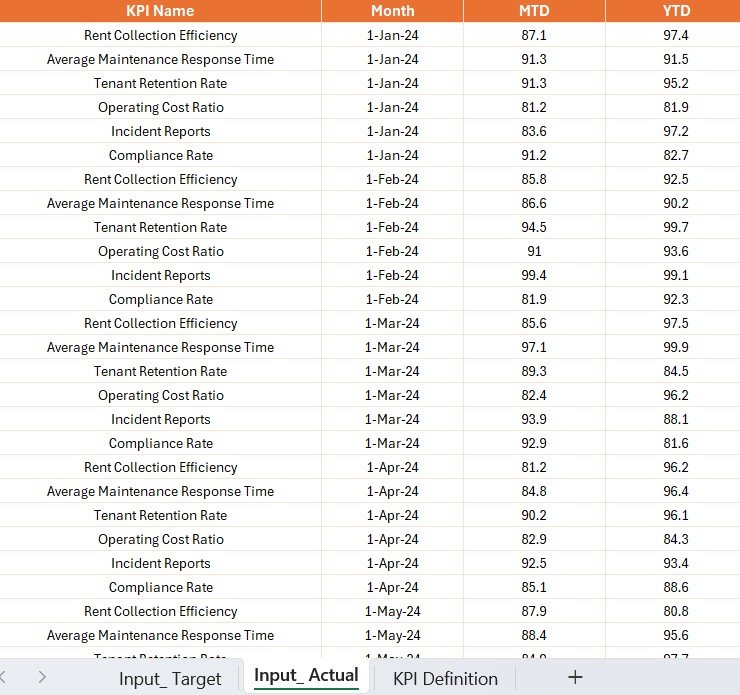
💻 Excel Data Integration – Easy backend structure with:
-
Input_Actual Sheet for monthly actuals (MTD & YTD).
-
Input_Target Sheet for monthly targets.
-
KPI Definition Sheet for formula references and metadata.
-
📦 What’s Inside the Dashboard
When you download the Property Management KPI Dashboard in Power BI, you get:
-
✅ A fully interactive Power BI (.pbix) dashboard.
-
✅ 3 analytical pages: Summary, KPI Trend, KPI Definition.
-
✅ Built-in visuals (cards, icons, combo charts, drill-throughs).
-
✅ A ready-to-use Excel file (Actuals, Targets, KPI Definitions).
-
✅ Filters and slicers for quick insights across months, groups, or properties.
-
✅ Scalable structure for single properties or large portfolios.
🛠 How to Use the Property Management KPI Dashboard
-
Update Excel Sheets – Enter Actuals, Targets, and KPI Definitions.
-
Refresh Power BI – Instantly see updated KPIs and charts.
-
Analyze Summary Page – Get a quick overview of all property metrics.
-
Drill into Trends – Use KPI Trend Page to identify seasonal or long-term shifts.
-
Check KPI Definitions – Understand formulas and calculation logic with drill-throughs.
-
Share Reports – Export dashboards as PDF or PowerPoint for stakeholders.
No coding required—Power BI handles the heavy lifting.
👥 Who Can Benefit from This Dashboard?
This dashboard is ideal for:
-
🏢 Property Managers – Monitor rent collection, occupancy, and tenant satisfaction.
-
💰 Investors – Evaluate ROI, portfolio growth, and financial performance.
-
🔧 Operations Teams – Track maintenance costs and service response times.
-
📊 Real Estate Consultants – Provide clients with transparent KPI insights.
-
📈 Executives & CFOs – Ensure rental income aligns with financial targets.
Whether managing a single building or a multi-property portfolio, this dashboard provides the clarity needed to make smarter decisions.
✅ Advantages of Using Property Management KPI Dashboard in Power BI
-
Centralized Reporting – All KPIs in one place.
-
Real-Time Updates – Refresh Excel data for instant reporting.
-
Better Decisions – Quickly identify underperforming assets.
-
Improved Tenant Satisfaction – Monitor occupancy and service metrics.
-
Transparent KPIs – Clear definitions for every metric.
-
Visual Indicators – Red/green arrows for instant recognition.
-
Time-Saving – Cuts manual reporting effort.


Reviews
There are no reviews yet.