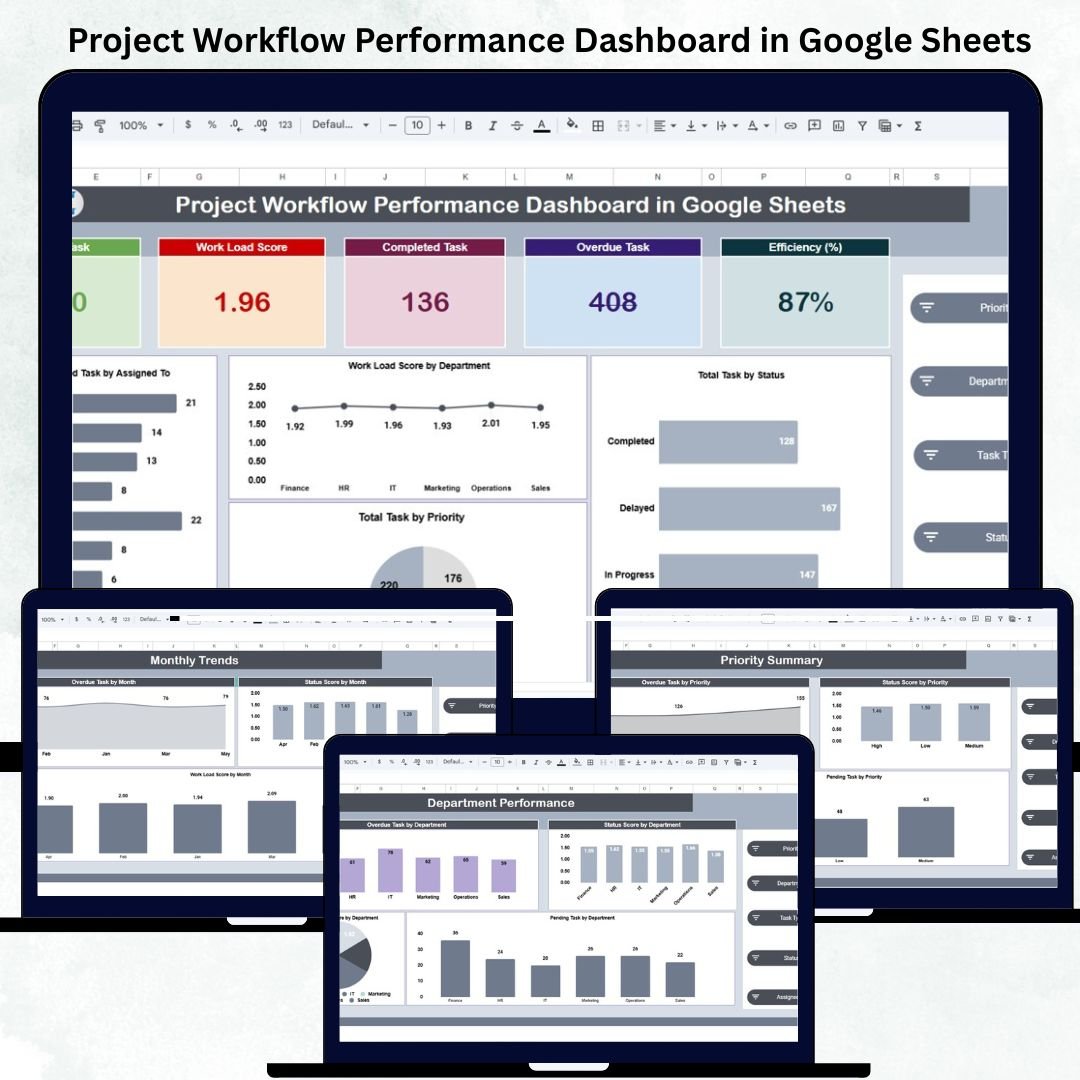
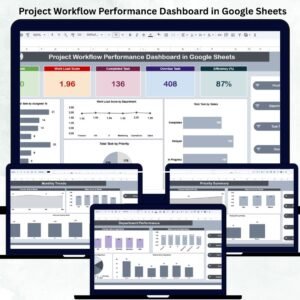
Efficient project management depends on visibility — knowing what’s on track, what’s delayed, and where workloads are piling up. The Project Workflow Performance Dashboard in Google Sheets is a ready-to-use, all-in-one analytics solution that gives teams complete control over tasks, efficiency, and workload distribution. 📈📊
Designed for project managers, department heads, and team leads, this dynamic dashboard turns data into actionable insights, helping you monitor total tasks, overdue work, performance efficiency, and department-level workload — all through automated visuals.
Built entirely in Google Sheets, it’s simple to use, customizable, and collaboration-ready — making it the ultimate productivity companion for organizations of any size. ⚙️✅
🔑 Key Features of the Project Workflow Performance Dashboard in Google Sheets
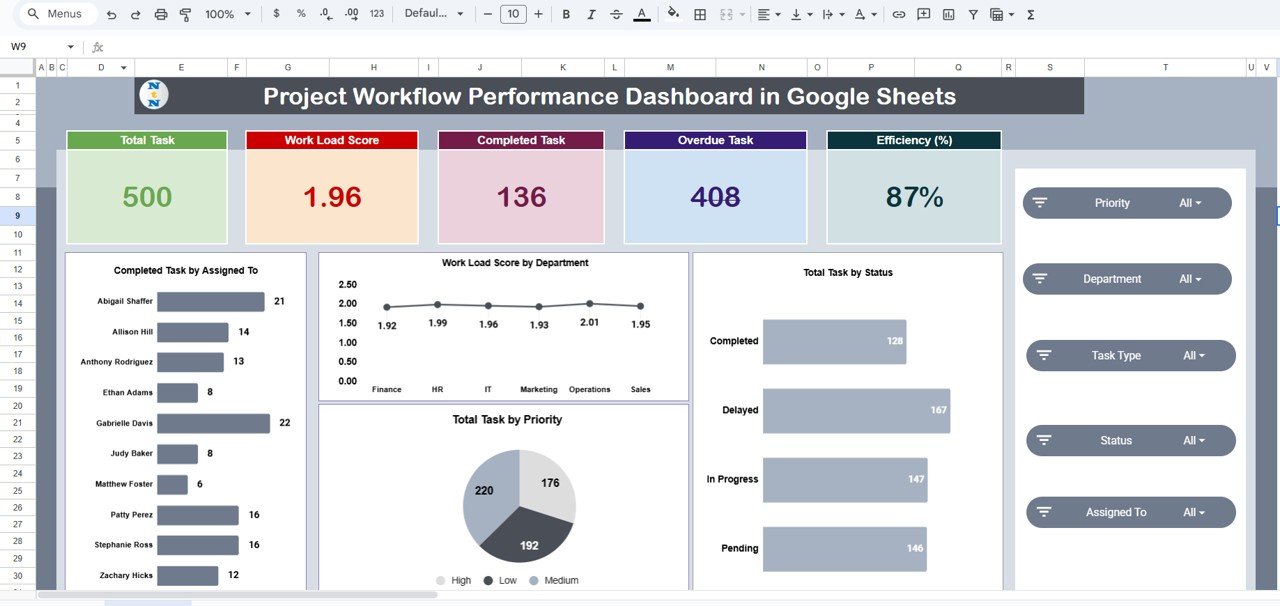
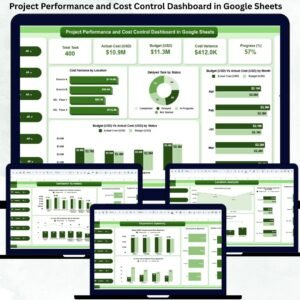
📋 Overview Sheet Tab (Main Dashboard)
-
The central control panel for all performance metrics.
-
Displays KPI Cards and visual charts that auto-update as you enter data.
-
KPI Cards:
-
Total Tasks
-
Workload Score
-
Completed Tasks
-
Overdue Tasks
-
Efficiency (%)
-
-
Charts Included:
-
Completed Task by Assigned To
-
Workload Score by Department
-
Total Task by Status
-
Total Task by Priority
-
-
Instantly visualize project health and identify performance trends.
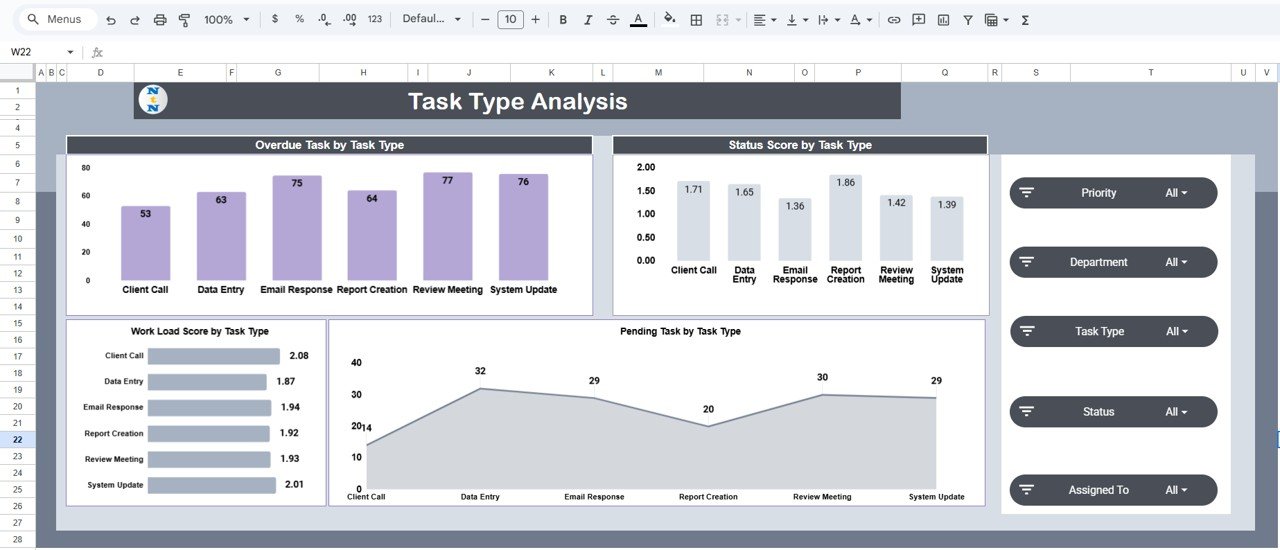
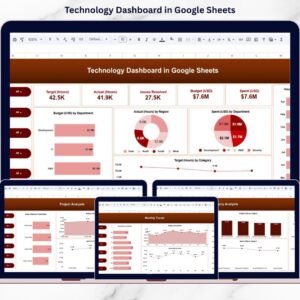
🧩 Task Type Analysis Tab
-
Evaluates performance across different task categories.
-
Charts Included:
-
Overdue Task by Task Type
-
Status Score by Task Type
-
Pending Task by Task Type
-
Workload Score by Task Type
-
-
Perfect for identifying bottlenecks and reallocating resources efficiently.
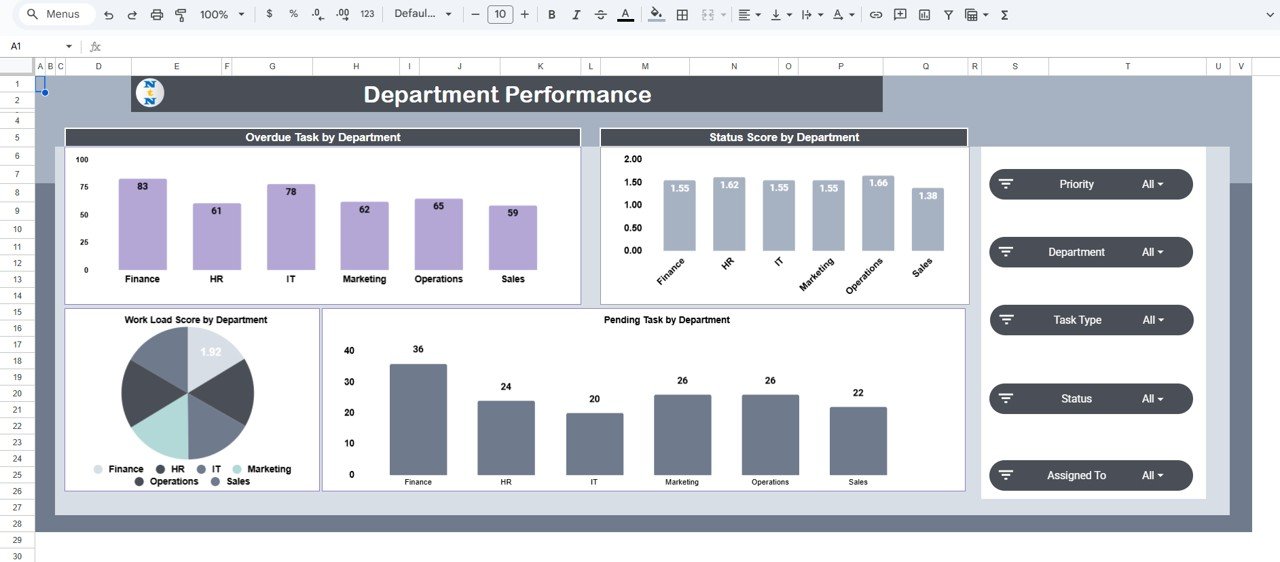
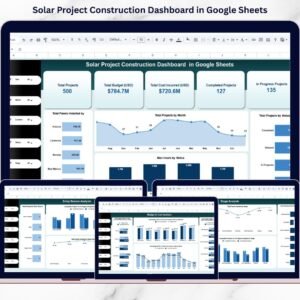
🏢 Department Performance Tab
-
Provides team-level performance breakdowns.
-
Charts Included:
-
Overdue Task by Department
-
Status Score by Department
-
Pending Task by Department
-
Workload Score by Department
-
-
Pinpoints which departments are excelling and which need attention.
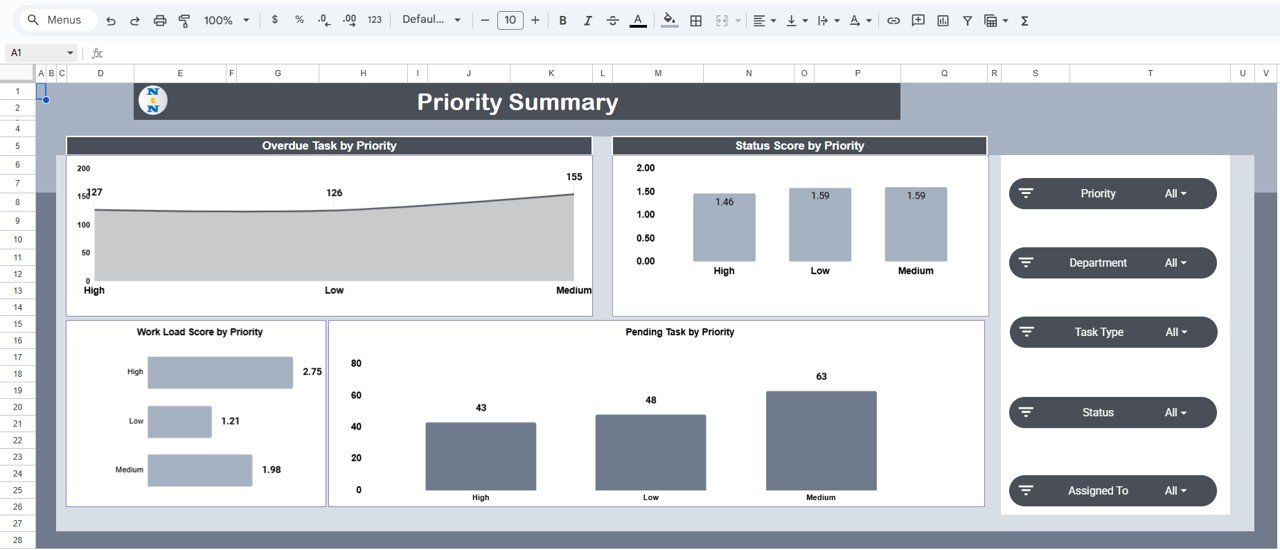
🚩 Priority Summary Tab
-
Analyzes project performance by task urgency (High, Medium, Low).
-
Charts Included:
-
Overdue Task by Priority
-
Status Score by Priority
-
Pending Task by Priority
-
Workload Score by Priority
-
-
Helps teams focus on high-priority tasks and mitigate risk early.
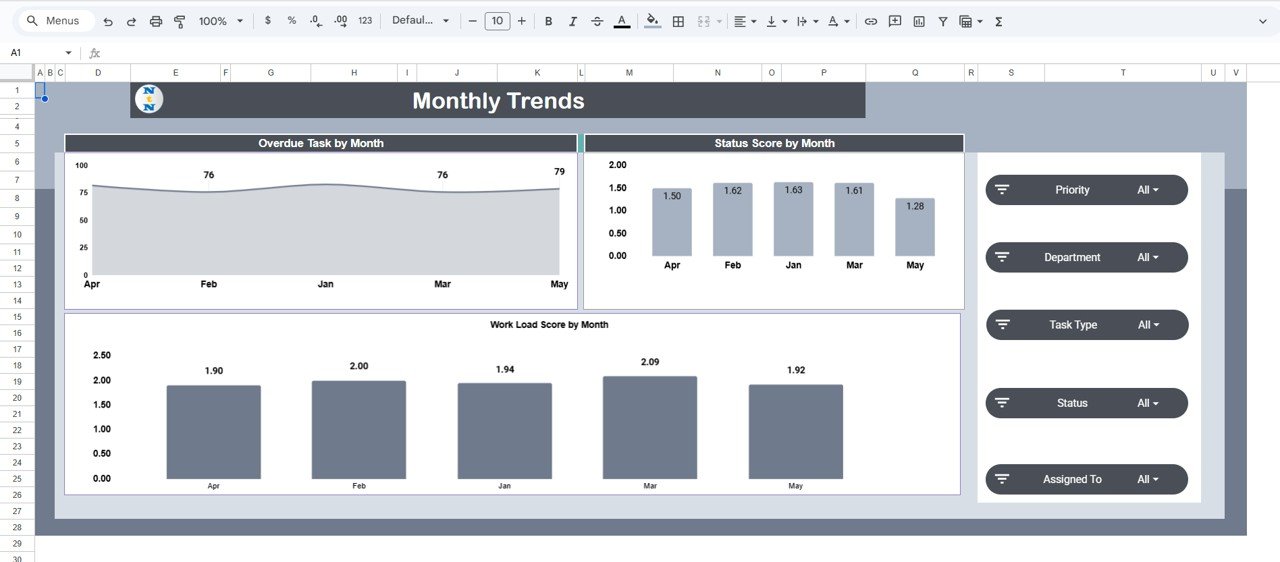
📅 Monthly Trends Tab
-
Displays long-term workflow and performance trends.
-
Charts Included:
-
Overdue Task by Month
-
Status Score by Month
-
Workload Score by Month
-
-
Enables proactive planning and improvement tracking over time.
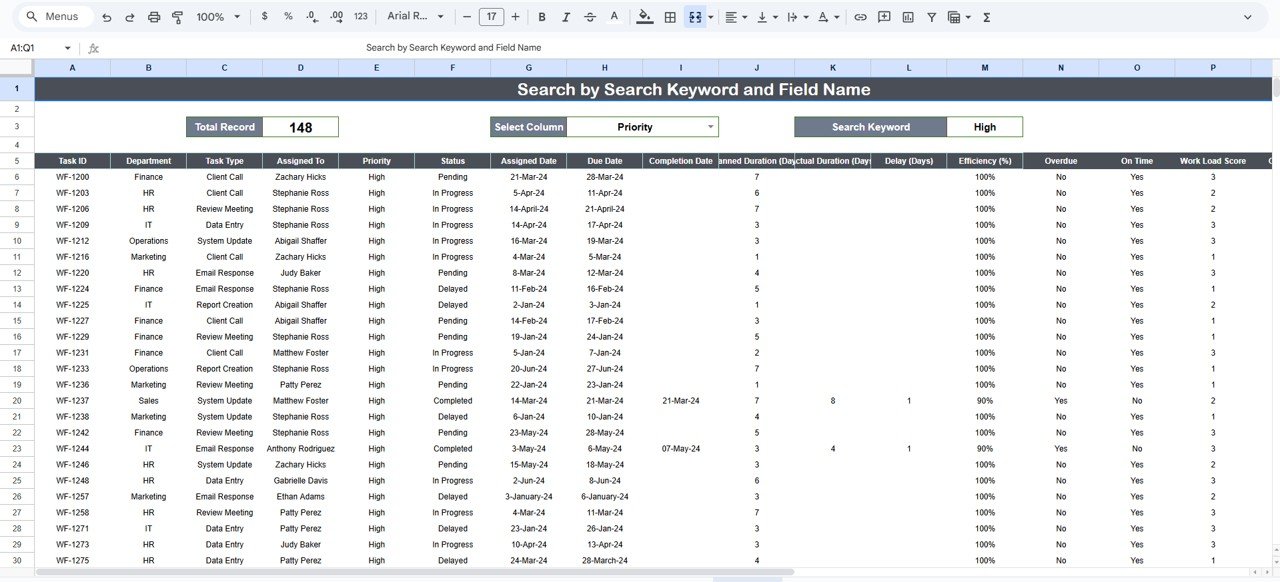
🔎 Search Sheet Tab
-
Smart search system for locating records instantly.
-
Search by Keyword (e.g., “Marketing”, “Design Task”) or Field Name (e.g., Department, Priority, Assigned To).
-
Example searches:
-
“High Priority” → Displays all critical tasks.
-
“HR” → Filters all HR department tasks.
-
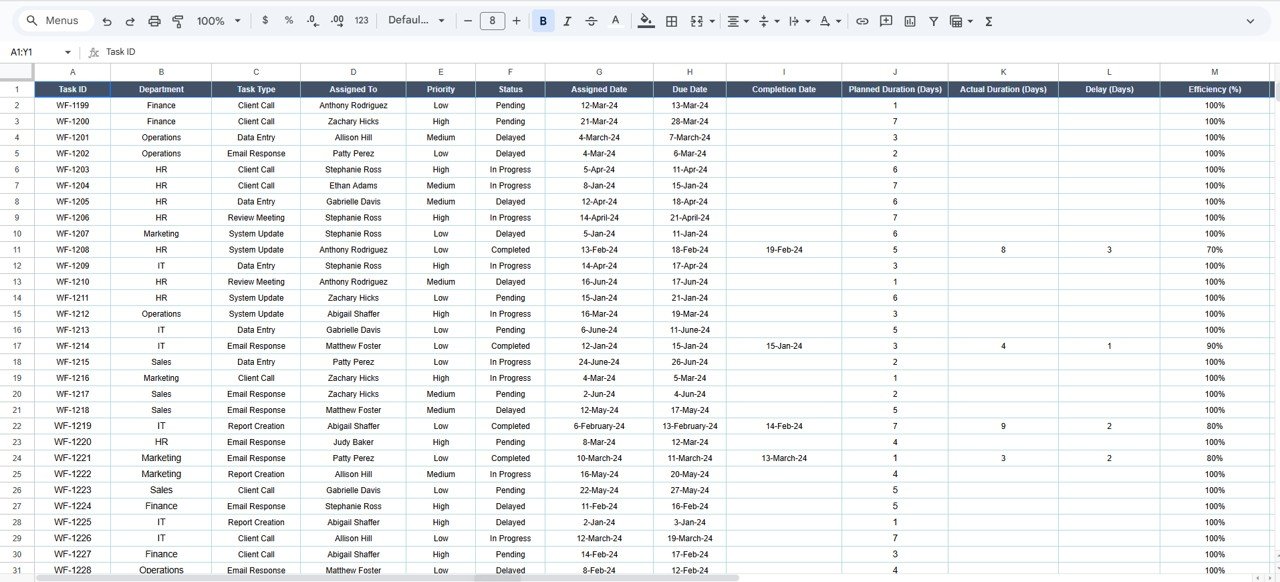
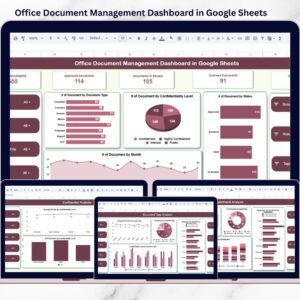
🧾 Data Sheet Tab
-
Centralized data input sheet that powers all visuals.
-
Includes task details such as Department, Task Type, Priority, Assigned To, Status, Progress %, and Due Date.
-
Automatically updates all dashboard charts upon entry.
📦 What’s Inside the Dashboard
✅ Pre-built Google Sheets dashboard with 7 analytical tabs
✅ Auto-calculated performance metrics (efficiency, workload, overdue rate)
✅ Dynamic charts and KPI summaries
✅ Search-enabled record finder for quick lookup
✅ Fully editable sheet layout
✅ Real-time cloud collaboration support
✅ Plug-and-play usability — no coding required
This dashboard gives teams everything they need to track performance, identify inefficiencies, and maintain productivity — all within one organized workspace.
🧑💼 Who Can Benefit from This Dashboard
👨💼 Project Managers – Gain real-time visibility into project performance.
👩💻 Team Leaders – Track workload distribution and identify overburdened staff.
🏢 Department Heads – Monitor overdue tasks and optimize efficiency.
📈 Executives – Evaluate organizational productivity and resource usage.
💡 Operations Teams – Improve cross-department coordination and workflow clarity.
It’s the perfect solution for companies managing multiple projects or departments with varied workloads.
🧪 How to Use the Project Workflow Performance Dashboard
1️⃣ Input Task Data: Add project details to the Data Sheet.
2️⃣ Review KPIs: See real-time efficiency, workload, and overdue stats.
3️⃣ Analyze Trends: Explore department, priority, and task type charts.
4️⃣ Search Easily: Use the Search Tab to find records in seconds.
5️⃣ Review Monthly: Use the Monthly Trends tab for long-term performance tracking.
💡 Pro Tip: Use conditional formatting to highlight overdue tasks automatically and connect Google Forms for task submissions.
🌟 Why Choose This Dashboard
-
Complete visibility into projects and workloads
-
Smart automation for progress and efficiency tracking
-
Cloud-based collaboration for seamless teamwork
-
Scalable structure — suitable for all industries
-
Fully customizable to match your workflow
With the Project Workflow Performance Dashboard in Google Sheets, you can stay informed, improve accountability, and lead your team toward higher productivity and timely project delivery. 🌟
🔗 Click here to read the Detailed blog post
Watch the step-by-step video Demo:


Reviews
There are no reviews yet.