Managing projects without real-time visibility often results in missed milestones, budget overruns, and unclear ownership. However, when you track every milestone visually and interactively, project execution becomes faster, smarter, and more controlled.
That is exactly why the Project Milestone Tracking Dashboard in Power BI is a must-have tool for modern project teams.
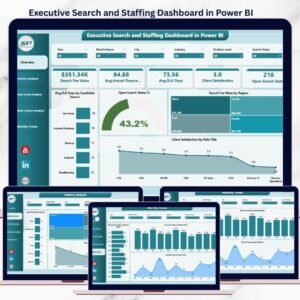
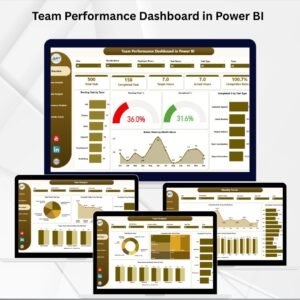
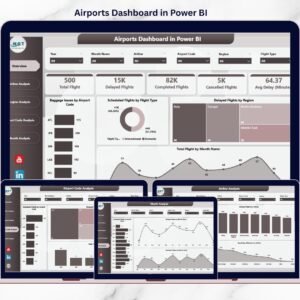
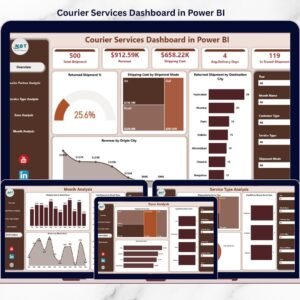
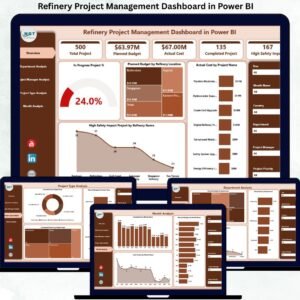
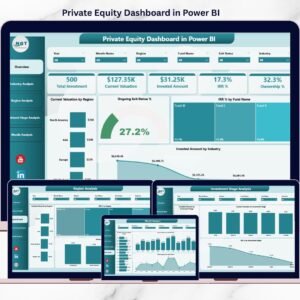
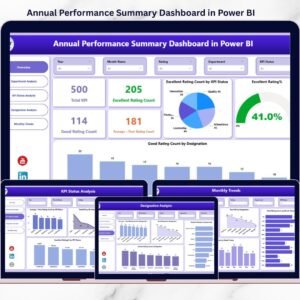
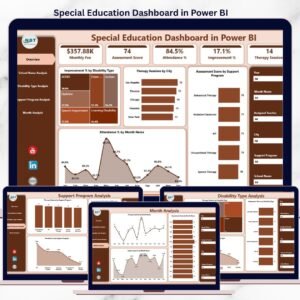
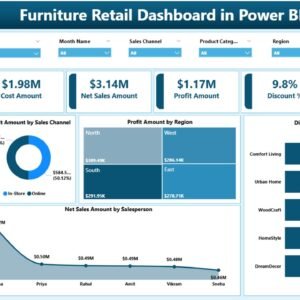
This ready-to-use Power BI dashboard helps you monitor project milestones, budgets, owners, progress status, and trends in one centralized and interactive reporting solution. Instead of struggling with multiple Excel files, emails, or static reports, you get instant insights that support confident and timely decision-making.
Whether you manage a single project or a large portfolio, this dashboard gives you complete control over project performance—without complexity.
🔑 Key Features of Project Milestone Tracking Dashboard in Power BI
📊 Centralized Project Visibility
Track all project milestones, budgets, and progress in a single Power BI file.
⏱️ Real-Time Performance Monitoring
Monitor completed, in-progress, delayed, and not-started milestones instantly.
💰 Budget Tracking & Control
Analyze budget allocated vs budget used across projects, departments, and owners.
🎯 Clear Accountability Tracking
Identify milestone ownership clearly to improve responsibility and follow-ups.
📈 Trend-Based Insights
Analyze monthly trends to detect delays, budget spikes, and performance patterns.
🔍 Interactive Filters & Slicers
Slice data by project, department, owner, status, and month with zero manual effort.
📑 Professional Multi-Page Design
Well-structured pages ensure clarity for both operational teams and leadership.
📦 What’s Inside the Project Milestone Tracking Dashboard
This dashboard includes five powerful and purpose-driven pages:
📌 Overview Page
Get a high-level snapshot of total milestones, budgets, completion status, and delays.
📌 Project Analysis Page
Identify projects consuming the highest budget and those lagging behind schedule.
📌 Department Analysis Page
Compare performance, budget usage, and milestone completion across departments.
📌 Owner Analysis Page
Track accountability by analyzing milestones and budgets by owner.
📌 Monthly Trends Page
Understand how project progress and budgets change month over month.
Each page is designed to answer critical project management questions instantly.
🛠️ How to Use the Project Milestone Tracking Dashboard
1️⃣ Load your milestone data from Excel, databases, or project systems
2️⃣ Refresh the Power BI dashboard
3️⃣ Use slicers to filter by project, department, owner, or time
4️⃣ Analyze milestone progress, delays, and budgets
5️⃣ Take early corrective actions based on insights
No advanced Power BI skills required—this dashboard is ready to use.
👥 Who Can Benefit from This Project Milestone Tracking Dashboard
✅ Project Managers
✅ Program Managers
✅ PMO Teams
✅ Department Heads
✅ Finance & Budget Teams
✅ Senior Management & Leadership
If you manage projects, budgets, or teams—this dashboard is built for you.
🎯 Why Choose This Dashboard?
✔ Improves project delivery timelines
✔ Reduces reporting effort
✔ Enhances transparency and accountability
✔ Supports faster, data-driven decisions
✔ Scales easily as projects grow
This dashboard transforms project data into actionable intelligence.
Click here to read the detailed blog post
Watch the step-by-step video tutorial:


Reviews
There are no reviews yet.