In today’s competitive market, data is the ultimate driver of marketing success. Whether you’re launching a new product, optimizing campaigns, or tracking ROI, visibility into your marketing KPIs can make or break your strategy. The Product Marketing KPI Dashboard in Excel from NextGenTemplates.com is your all-in-one performance management tool — designed to help marketers measure, visualize, and improve results with ease.
Built entirely in Microsoft Excel, this ready-to-use dashboard simplifies complex data into clean, actionable visuals. It tracks Month-to-Date (MTD) and Year-to-Date (YTD) performance, automatically compares results with targets, and highlights key trends — giving you the clarity to make confident marketing decisions.
⚙️ Key Features of the Product Marketing KPI Dashboard in Excel
📊 7 Worksheets: Home | Dashboard | KPI Trend | Actual Input | Target | Previous Year | KPI Definition
📅 MTD & YTD Tracking: View performance across short- and long-term periods.
🎯 Target vs Actual Comparison: Instantly spot over- and under-performing KPIs.
📈 Dynamic Charts & Slicers: Interactive visuals for campaign, product, and region analysis.
📉 Conditional Formatting: Green and red arrows signal performance trends.
🧮 Automated Formulas: No manual calculations or coding needed.
💡 Customizable Structure: Add or modify KPIs as your marketing strategy evolves.
💻 User-Friendly Navigation: Home sheet buttons for instant access to any section.
🧭 Dashboard Structure and Pages
🏠 1️⃣ Home Sheet – The Navigation Hub

The Home Sheet acts as your control panel, featuring buttons that link directly to all major sections. Even non-technical users can navigate easily between Dashboard, KPI Trend, Actuals, Target, and Definition sheets.
💡 Purpose: Simplify access and maintain a professional, intuitive interface.
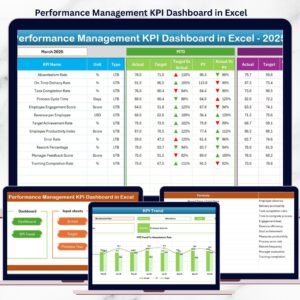
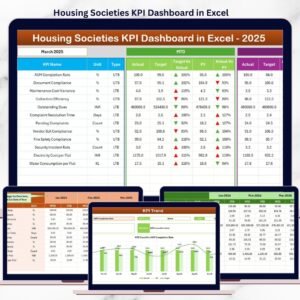
📊 2️⃣ Dashboard Sheet – The Heart of Marketing Performance
This is where the magic happens — a visual summary of your marketing success.
Includes:
-
Month selector (cell D3) for quick filtering.
-
KPI cards showing Actual, Target, and Previous Year (PY) data for MTD & YTD.
-
Trend arrows (🟢 for growth, 🔴 for decline).
-
Dynamic charts showcasing campaign results, conversion rates, and sales performance.
💡 Purpose: Instantly monitor progress and share results during marketing reviews.
📈 3️⃣ KPI Trend Sheet – Deep Dive into Performance
Analyze any individual KPI’s movement over time using a dropdown (cell C3).
Features:
-
Displays KPI Group, Unit, Formula, and Type (UTB/LTB).
-
Dynamic MTD & YTD trend charts comparing Actual vs Target vs PY.
-
Identify seasonality or recurring patterns in campaign performance.
💡 Purpose: Enable managers to understand “why” performance is improving or lagging.
📋 4️⃣ Actual Numbers Input Sheet – Record Real-Time Data
This sheet captures actual KPI results, linking directly to the dashboard visuals.
Columns: KPI Name | Month | MTD Actual | YTD Actual
Automatically integrates with all charts and comparisons once updated.
💡 Purpose: Maintain accurate, up-to-date data for live insights.
🎯 5️⃣ Target Sheet – Set Measurable Goals
Define monthly and yearly targets for every KPI to ensure each performance metric has a benchmark.
💡 Purpose: Compare actual progress against strategic objectives.
🕰️ 6️⃣ Previous Year Numbers Sheet – Benchmark Historical Growth
Input last year’s MTD and YTD results to visualize year-over-year improvement.
💡 Purpose: Evaluate long-term growth and performance consistency.
📘 7️⃣ KPI Definition Sheet – Maintain Consistency
Keep your KPIs standardized with clear definitions, formulas, and units.
Columns: KPI Name | Group | Unit | Formula | Definition | Type (LTB/UTB)
💡 Purpose: Prevent confusion and ensure every stakeholder interprets KPIs uniformly.
🌟 Advantages of the Product Marketing KPI Dashboard
✅ Complete Marketing Visibility: Track sales, campaigns, and engagement in one place.
📈 Real-Time Updates: View progress instantly as data changes.
📉 Automated Comparisons: CY vs PY and Target vs Actual.
💼 Professional Presentation: Ideal for stakeholder or board reporting.
📊 Visual Insights: Identify trends and underperforming areas fast.
⚙️ No Additional Software: 100 % Excel-based — no Power BI or macros required.
💰 Cost-Effective Solution: Enterprise-level analytics without added cost.
💡 Popular KPIs to Track
🎯 Marketing KPIs: Campaign ROI (%), Cost per Lead ($), Conversion Rate (%), Product Awareness (%).
💵 Sales KPIs: Revenue Growth (%), Units Sold, Average Order Value ($).
💬 Customer KPIs: Retention Rate (%), NPS (Net Promoter Score), Refund Rate (%).
💡 Use these metrics to understand campaign performance and ROI effectively.
🧠 Best Practices for Using This Dashboard
📅 Update Actual & Target data monthly.
📋 Define KPIs clearly before implementation.
🟢 Use conditional formatting for better visualization.
📊 Analyze trends quarterly for strategic adjustments.
📈 Focus on KPIs that align with business goals.
🔐 Protect formulas and dropdowns from edits.
👩💼 Who Can Use This Dashboard
💼 Product Marketing Managers
📊 Data & Performance Analysts
🏢 Brand Strategists
💻 Marketing Agencies
📈 Business Development Teams
🧩 Conclusion
The Product Marketing KPI Dashboard in Excel is more than a reporting tool — it’s a complete performance management system for data-driven marketers.
From campaign effectiveness to ROI tracking, it gives marketing teams the insights they need to make informed, strategic decisions.
📊 Analyze smarter, report faster, and drive results — with NextGen Templates’ Product Marketing KPI Dashboard in Excel.








Reviews
There are no reviews yet.