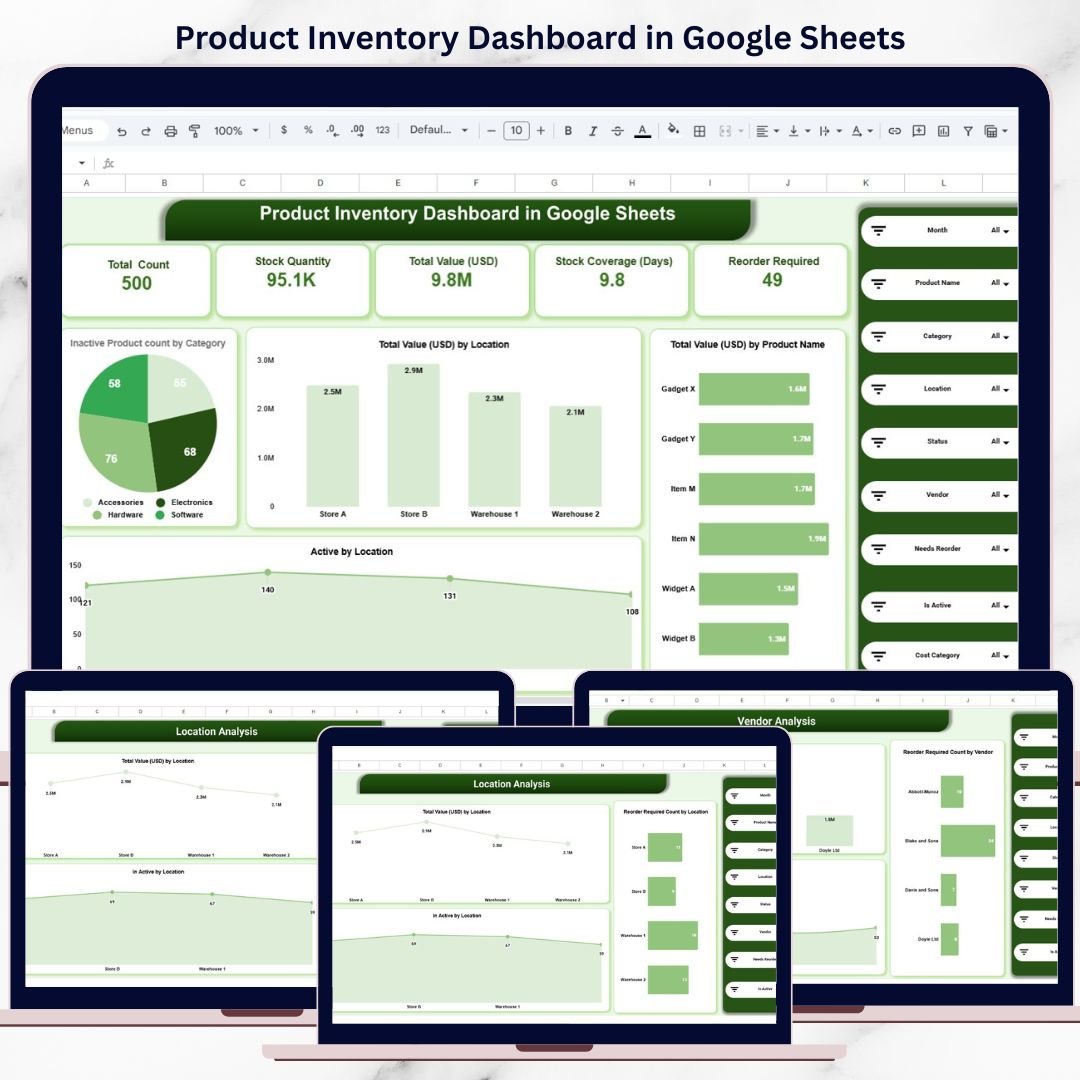
Inventory mismanagement silently drains profits. Stockouts lead to lost sales, overstock ties up working capital, and inactive products increase holding costs. Yet many businesses still rely on raw spreadsheets that fail to show what really matters. That is exactly why the Product Inventory Dashboard in Google Sheets becomes a must-have business tool.
This ready-to-use dashboard transforms raw inventory data into clear KPIs, visual insights, and actionable trends. Instead of juggling multiple files, you get a single, centralized Google Sheets dashboard that shows stock levels, inventory value, reorder requirements, inactive items, and performance trends across categories, locations, vendors, and months.
Because the dashboard is built entirely in Google Sheets, it is cloud-based, collaborative, and easy to customize—without any technical complexity or expensive software.
🔑 Key Features of the Product Inventory Dashboard
📊 Instant Inventory Health Snapshot
KPI cards give you immediate clarity on stock quantity, inventory value, coverage days, and reorder needs.
🔍 Advanced Filtering & Search
Slice inventory by product, category, vendor, location, status, month, or reorder requirement.
📦 Reorder Requirement Tracking
Quickly identify items that need replenishment before stockouts occur.
🧊 Inactive & Dead Stock Visibility
Highlight slow-moving or inactive products that block cash flow.
🤝 Real-Time Collaboration
Multiple users can update and analyze inventory together in Google Sheets.
📦 What’s Inside the Product Inventory Dashboard
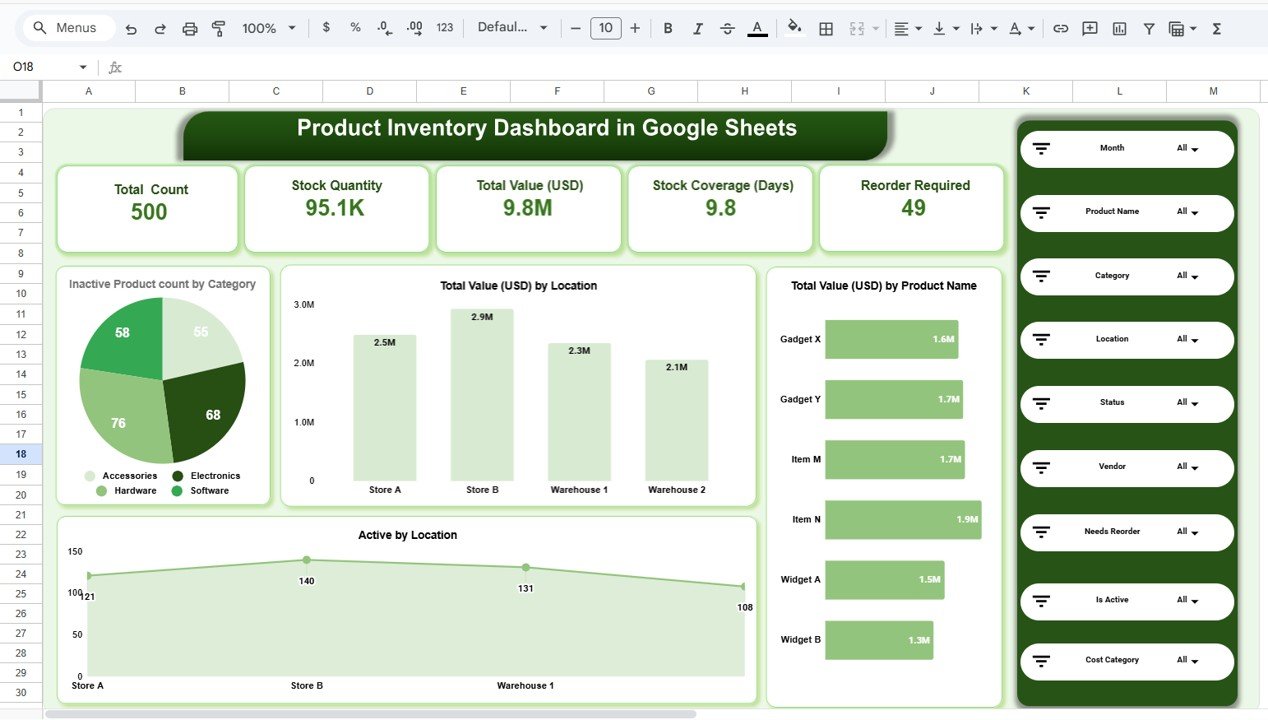
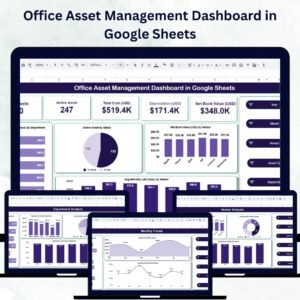
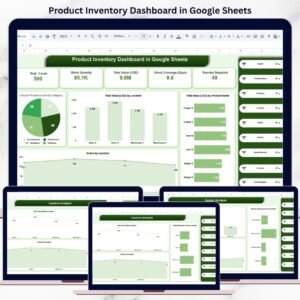
🗂️ Overview Sheet – Inventory Snapshot
This is the main dashboard page that summarizes overall inventory performance.
Key KPI Cards Display:
-
Total Product Count
-
Total Stock Quantity
-
Total Inventory Value (USD)
-
Stock Coverage (Days)
-
Reorder Required Items
These KPIs help management assess inventory health in seconds.
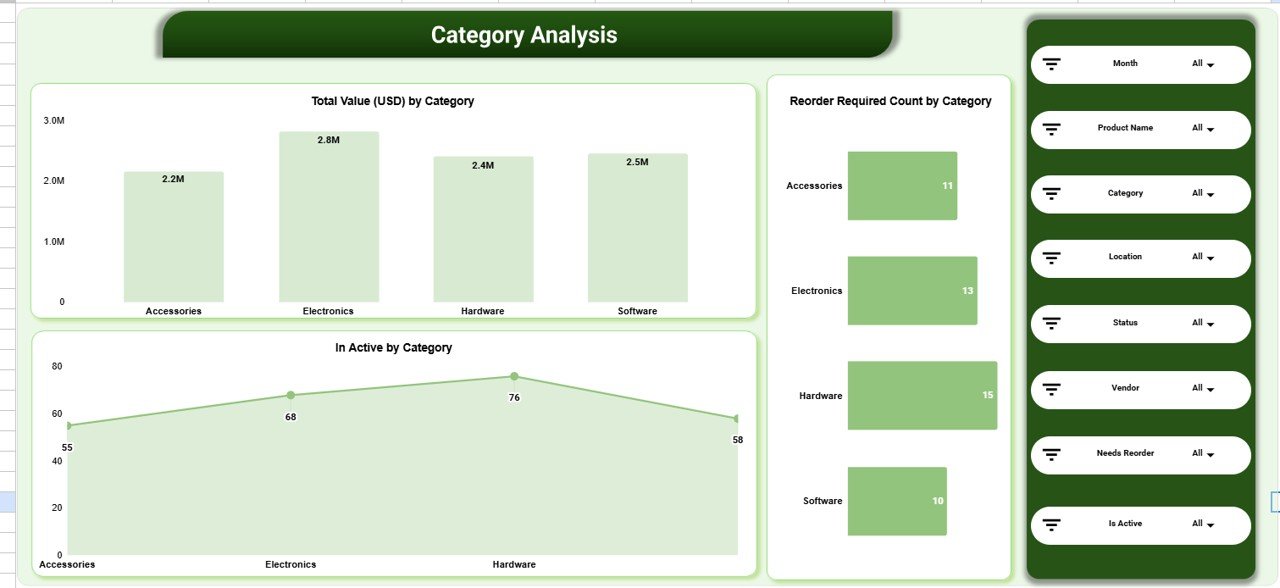
🧮 Category Analysis – Product-Wise Insights
This section helps businesses understand how inventory distributes across product categories.
Charts Included:
-
📊 Total Inventory Value (USD) by Category
-
🔁 Reorder Required Count by Category
-
❄️ Inactive Products by Category
This analysis helps identify high-value categories, slow movers, and restocking priorities.
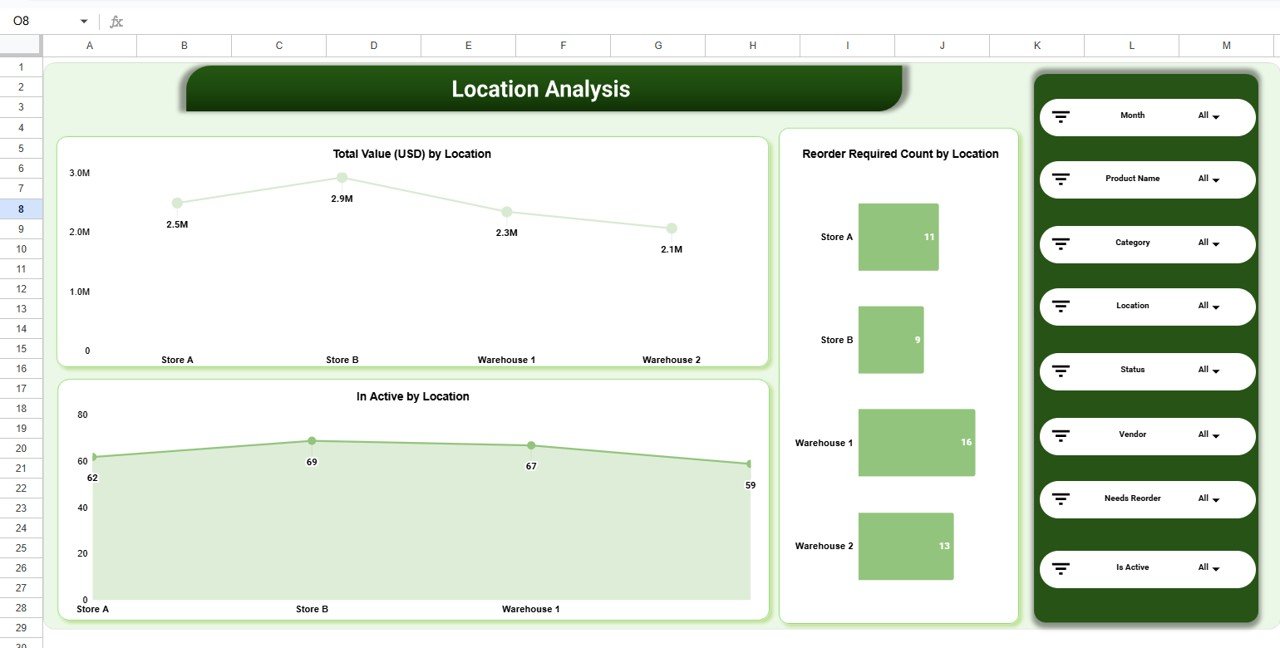
🏬 Location Analysis – Store & Warehouse Performance
Inventory performance often varies by location. This section highlights location-wise insights.
Key Visuals:
-
📍 Total Inventory Value (USD) by Location
-
🚫 Inactive Products by Location
-
🔄 Reorder Required Count by Location
Operations teams use this view to optimize stock allocation and reduce location-level shortages.
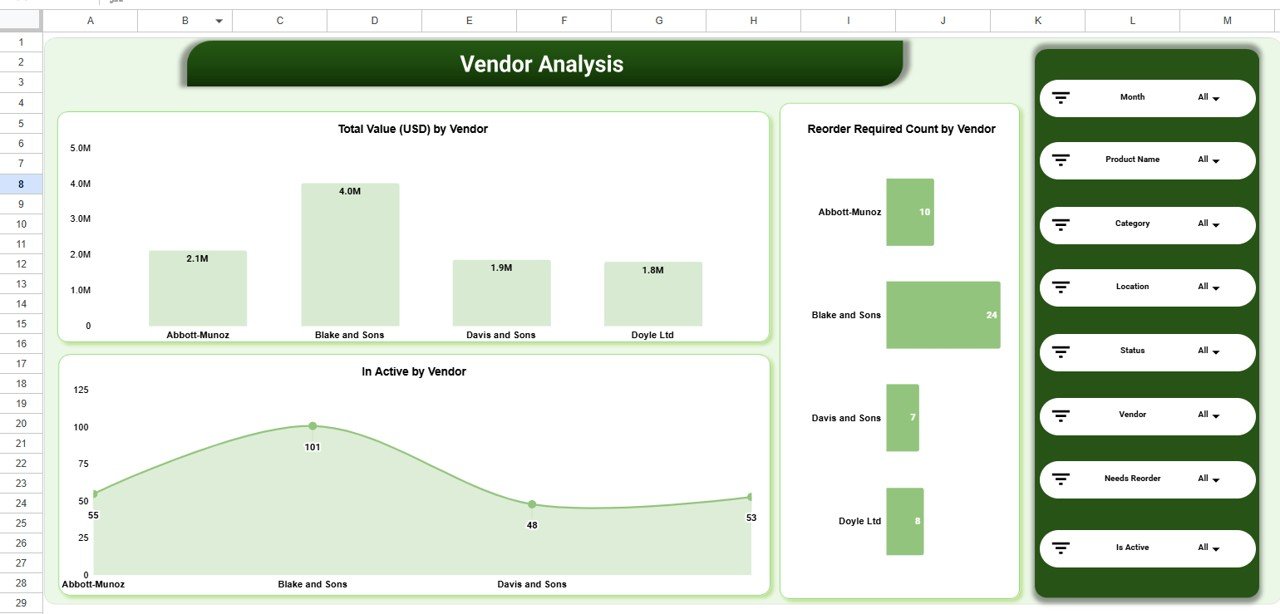
🤝 Vendor Analysis – Supplier Performance Monitoring
Suppliers play a critical role in inventory availability. This section focuses on vendor-wise inventory insights.
Charts Covered:
-
📦 Total Inventory Value (USD) by Vendor
-
❄️ Inactive Products by Vendor
-
🔁 Reorder Required Count by Vendor
Procurement teams can use this to improve vendor planning and negotiations.
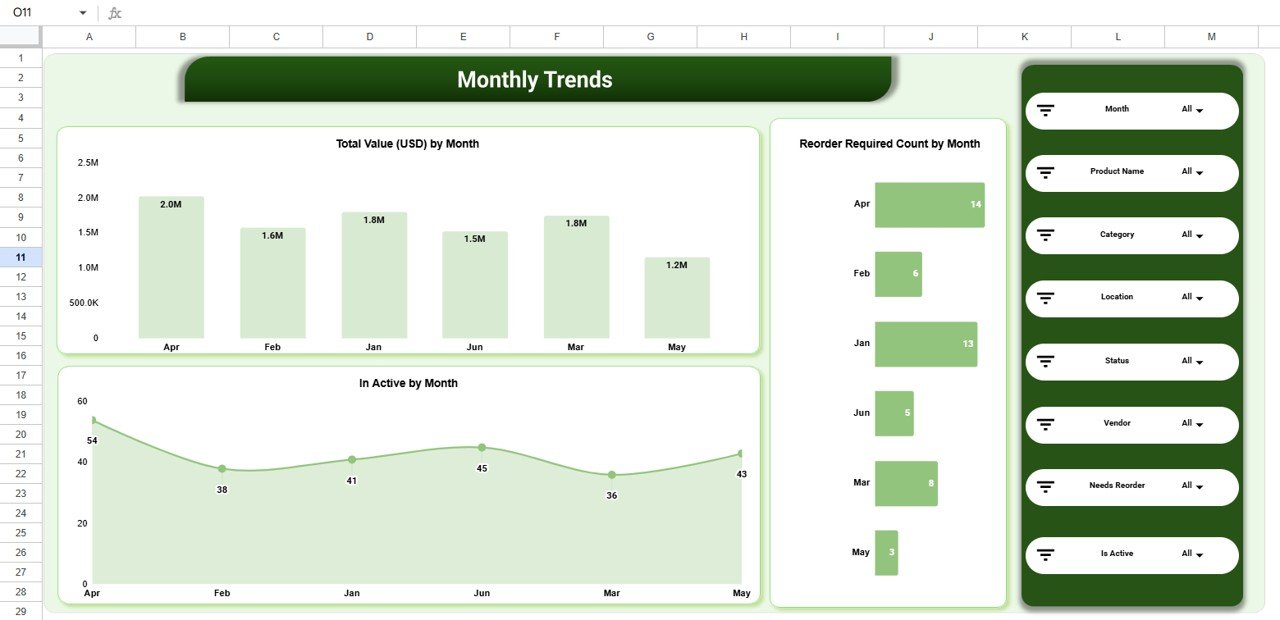
📈 Monthly Trends – Inventory Movement Over Time
This section tracks how inventory changes month by month.
Trend Charts Include:
-
📅 Total Inventory Value (USD) by Month
-
📉 Inactive Products by Month
-
🔄 Reorder Required Count by Month
These trends help forecast demand and prevent seasonal inventory issues.
🔎 Powerful Search & Slicers
The dashboard includes Search by Keyword and Field Name, along with slicers for:
-
Month
-
Product Name
-
Category
-
Location
-
Vendor
-
Status (Active / Inactive)
-
Reorder Required
This allows fast drill-downs during reviews and audits.
👥 Who Can Benefit from This Dashboard
-
🛍️ Retail businesses
-
🚚 Wholesale distributors
-
🏭 Warehouses & logistics teams
-
📦 Inventory & supply chain managers
-
🏢 Small and medium enterprises
🚀 How to Use the Product Inventory Dashboard
-
Enter inventory data in the data sheet
-
Use slicers to filter insights instantly
-
Monitor reorder indicators weekly
-
Review inactive products monthly
-
Share dashboard with procurement and operations teams
No advanced Google Sheets skills required.
### Click here to read the Detailed blog post
Watch the step-by-step video tutorial:


Reviews
There are no reviews yet.