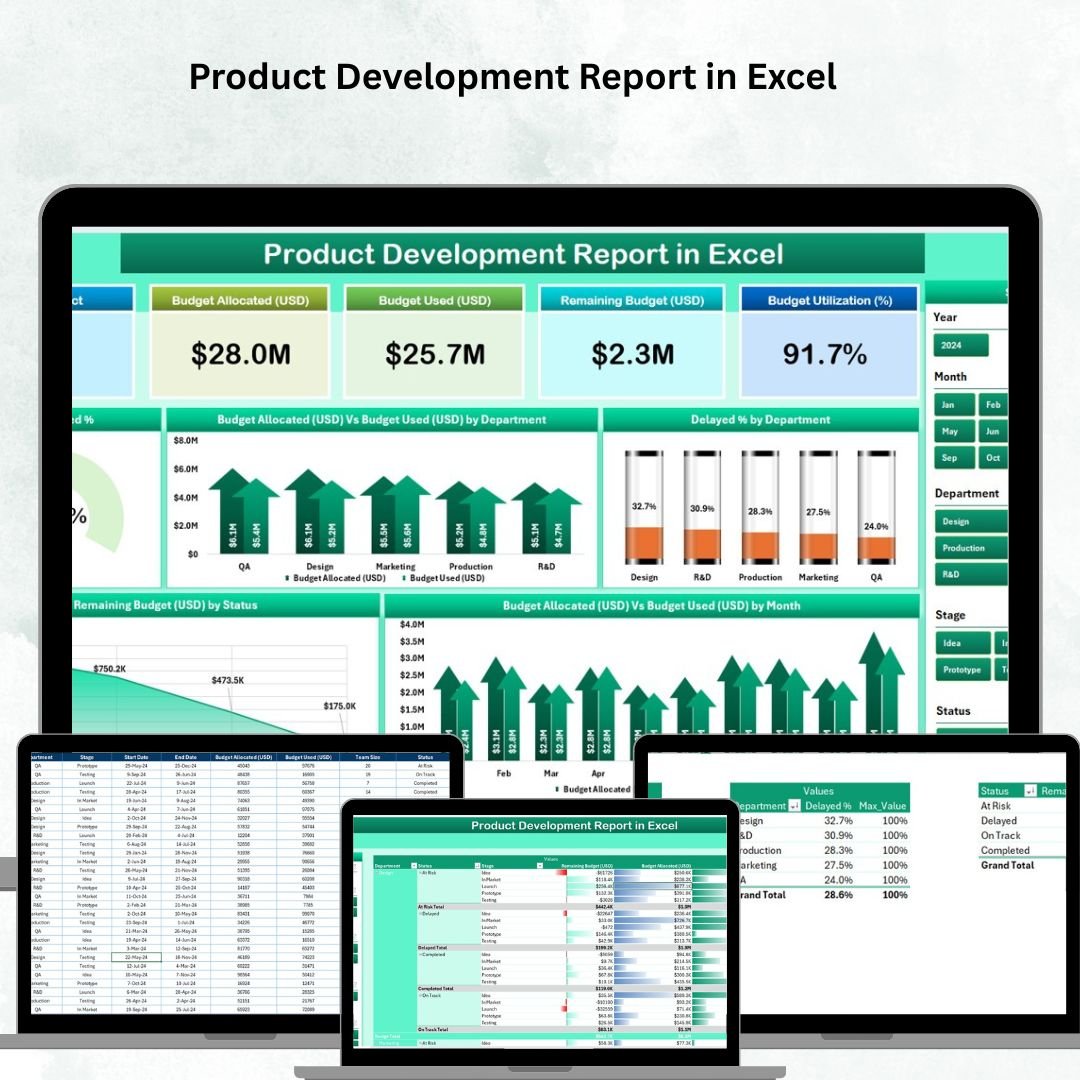
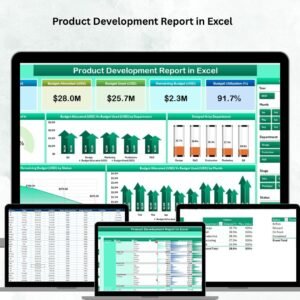
Managing product development requires clarity, structure, and timely insights. Without a proper reporting system, businesses risk overspending, delayed timelines, and missed opportunities. That’s why we created the Product Development Report in Excel — a ready-to-use template designed to simplify monitoring, track budgets, and highlight progress in a clear, visual format.
This report ensures that every manager, team leader, and stakeholder can instantly analyze performance, identify delays, and manage costs effectively. With interactive dashboards, slicers, and charts, you gain complete visibility into product development at every stage.
🔑 Key Features of Product Development Report in Excel
-
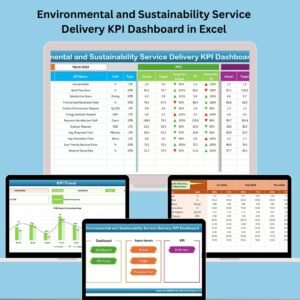
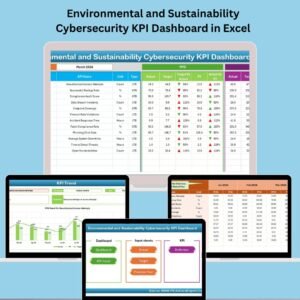
📊 3 Interactive Pages – Summary, Report Page, and Data Sheet.
-
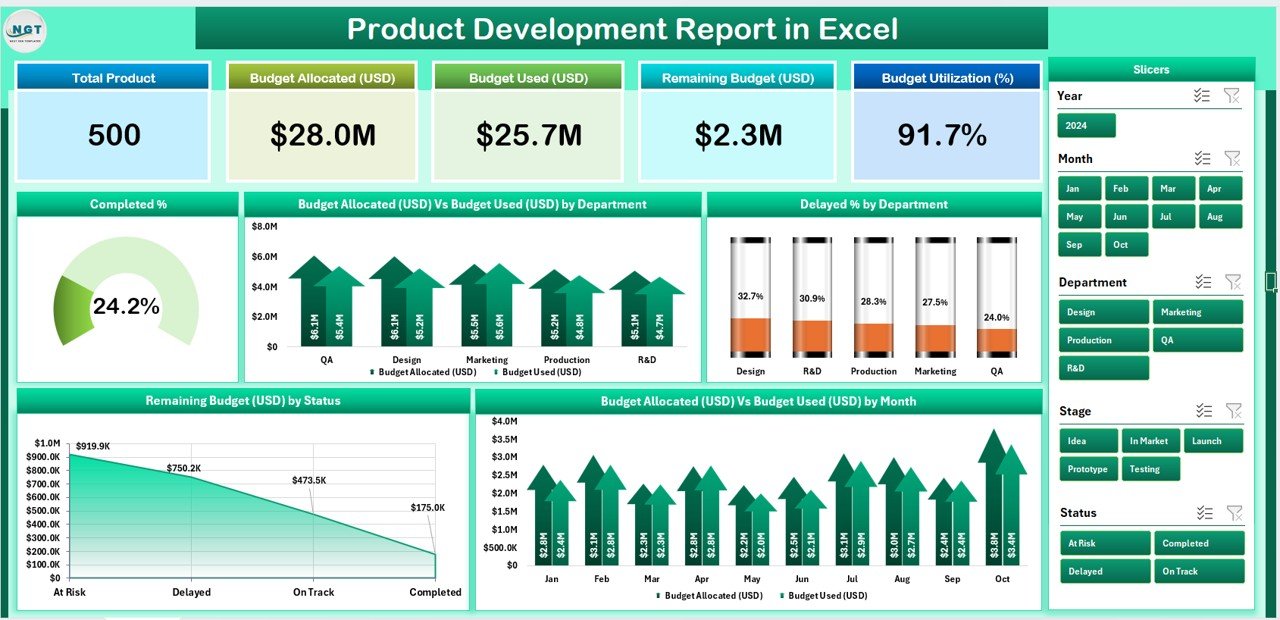
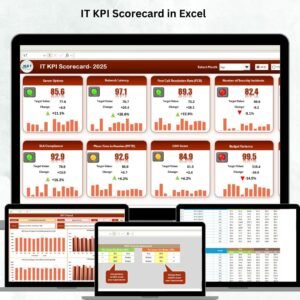
📌 5 Dashboard Cards – Instantly view top-level KPIs like completed products, budgets, and delays.
-
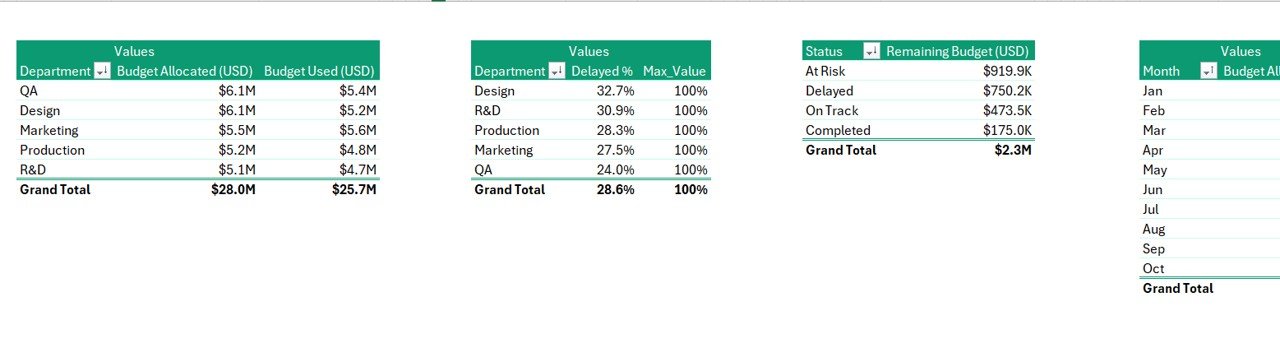
🎯 Budget Tracking – Compare Budget Allocation vs. Budget Used by department and by month.
-
⏱ Delay Monitoring – Identify % of delayed projects by department.
-
🖥 Slicer Control – Filter data easily by month, status, or department.
-
📈 Charts & Graphs – Clear visuals to spot trends and track remaining budgets.
-
📂 Data Sheet & Support Sheet – Structured backend for smooth data management.
-
✅ Customizable – Modify KPIs and categories to fit your organization.
📂 What’s Inside the Product Development Report
This Excel-based template comes with three main pages and a support sheet:
-
Summary Page
-
Displays 5 key charts:
-
Completed Product Count
-
Budget Allocation (USD) vs. Budget Used (USD) by Department
-
Delayed % by Department
-
Remaining Budget (USD) by Status
-
Budget Allocation (USD) vs. Budget Used (USD) by Month
-
-
Top cards give a snapshot of overall progress.
-
Right-side slicer for quick filtering.
-
-
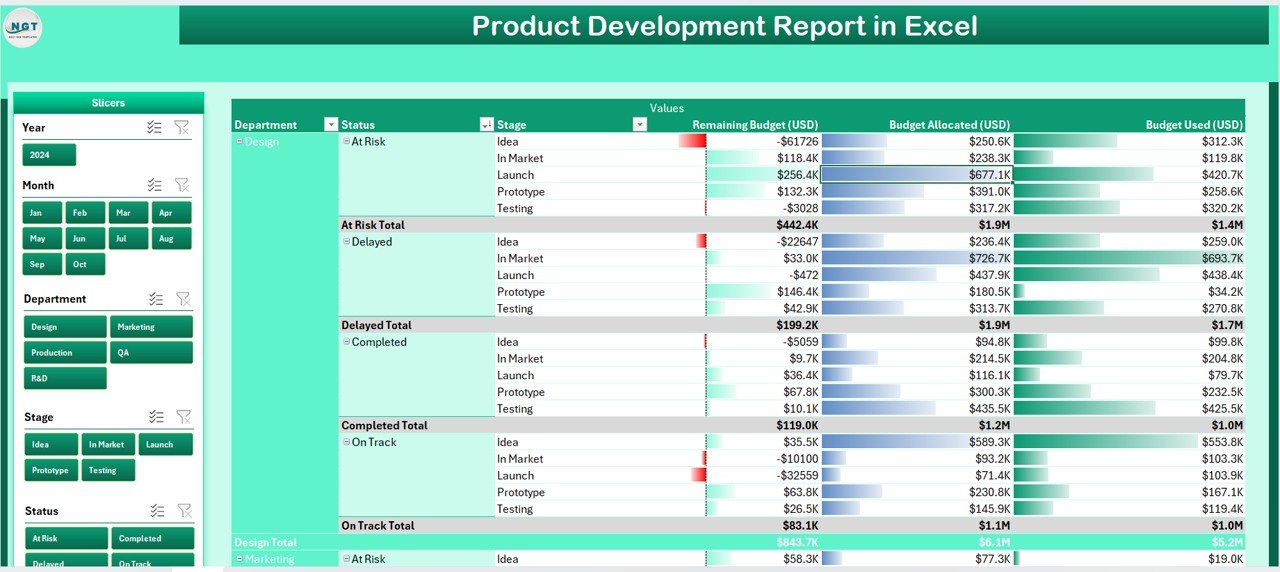
Report Page
-
Left-side slicer for department or product filtering.
-
Information table for detailed performance analysis.
-
-
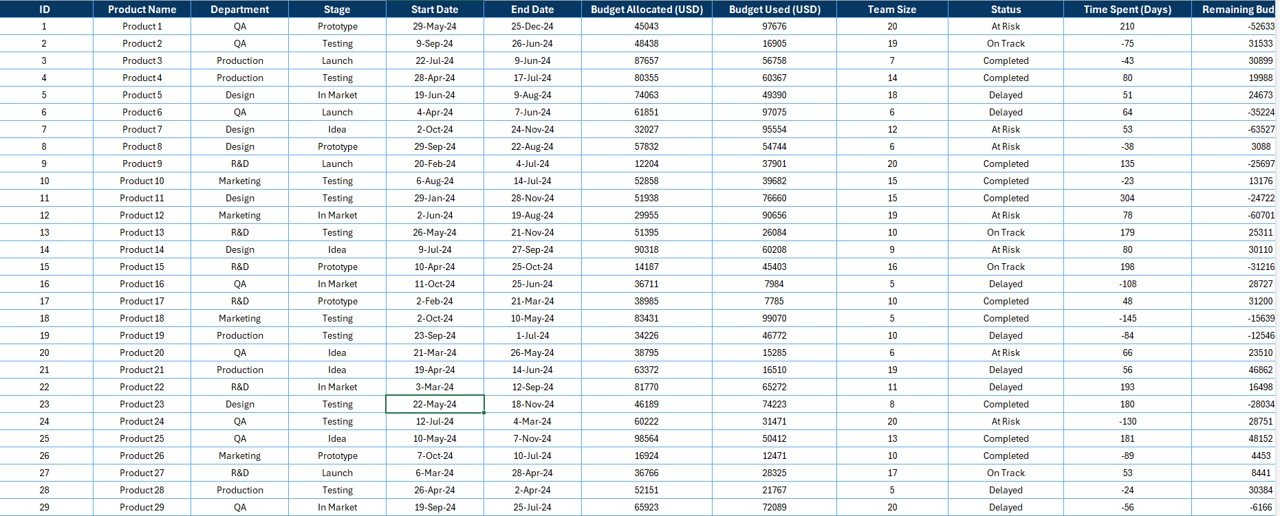
Data Sheet
-
The engine powering the report.
-
Store raw data here to keep dashboards automatically updated.
-
-
Support Sheet
-
Helps with dropdowns and reference data.
-
Keeps the main report organized and error-free.
-
🛠 How to Use the Product Development Report
-
Enter Data – Update the Data Sheet with product details, budgets, and statuses.
-
Refresh Dashboards – Summary and Report pages update automatically.
-
Filter with Slicers – Narrow down insights by month, department, or product.
-
Analyze Charts – Review budget usage, delays, and completion rates.
-
Take Action – Address delays, reallocate budgets, and improve timelines.
👥 Who Can Benefit from This Product Development Report?
-
🏭 Manufacturers – Track costs, delays, and product launches.
-
💻 Tech Startups – Manage development budgets and team efficiency.
-
🛍 Retail & Consumer Goods – Monitor product rollouts across multiple categories.
-
🏗 Construction & Engineering Firms – Track timelines, costs, and project completion.
-
📊 Project Managers – Gain clarity on progress and bottlenecks.
-
💼 Executives & Stakeholders – Review performance at a glance with KPIs.
✅ Why Choose This Report?
Unlike generic spreadsheets, this Excel template is structured, visual, and user-friendly. It saves hours of manual reporting and ensures that your entire team works with real-time, accurate, and transparent data.
Click here to read the Detailed blog post
👉 Visit our YouTube channel to learn step-by-step video tutorials


Reviews
There are no reviews yet.