Managing procurement efficiently is essential for every organization. From controlling spending to improving supplier performance, procurement teams carry huge responsibility. But most teams still rely on scattered spreadsheets, last-minute reports, and manual calculations. This not only slows down the procurement cycle—it also hides savings opportunities, increases risks, and creates confusion across departments. That’s why the Procurement Analytics KPI Dashboard in Excel is the smartest and most practical solution for modern procurement teams.
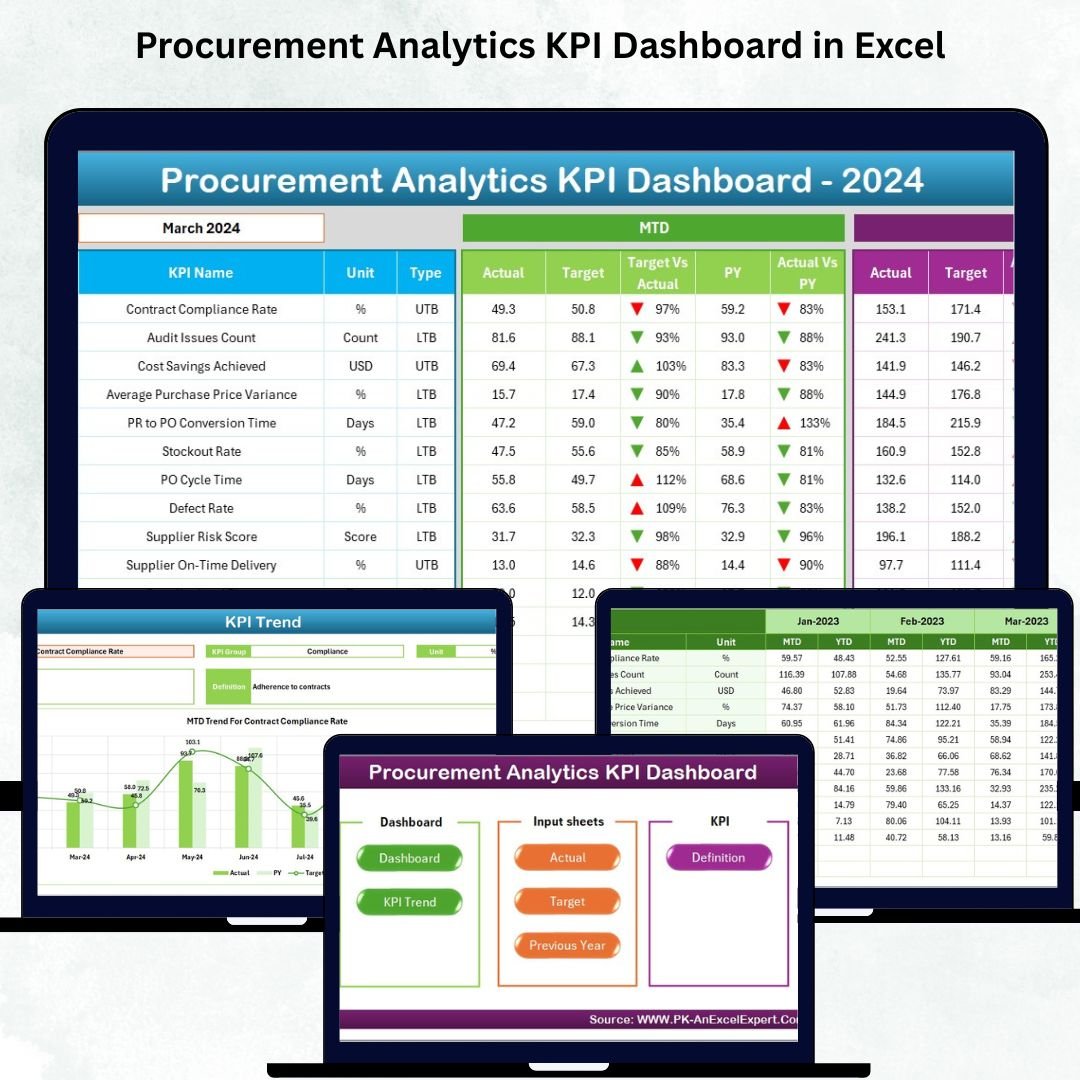
This ready-to-use dashboard brings all procurement insights into one interactive Excel file. It helps teams track MTD (Month-to-Date), YTD (Year-to-Date), Previous Year (PY), and Target performance with clean visuals, dynamic formulas, and automated comparisons. With this dashboard, procurement managers, analysts, and finance teams can make faster, more accurate, and more strategic decisions using real-time insights.
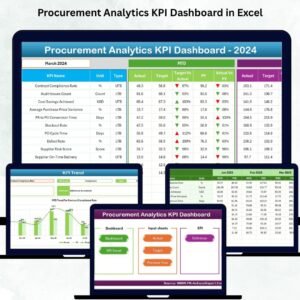
Built with simplicity and flexibility in mind, this dashboard offers a structured view of the most important procurement KPIs—including spend visibility, supplier performance, on-time delivery, savings achieved, contract compliance, cycle times, and inventory accuracy. Since the file uses Excel formulas and dynamic ranges, organizations can easily add, modify, or expand KPIs based on their internal policies.
🚀 Key Features of the Procurement Analytics KPI Dashboard in Excel
This dashboard includes powerful features that enhance efficiency and improve procurement reporting:
📊 ✔ Real-Time MTD & YTD Tracking
Instantly view Month-to-Date and Year-to-Date performance with automated formulas that update based on the selected month.
🎯 ✔ Target vs Actual Insights
Quickly identify performance gaps with percentage calculations and conditional formatting arrows (▲ ▼).
📈 ✔ Trend Analysis Charts
Analyze monthly movements, seasonal patterns, supplier delays, and cycle time variations with trend charts.
🧮 ✔ Dynamic Formulas & Dropdowns
Select the month from a drop-down list (D3) and watch the entire dashboard update instantly.
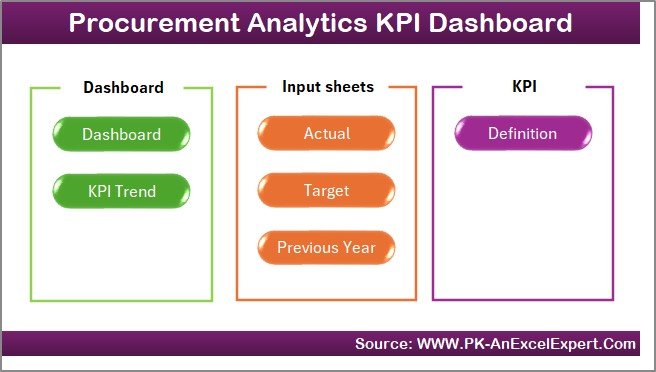
📂 ✔ 7 Structured Worksheets
Includes Home, Dashboard, Trend Page, Actuals, Targets, Previous Year, and KPI Definitions.
🔁 ✔ Fully Refreshable & Customizable
Update Excel sheets and the dashboard recalculate automatically—no complex setup needed.
📦 What’s Inside the Procurement Analytics KPI Dashboard
The dashboard contains 7 professionally designed worksheets, each playing a key role:
⭐ 1. Home Sheet
✔ Clean index page
✔ Buttons for easy navigation
✔ Quick access to Dashboard, Trend Sheet, Actuals, Targets, Previous Year & Definitions
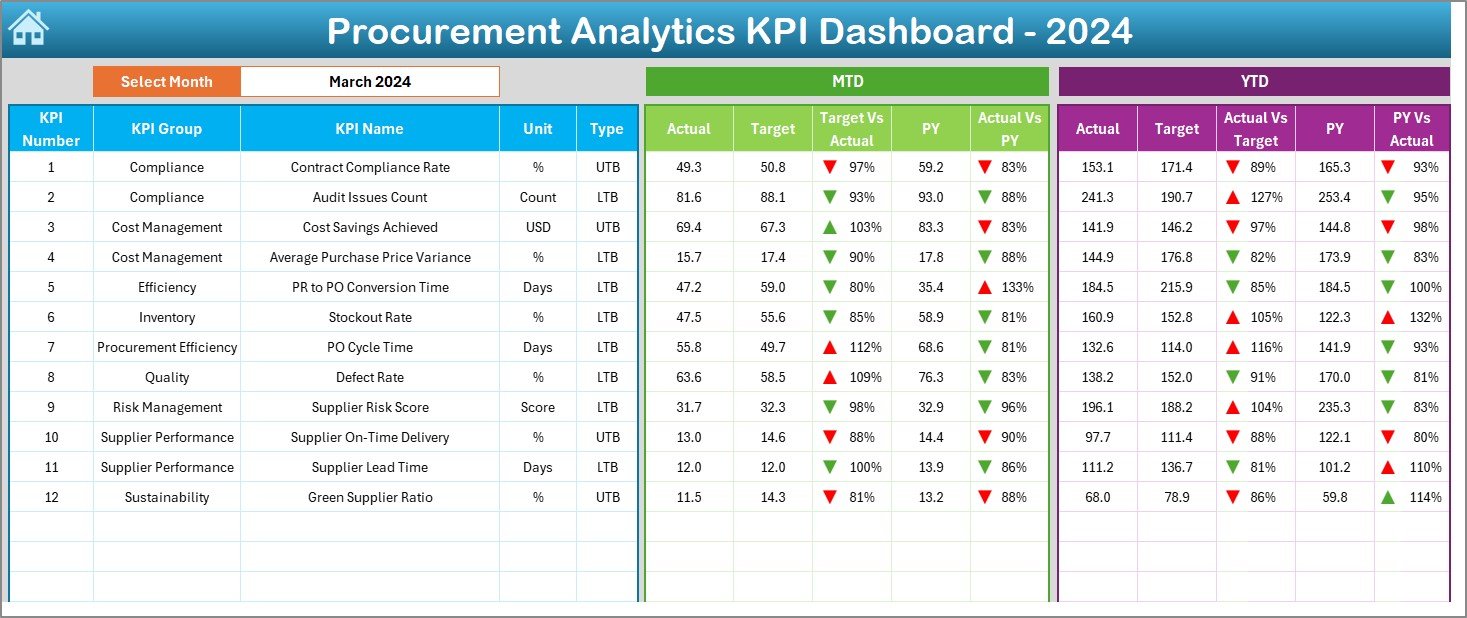
⭐ 2. Dashboard Sheet
✔ Month selection drop-down
✔ MTD and YTD sections
✔ Target vs Actual %
✔ PY vs Actual %
✔ Green ▲ and red ▼ icons
✔ Visual summaries of procurement efficiency
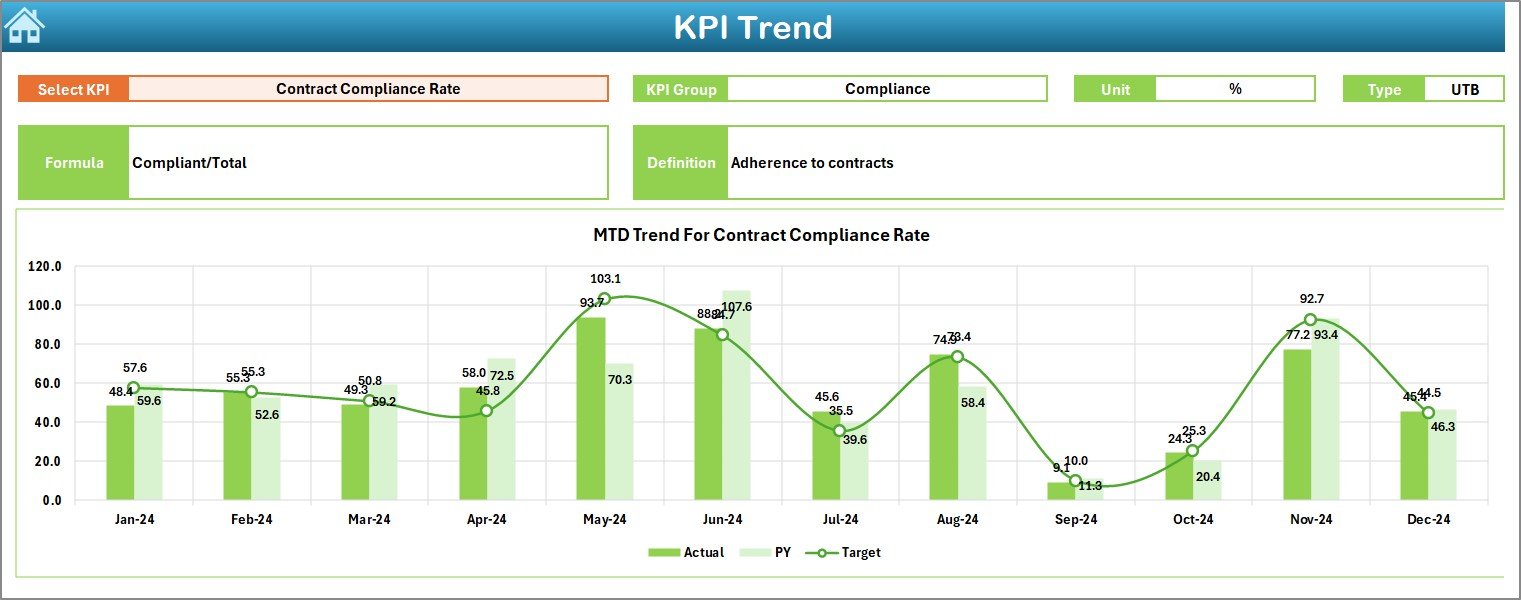
⭐ 3. KPI Trend Sheet
✔ Select any KPI to view monthly trends
✔ KPI details: Group, Unit, Type, Formula, Definition
✔ MTD & YTD trend charts
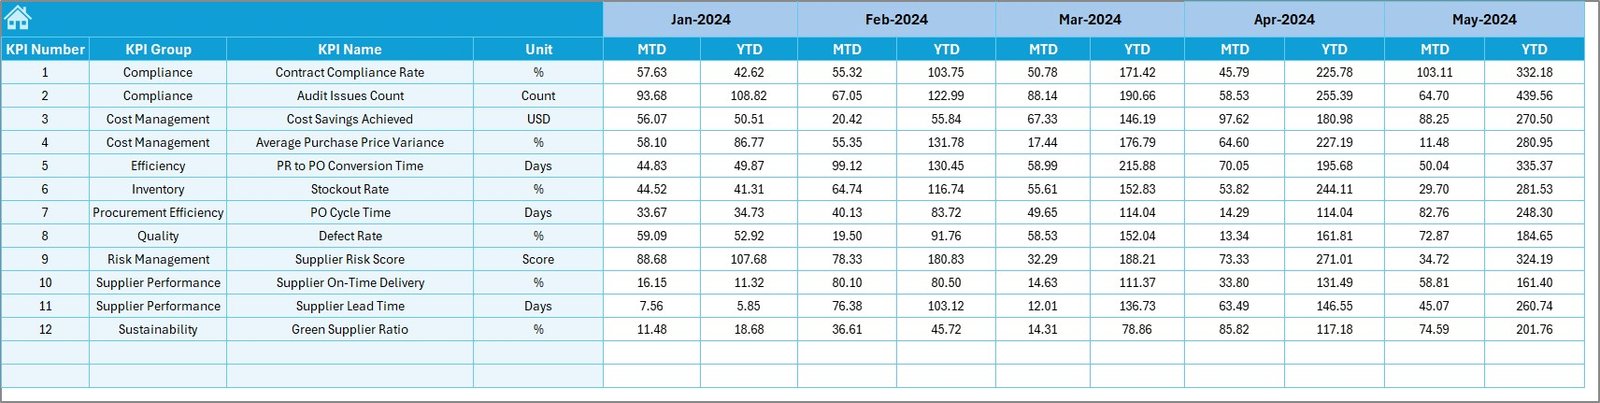
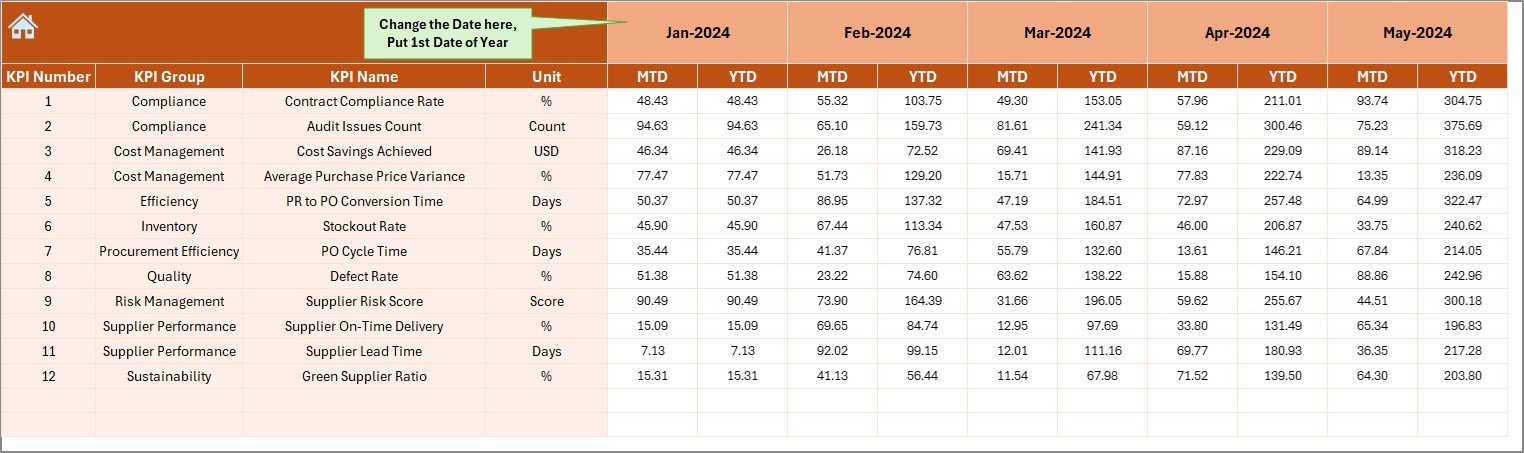
⭐ 4. Actual Numbers Input Sheet
✔ Enter KPI Name, Month, MTD, and YTD
✔ Dashboard auto-calculates
✔ Update first month from cell E1
⭐ 5. Target Sheet
✔ Define monthly and yearly targets
✔ Align goals with budget, compliance, and performance metrics
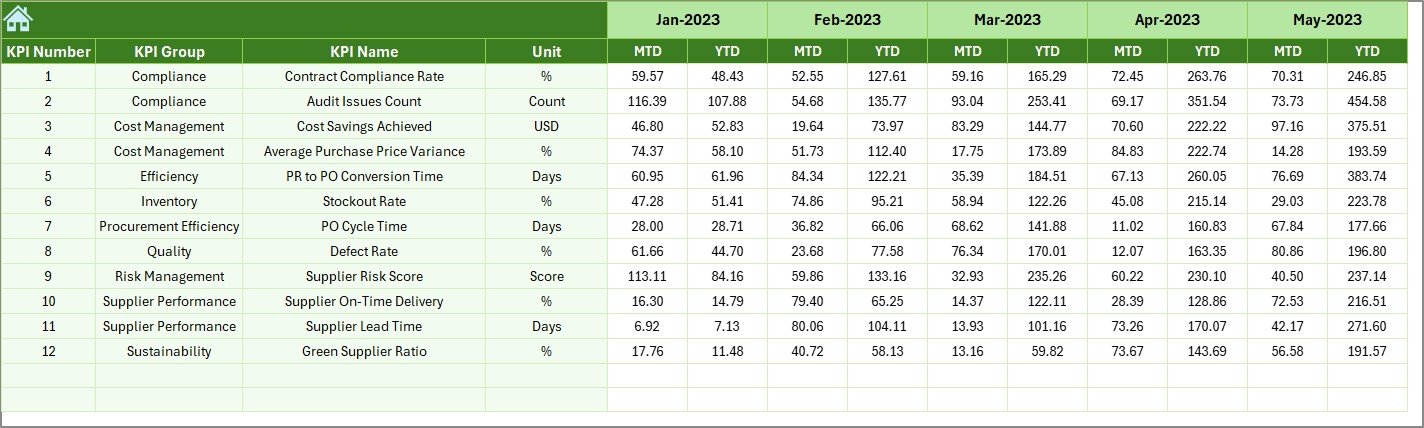
⭐ 6. Previous Year Sheet
✔ Store historical data for comparison
✔ Helps identify supplier improvements and spending changes
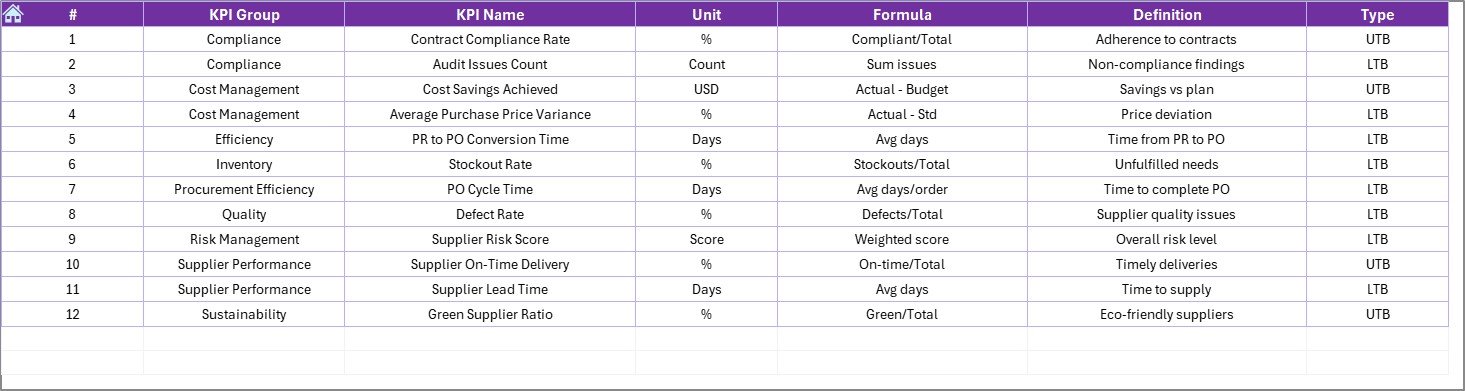
⭐ 7. KPI Definition Sheet
✔ KPI names, formulas, and definitions
✔ Supports standardization and training
🧭 How to Use the Procurement Dashboard
Using the dashboard is simple and intuitive:
🔹 Step 1: Enter Data
Update Actuals, Targets, and Previous Year sheets with monthly procurement numbers.
🔹 Step 2: Select the Month
Choose the month from cell D3 and let Excel refresh the entire dashboard instantly.
🔹 Step 3: Analyze Performance
Compare Actual vs Target, CY vs PY, and track monthly and annual trends.
🔹 Step 4: Review Trends
Use the KPI Trend Sheet to identify slow-moving suppliers, rising costs, or cycle time delays.
🔹 Step 5: Improve Decision-Making
Use insights to plan negotiations, update sourcing strategies, and manage spend efficiently.
👥 Who Can Benefit from This Procurement Dashboard
This dashboard is perfect for:
💼 Procurement Managers
Monitor spend, supplier performance, and annual savings.
📊 Business & Data Analysts
Track KPIs, trends, and performance insights.
💰 Finance Teams
Analyze purchasing impact on budget and cost optimization.
🏢 Supply Chain Leaders
Gain visibility over procurement trends and operational efficiency.
This template is built for real-world use—simple for beginners, powerful for experts.


Reviews
There are no reviews yet.