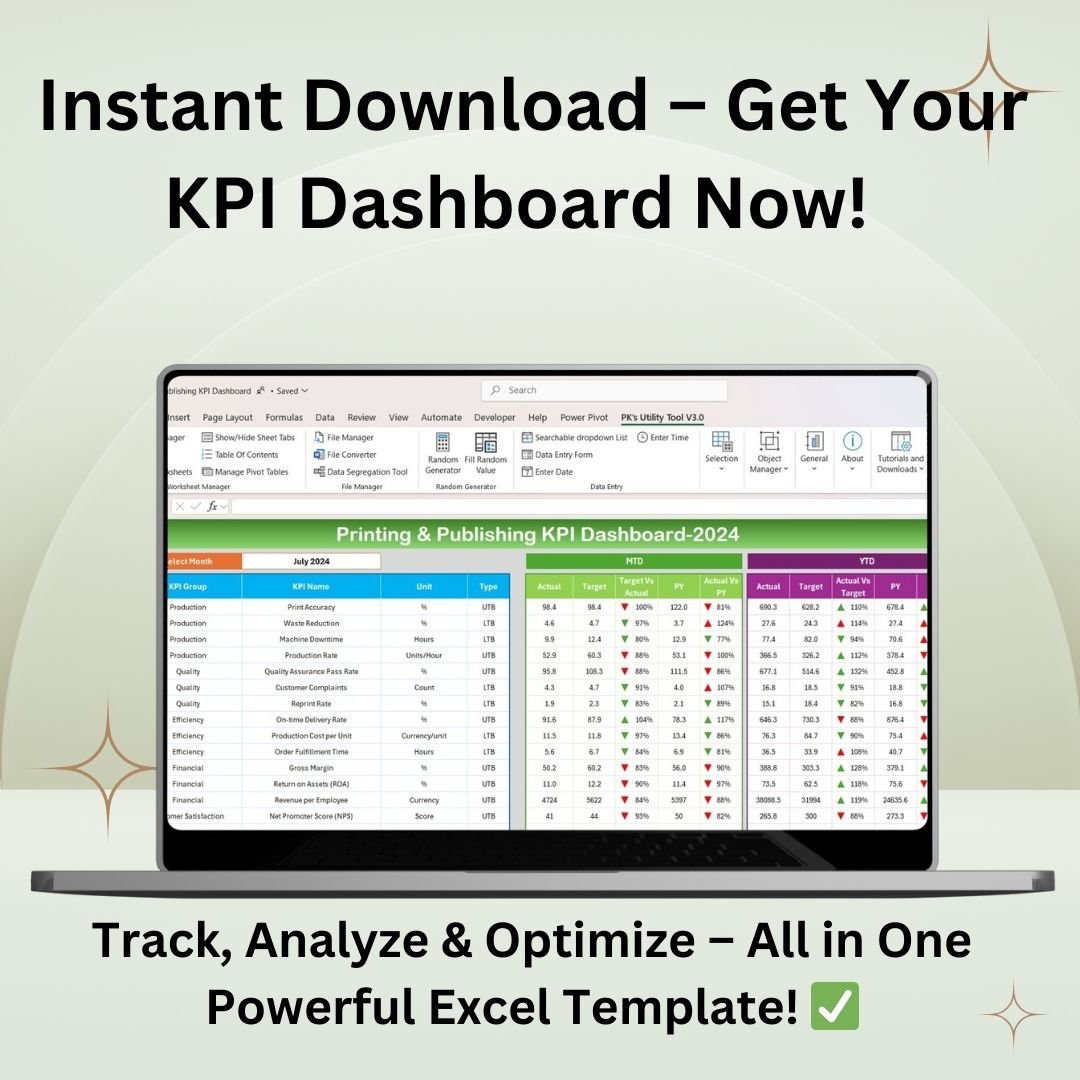


Track, Analyze, and Optimize Performance with Ease
The Printing & Publishing KPI Dashboard in Excel is a powerful and well-structured tool designed to help businesses in the printing and publishing industry track key performance indicators (KPIs) efficiently. This dashboard offers a comprehensive overview of monthly and yearly metrics, enabling data-driven decision-making with interactive reports and automated calculations.
Key Features
✅ Pre-Designed KPI Dashboard: Track and analyze KPIs with a well-structured and professional Excel template.
✅ Automated Calculations: The dashboard updates dynamically based on actual, target, and previous year data.
✅ User-Friendly Interface: Easy navigation with an intuitive home page and clearly defined sheets.
✅ Visual Data Representation: Conditional formatting, trend charts, and performance indicators help interpret data effectively.
✅ Customizable KPI Definitions: Modify or add KPIs as per your business needs.
What’s Inside?
This KPI Dashboard consists of seven structured sheets, each serving a distinct function to streamline data input, monitoring, and visualization.
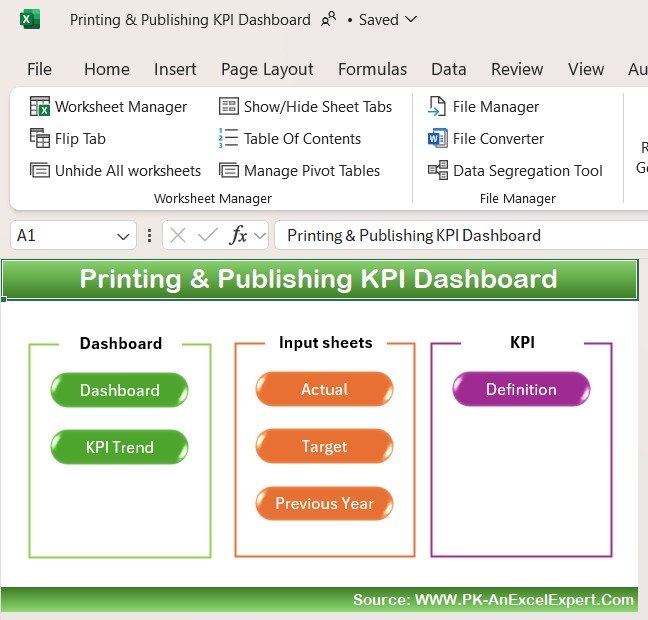
1. Home Sheet – The Control Center
The Home Sheet is the starting point of the dashboard, acting as an index page with six navigational buttons that provide instant access to key sections.
- Ensures quick access to different sheets.
- Enhances usability and efficiency with a simple layout.
- Serves as the main hub for monitoring KPI data.
💡 Navigation Made Easy! Jump to any section with a single click.
2. Dashboard Sheet – A Holistic Performance Overview
The Dashboard Sheet is the core of this template, providing a complete snapshot of monthly and yearly performance.
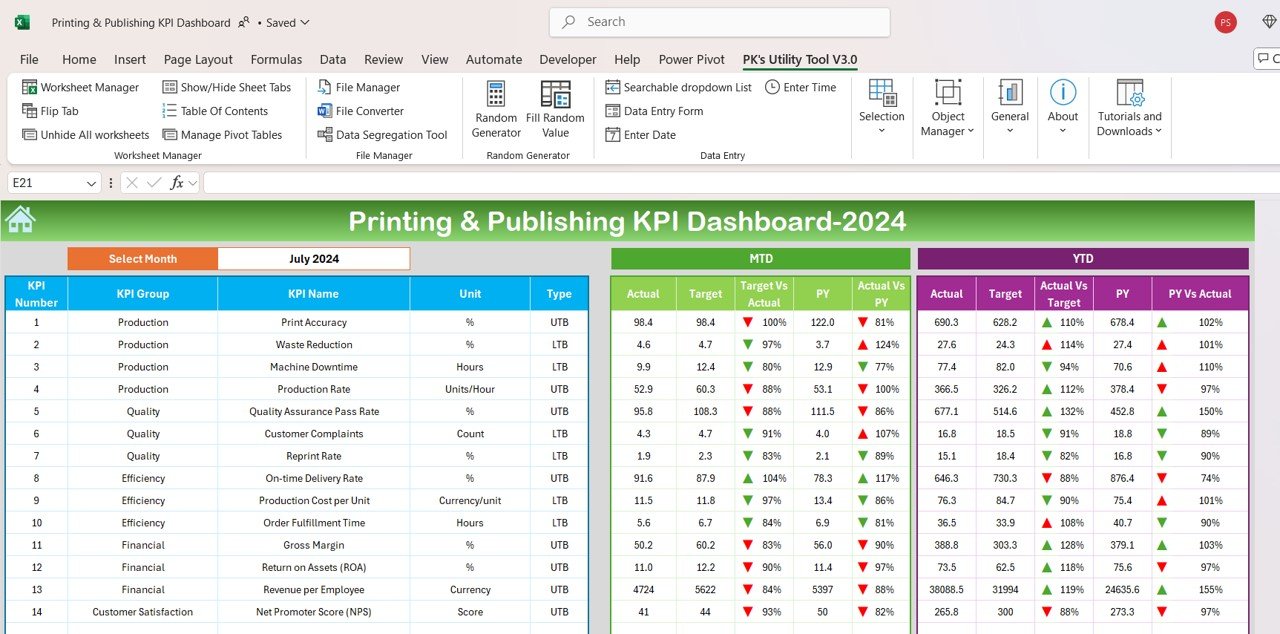
📊 Key Metrics Displayed:
- Month-to-Date (MTD) Data: View actual vs. target performance with real-time indicators.
- Year-to-Date (YTD) Data: Compare actual, target, and previous year data with up/down arrows indicating trends.
- Dynamic Month Selection: Choose a specific month, and the dashboard automatically updates.
🔍 Why It’s Powerful?
✔ Real-time performance insights with instant updates.
✔ Visual indicators (green/red arrows) for quick analysis.
✔ Automated comparisons for better decision-making.
3. KPI Trend Sheet – Monitor Performance Over Time
The KPI Trend Sheet allows you to analyze historical trends for each KPI, helping you understand long-term performance patterns.
📌 What This Sheet Offers:
- Dropdown Selection (Cell C3): Choose a KPI, and the sheet updates dynamically.
- Key KPI Details: Includes KPI Group, Unit, and Type (Higher/Lower is Better).
- MTD and YTD Trend Charts: Visualizes Actual, Target, and Previous Year data.
📈 Stay Ahead of Trends! Identify performance fluctuations and make data-driven improvements.
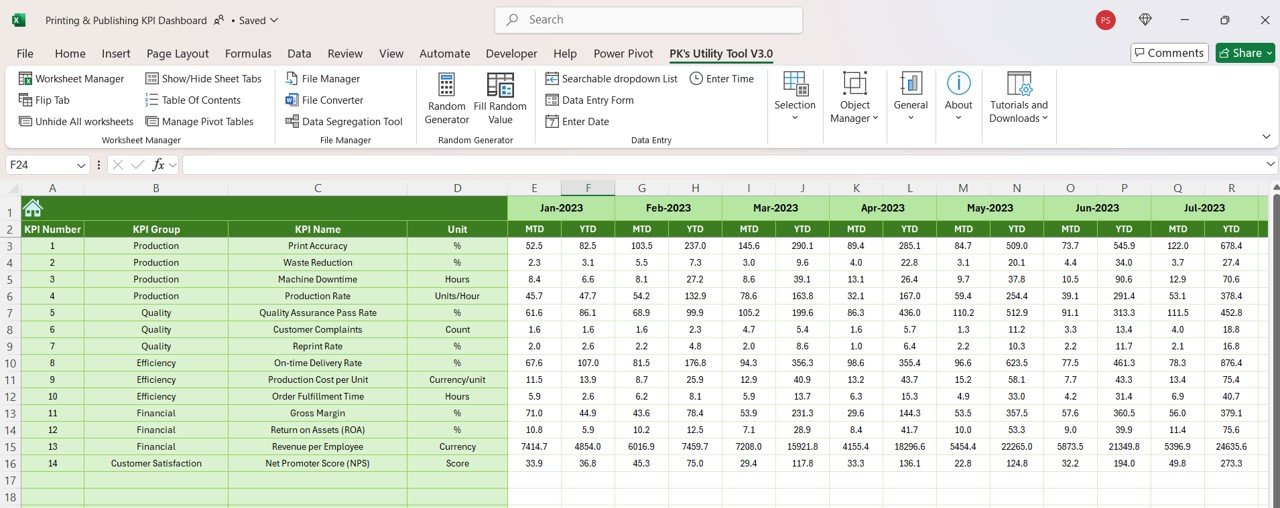
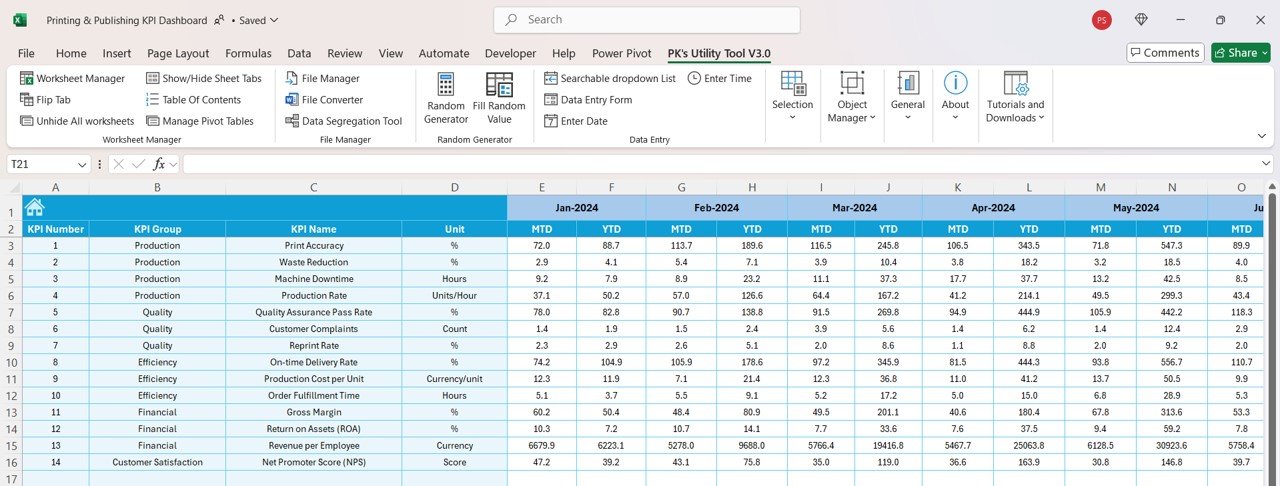
4. Actual Numbers Input Sheet – Record Real-Time Data
This sheet is where you input actual performance figures for each KPI.
✍ Customizable Input Fields:
- Set the first month of the year (Cell E1) for accurate tracking.
- Record MTD and YTD actual data with ease.
- Automatically updates trend charts and dashboard for real-time reporting.
📌 Why This Sheet Matters?
✔ Ensures accurate performance tracking for each metric.
✔ Allows businesses to analyze productivity and efficiency.
5. Target Sheet – Define Your Performance Goals
The Target Sheet is where you set your monthly and yearly KPI targets. This allows the dashboard to compare actual data with targets and highlight deviations.
🎯 Why This Sheet is Essential?
- Helps set realistic performance benchmarks.
- Enables goal-based performance tracking.
- Ensures alignment with business objectives.
6. Previous Year Numbers Sheet – Compare Year-over-Year Performance
This sheet allows you to input last year’s figures, enabling year-over-year comparisons to measure growth and improvements.
📊 Key Benefits:
✔ Track historical performance trends.
✔ Identify areas needing improvement.
✔ Evaluate progress and efficiency.
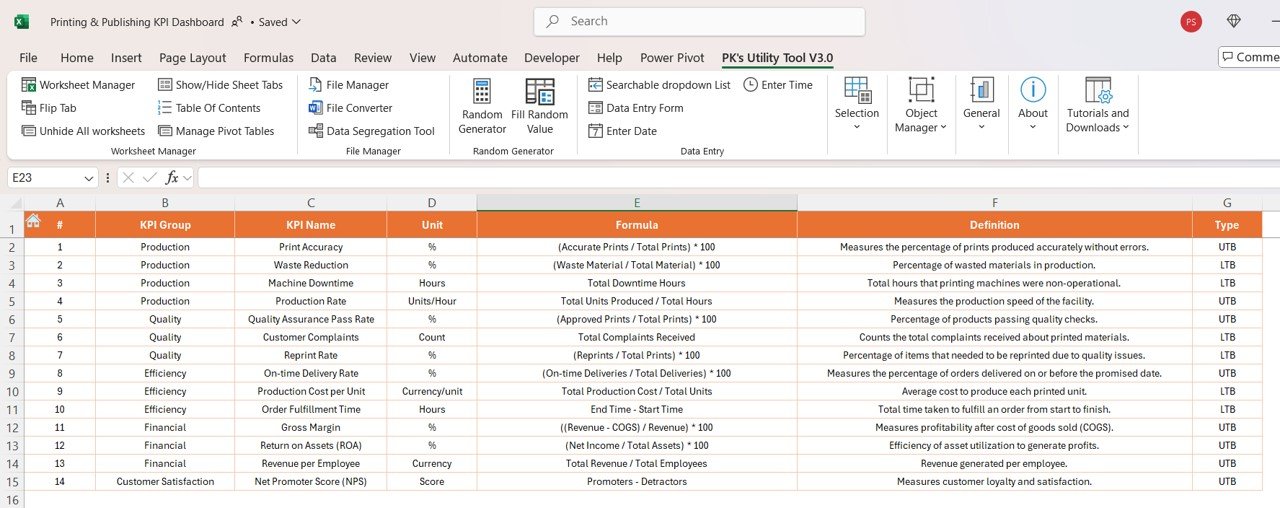
7. KPI Definition Sheet – A Complete KPI Guide
This reference sheet provides detailed explanations of each KPI, ensuring that every metric is clearly understood and accurately tracked.
📌 What You’ll Find Here:
- KPI Name and Group.
- Unit of Measurement.
- Formula for Calculation.
- Definition and Performance Type (UTB/LTB).
📖 Stay Informed! Ensure all KPIs are defined and tracked consistently.
Why Choose This KPI Dashboard?
✅ Fully Automated: Eliminates manual calculations with real-time data updates.
✅ Professionally Designed: A structured and visually appealing layout for easy use.
✅ Customizable: Modify KPI formulas and categories based on your business needs.
✅ Excel-Based: No additional software required, works seamlessly in Microsoft Excel.
✅ Data-Driven Decisions: Helps optimize operations, improve quality, and increase efficiency.
📢 Ideal for:
✔ Printing & Publishing Businesses
✔ Production & Quality Teams
✔ Financial Analysts & Managers
✔ Efficiency & Operations Experts
🔥 Start Tracking Performance Like a Pro!
Get Your Copy Today!
The Printing & Publishing KPI Dashboard in Excel is a must-have tool for businesses looking to improve productivity, quality, and financial performance.
💡 Optimize Your Business Operations Now!


Reviews
There are no reviews yet.