Pricing is one of the most powerful growth levers in any business. Even small pricing adjustments can significantly impact revenue, profitability, and market positioning. However, many organizations still evaluate pricing decisions using intuition, static reports, or fragmented spreadsheets. As a result, margin erosion goes unnoticed, discounting becomes uncontrolled, and pricing strategies drift away from business goals.
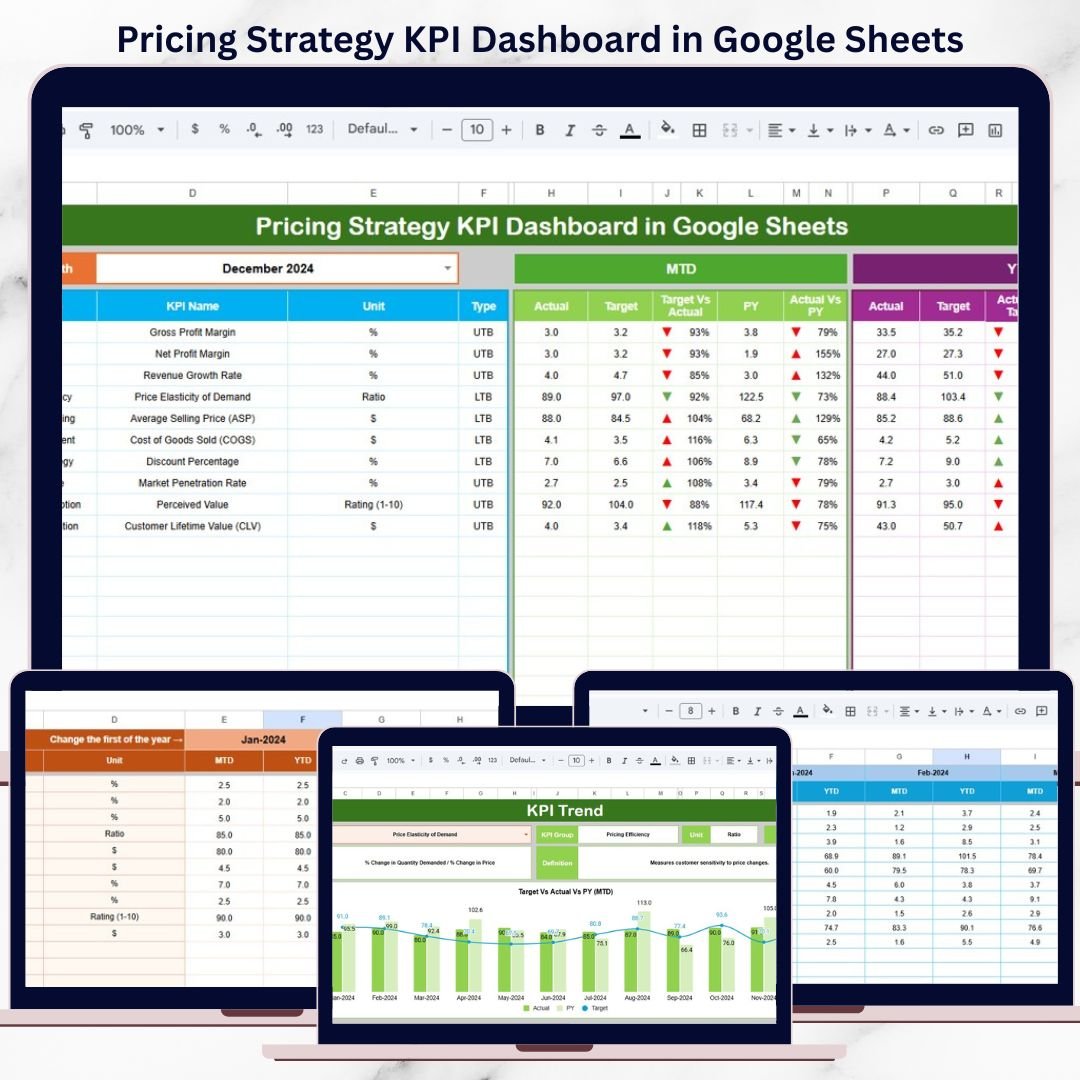
That is exactly why the Pricing Strategy KPI Dashboard in Google Sheets becomes a critical decision-support tool.
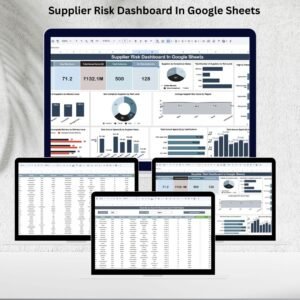
This ready-to-use dashboard transforms pricing data into structured KPIs, comparisons, and trends that reveal how pricing strategies actually perform. It helps pricing managers, finance teams, sales leaders, and executives monitor margin health, revenue impact, discount effectiveness, and pricing consistency—using real data instead of assumptions. With automated calculations and visual indicators, teams can react faster to market changes and protect profitability without relying on expensive analytics software.
Because the dashboard is built entirely in Google Sheets, it remains simple, collaborative, and flexible for organizations of all sizes.
✨ Key Features of the Pricing Strategy KPI Dashboard in Google Sheets
📊 1. MTD & YTD Pricing Performance Tracking
Track Month-to-Date and Year-to-Date pricing KPIs to understand short-term performance and long-term strategy effectiveness at the same time.
🎯 2. Target vs Actual & Previous-Year Comparison
Compare actual pricing results against defined targets and last year’s benchmarks to identify gaps, improvements, or pricing risks.
📈 3. Visual Performance Indicators
Conditional formatting arrows provide instant clarity:
-
🟢 Green arrow → favorable pricing trend
-
🔴 Red arrow → unfavorable pricing movement
📉 4. KPI Trend Analysis
Analyze month-wise pricing KPI trends to detect margin pressure, discount creep, or revenue opportunities early.
☁️ 5. Google Sheets-Based & Collaborative
Enable real-time collaboration across pricing, finance, sales, and leadership teams using a single shared dashboard.
📦 What’s Inside the Pricing Strategy KPI Dashboard in Google Sheets
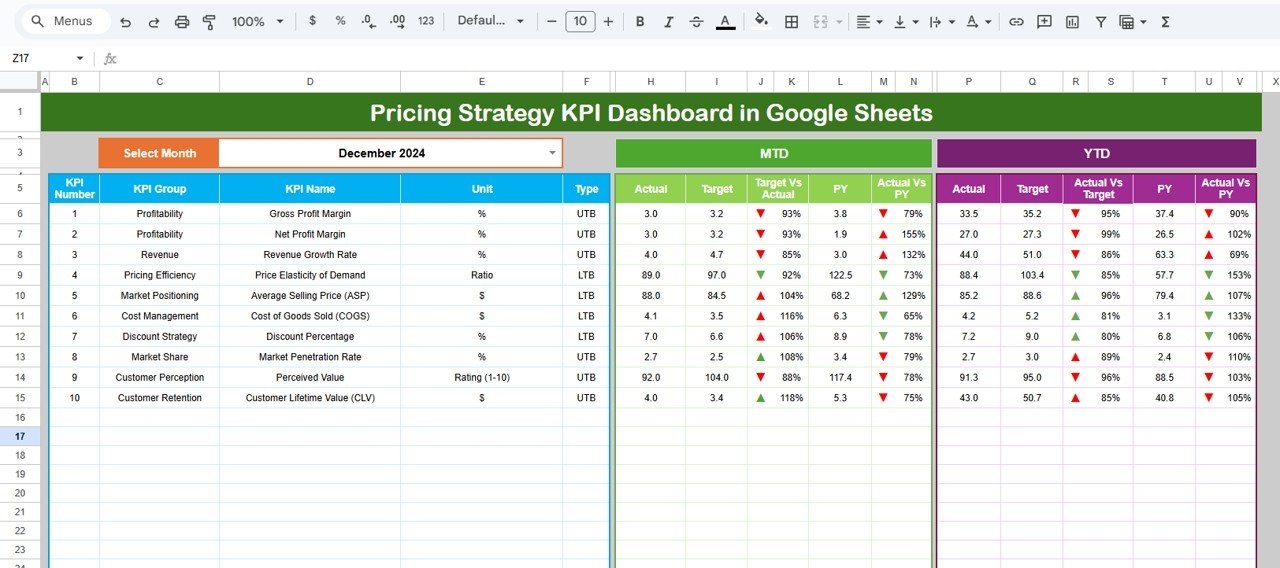
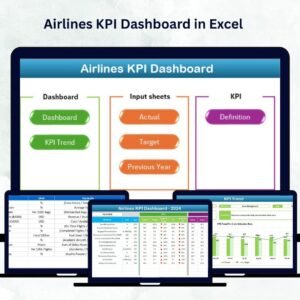
🖥️ Dashboard Sheet Tab (Main Pricing Overview)
This is the executive control panel used during pricing reviews.
Month Selector
-
Located in cell D3
-
Automatically refreshes all KPIs
MTD Metrics Displayed
-
Actual
-
Target
-
Previous Year
-
Target vs Actual
-
Previous Year vs Actual
YTD Metrics Displayed
-
Actual
-
Target
-
Previous Year
-
Target vs Actual
-
Previous Year vs Actual
This structure allows leadership to evaluate pricing performance at a glance.
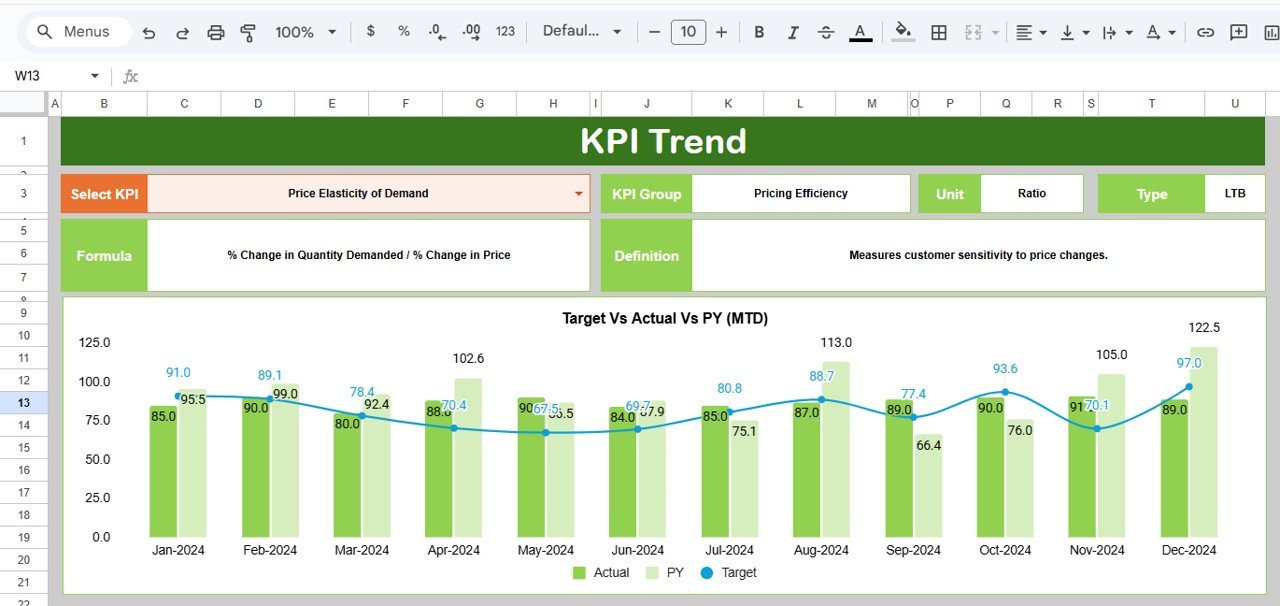
📊 KPI Trend Sheet Tab
This sheet supports detailed analysis of individual pricing KPIs.
How It Works
-
Select a KPI from the dropdown in cell C3
Details Displayed
-
KPI Group
-
KPI Unit
-
KPI Type (UTB / LTB)
-
KPI Formula
-
KPI Definition
Trend Visualization
-
Month-wise KPI movement
-
Pricing volatility patterns
-
Early warning signs
This sheet helps teams understand why pricing performance changes over time.
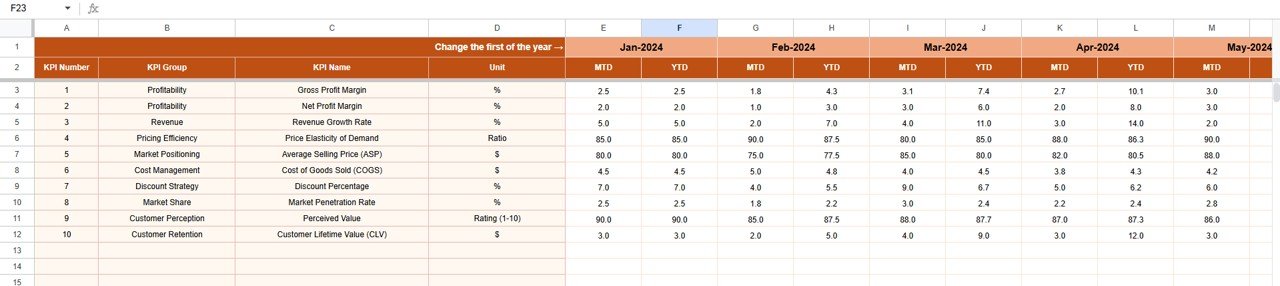
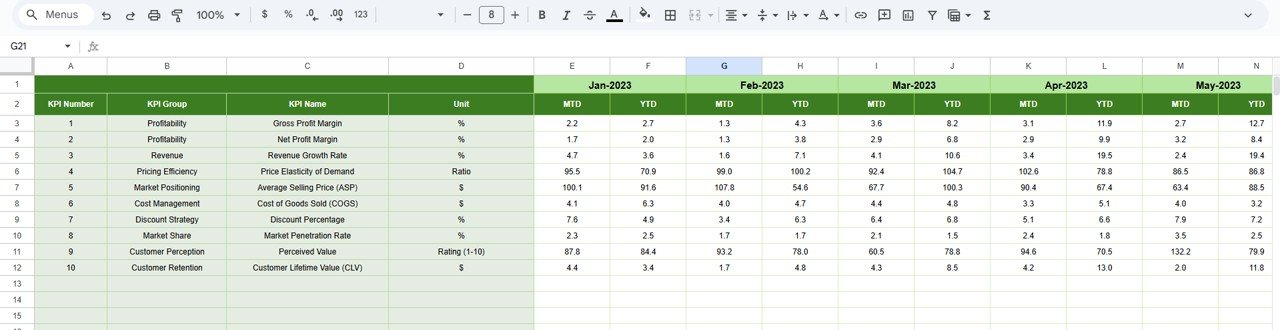
📋 Actual Number Sheet Tab
This is the structured data-entry sheet for pricing results.
-
Enter MTD Actual values
-
Enter YTD Actual values
-
Define the first month of the year in cell E1
All calculations and charts update automatically.
🎯 Target Sheet Tab
This sheet stores pricing goals and benchmarks.
-
Monthly (MTD) pricing targets
-
Annual (YTD) pricing targets
Targets align teams with revenue growth and margin protection objectives.
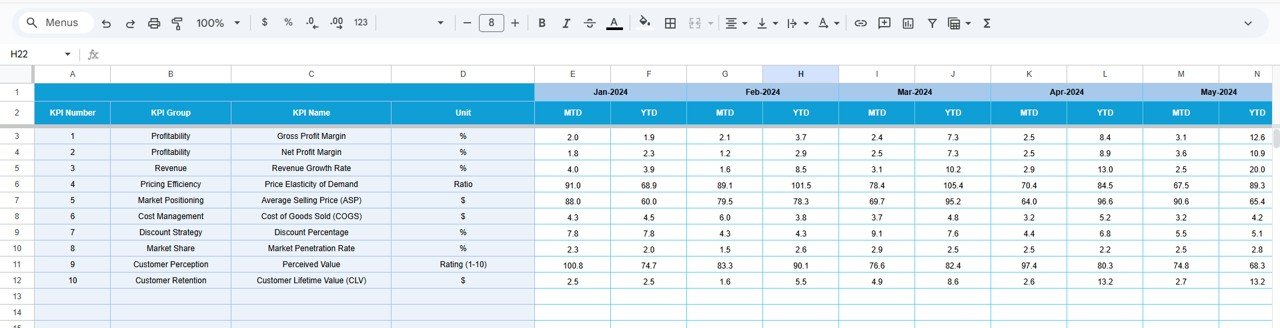
📆 Previous Year Number Sheet Tab
Stores last year’s pricing performance data to support:
-
Year-over-year analysis
-
Market trend evaluation
-
Seasonal pricing insights
Historical context improves strategic pricing decisions.
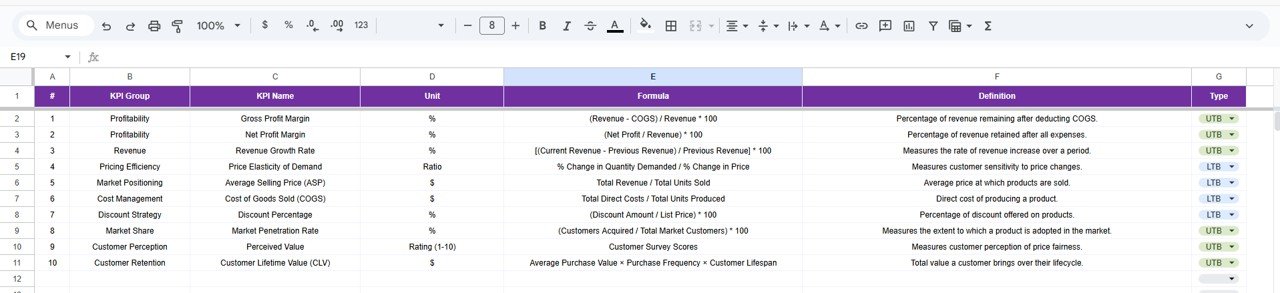
📘 KPI Definition Sheet Tab
This is the governance backbone of the dashboard.
It contains:
-
KPI Name
-
KPI Group
-
Unit
-
Formula
-
KPI Definition
-
KPI Type (UTB / LTB)
This ensures consistent KPI interpretation across all stakeholders.
🎯 Who Can Benefit from This Pricing Strategy KPI Dashboard
💰 Pricing Managers
Monitor pricing effectiveness and protect margins.
📊 Finance Teams
Track profitability impact and pricing discipline.
📈 Sales Leadership
Align discounting behavior with pricing strategy.
🏢 Business Owners & Executives
Make confident, data-driven pricing decisions.
🚀 Organizations of Any Size
Improve pricing maturity without complex tools.


Reviews
There are no reviews yet.