Port Project Management Dashboard in Excel are complex by nature. They involve large budgets, strict timelines, multiple contractors, tight SLAs, and continuous operational risks. Even a small delay or cost overrun can create significant financial and operational impact. That is why port authorities, logistics companies, and infrastructure operators need a clear, centralized, and reliable way to monitor project performance. However, many teams still rely on scattered Excel files, manual status reports, and static presentations. As a result, visibility drops and decision-making becomes slow and reactive.Port Project Management Dashboard in Excel
That is exactly where the Port Project Management Dashboard in Excel becomes a powerful and practical solution.
This ready-to-use Excel dashboard brings all project-related data into one interactive and visually rich reporting system. It converts raw project data into meaningful KPIs, trend analysis, and performance insights. With this dashboard, project managers and leadership teams can monitor cost, schedule, risk, SLA compliance, and profitability from a single screen—without investing in expensive BI tools.’
✨ Key Features of the Port Project Management Dashboard in Excel
📊 Centralized Project Monitoring
All port project KPIs are consolidated into one dashboard, eliminating the need for multiple reports and spreadsheets.
💰 Cost & Profitability Control
Track budgeted cost, actual cost, revenue, and profit to identify overruns and protect margins early.
⏱️ Schedule & Delay Analysis
Monitor planned vs actual duration, average delays, and timeline efficiency across projects.
⚠️ Risk & SLA Visibility
Analyze project risk levels and SLA compliance to reduce operational and financial exposure.
🧩 Fully Customizable Excel Model
Add more KPIs, ports, project types, or contractors easily using standard Excel features.
📦 What’s Inside the Port Project Management Dashboard in Excel
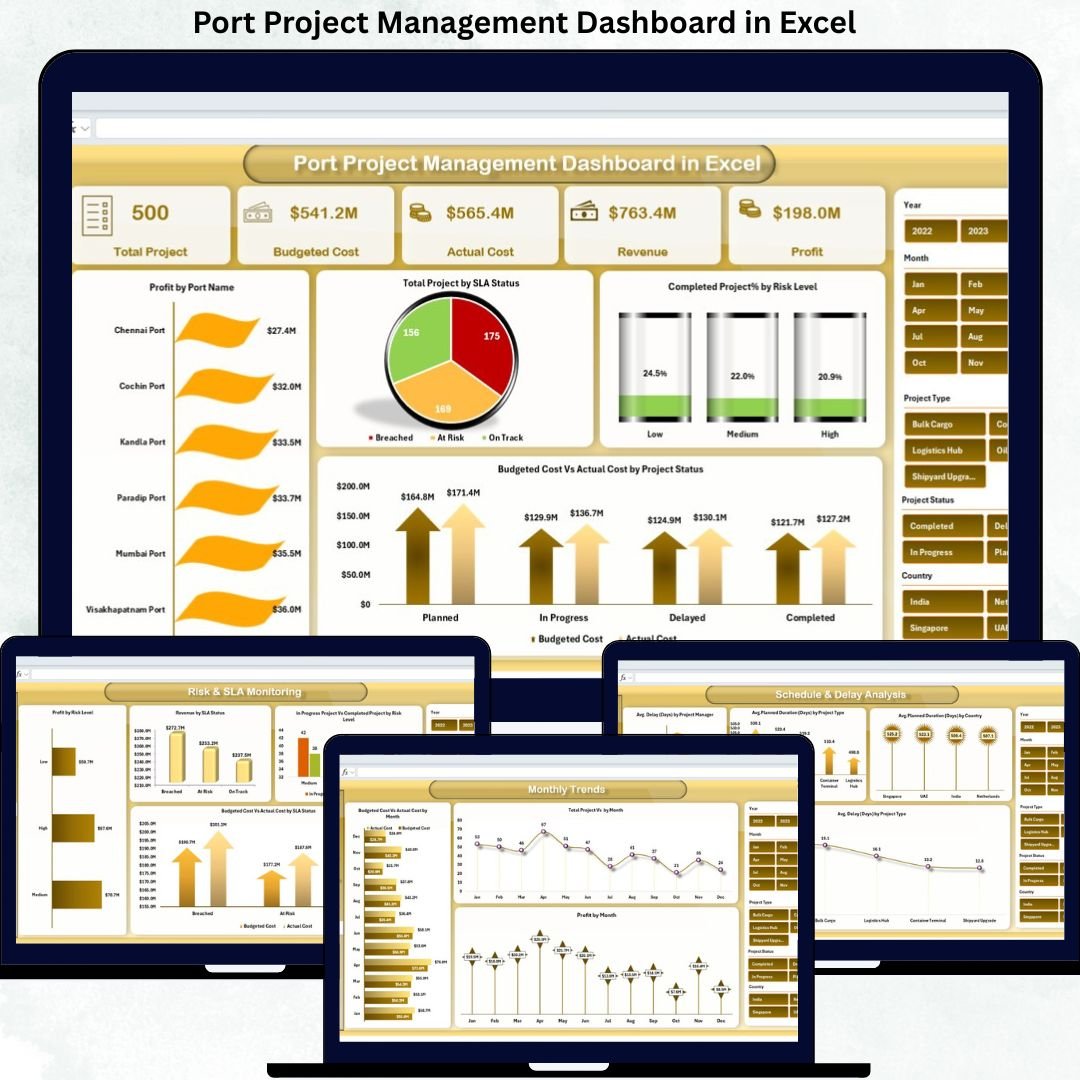
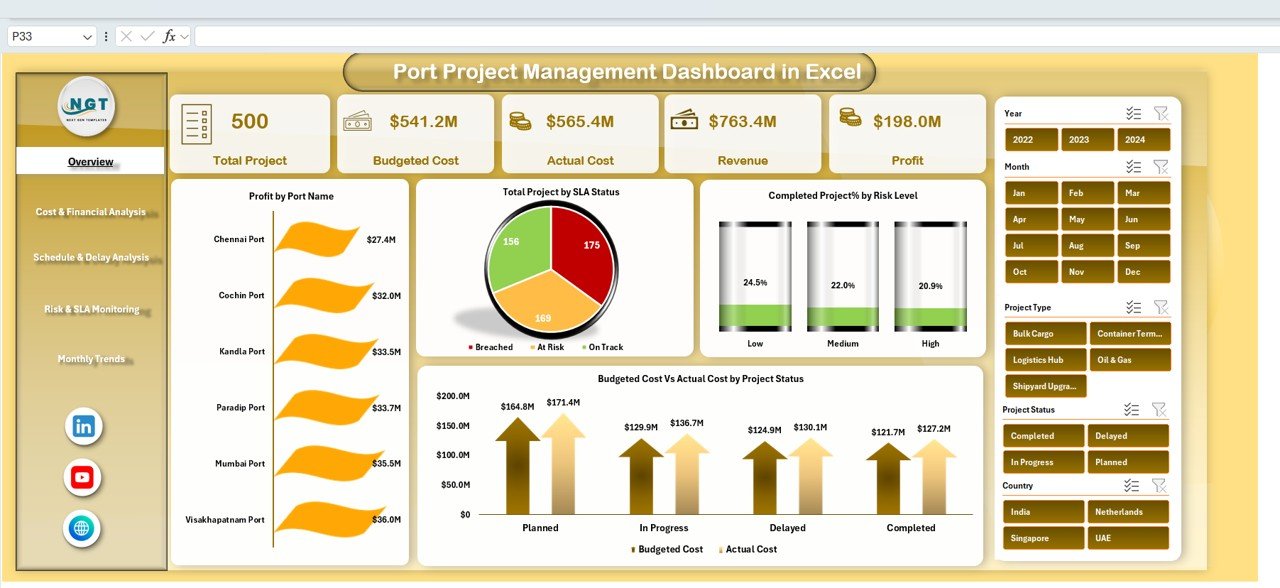
🖥️ Overview Sheet Tab – Executive Summary
The Overview Sheet acts as the command center for the entire dashboard. It provides a quick snapshot of overall project health using KPI cards and charts.
KPI Cards Included
-
Total Project – Number of active port projects
-
Budgeted Cost – Total planned project budget
-
Actual Cost – Cost incurred to date
-
Revenue – Revenue generated from projects
-
Profit – Net profit (Revenue – Actual Cost)
Charts in the Overview Sheet
-
Profit by Port Name – Identifies top-performing ports
-
Total Project by SLA Status – SLA Met, SLA Breached, Under Review
-
Completed Project % by Risk Level – Shows risk impact on delivery
-
Budgeted Cost vs Actual Cost by Project Status – Highlights overruns or savings
These visuals help leadership understand project and financial health instantly.
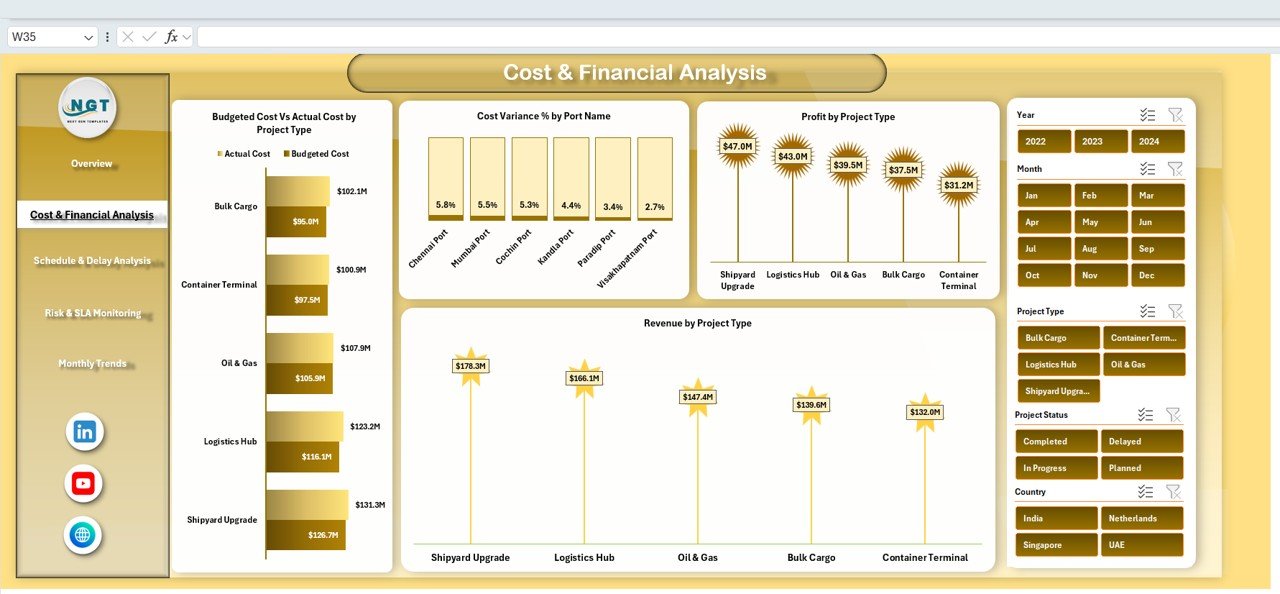
💰 Cost & Financial Analysis
This section focuses on financial governance and margin control.
Charts Included
-
Budgeted Cost vs Actual Cost by Project Type – Identifies high-risk project categories
-
Cost Variance % by Port Name – Highlights strong or weak cost control
-
Profit by Project Type – Shows margin performance
-
Revenue by Project Type – Helps prioritize high-revenue projects
This analysis supports stronger budgeting and financial planning.
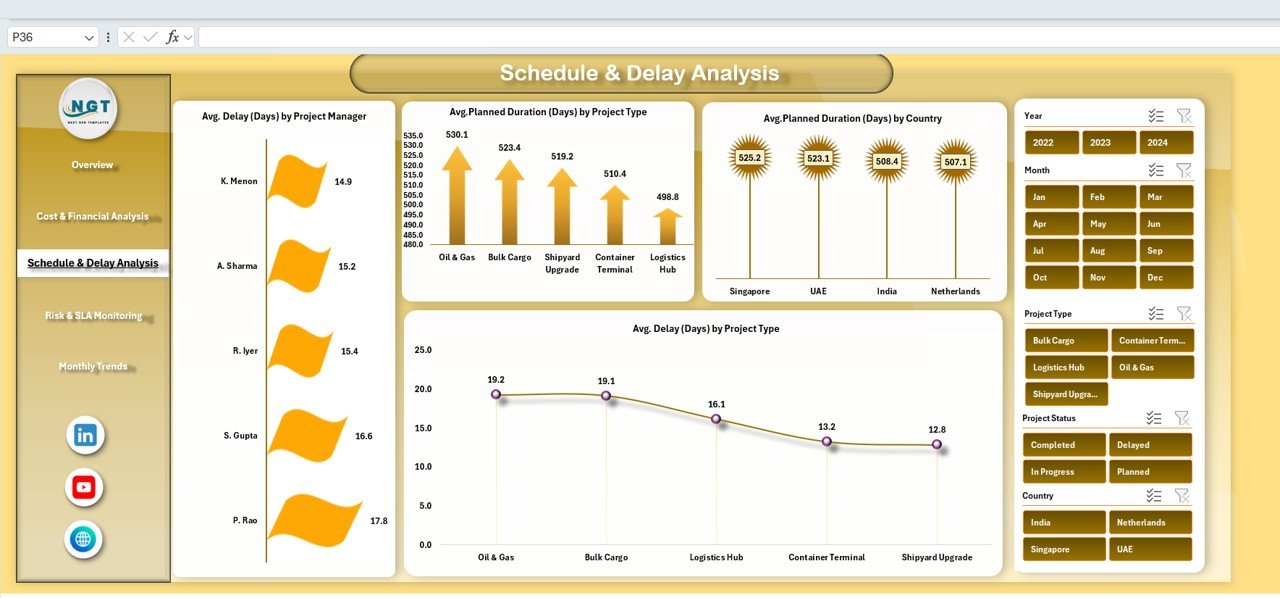
⏱️ Schedule & Delay Analysis
Timeline management is critical in port operations.
Charts Included
-
Average Delay (Days) by Project Manager – Measures delivery efficiency
-
Average Planned Duration (Days) by Project Type – Compares project complexity
-
Average Planned Duration (Days) by Country – Regional benchmarking
-
Average Delay (Days) by Project Type – Identifies delay-prone projects
These insights help teams take preventive action early.
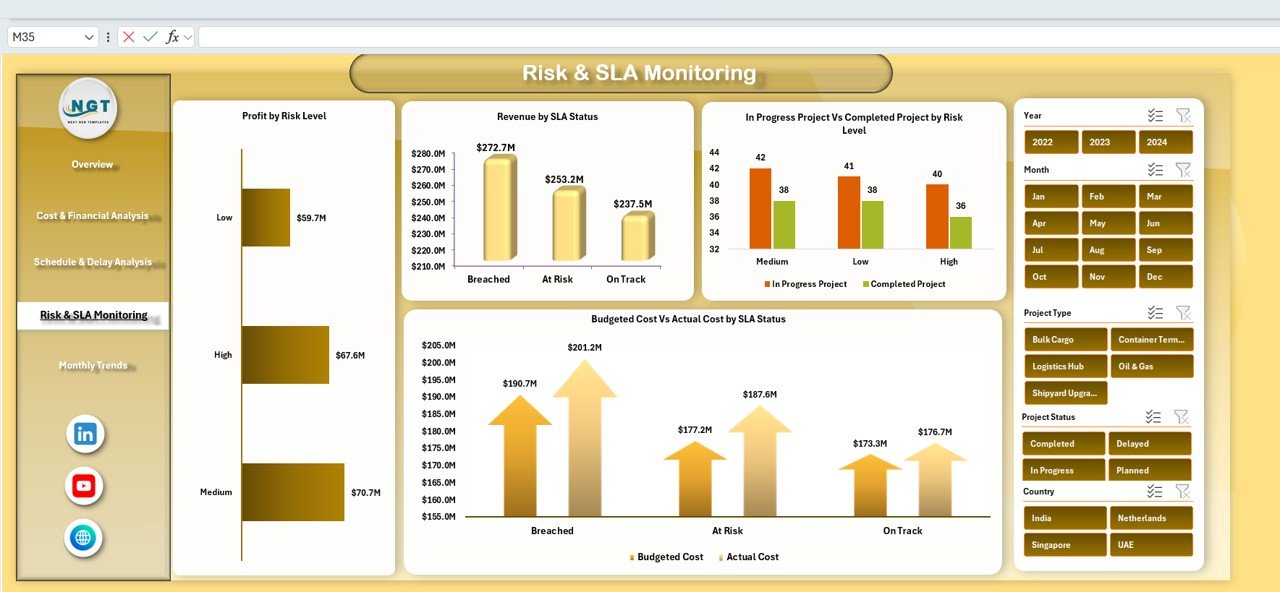
⚠️ Risk & SLA Monitoring
This section strengthens governance and compliance.
Charts Included
-
Profit by Risk Level – Shows financial impact of risk exposure
-
Revenue by SLA Status – Highlights revenue impact of compliance
-
In-Progress vs Completed Projects by Risk Level – Tracks execution effectiveness
-
Budgeted Cost vs Actual Cost by SLA Status – Reveals cost impact of SLA breaches
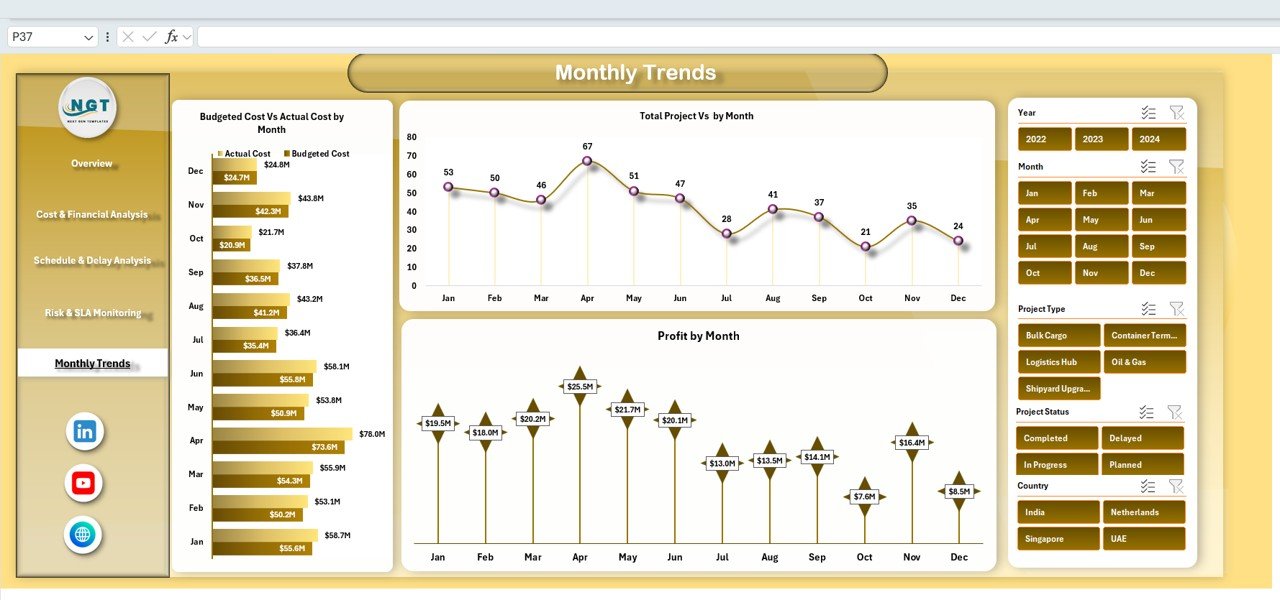
📅 Monthly Trends Analysis
Port projects evolve over time, and trends matter.
Charts Included
-
Budgeted Cost vs Actual Cost by Month
-
Total Projects by Month
-
Profit by Month
These trends support forecasting, capacity planning, and seasonal analysis.
🎯 Who Can Benefit from This Port Project Management Dashboard in Excel
-
⚓ Port Authorities – Gain control over multi-port projects
-
🚚 Logistics & Shipping Companies – Track cost, risk, and profitability
-
🏗️ Infrastructure Operators – Improve project execution quality
-
📊 Finance Teams – Maintain financial transparency
-
💼 Senior Management – Enable faster, data-backed decisions
### Click here to read the Detailed blog post
Watch the step-by-step video tutorial:


Reviews
There are no reviews yet.