The Performance Marketing KPI Dashboard in Excel is a powerful tool designed to help marketing professionals, digital marketers, and business owners track and optimize the performance of their marketing campaigns. This Excel-based dashboard tracks key performance indicators (KPIs) such as customer acquisition cost (CAC), return on investment (ROI), conversion rates, traffic sources, and campaign performance to help you make data-driven decisions and achieve better marketing results.
Whether you’re managing digital ad campaigns, content marketing, or any other marketing initiatives, the Performance Marketing KPI Dashboard in Excel helps you monitor the effectiveness of your campaigns, allocate budgets wisely, and optimize performance. With this dashboard, you can easily identify high-performing channels and campaigns, adjust strategies, and maximize your marketing ROI.
Key Features of the Performance Marketing KPI Dashboard in Excel
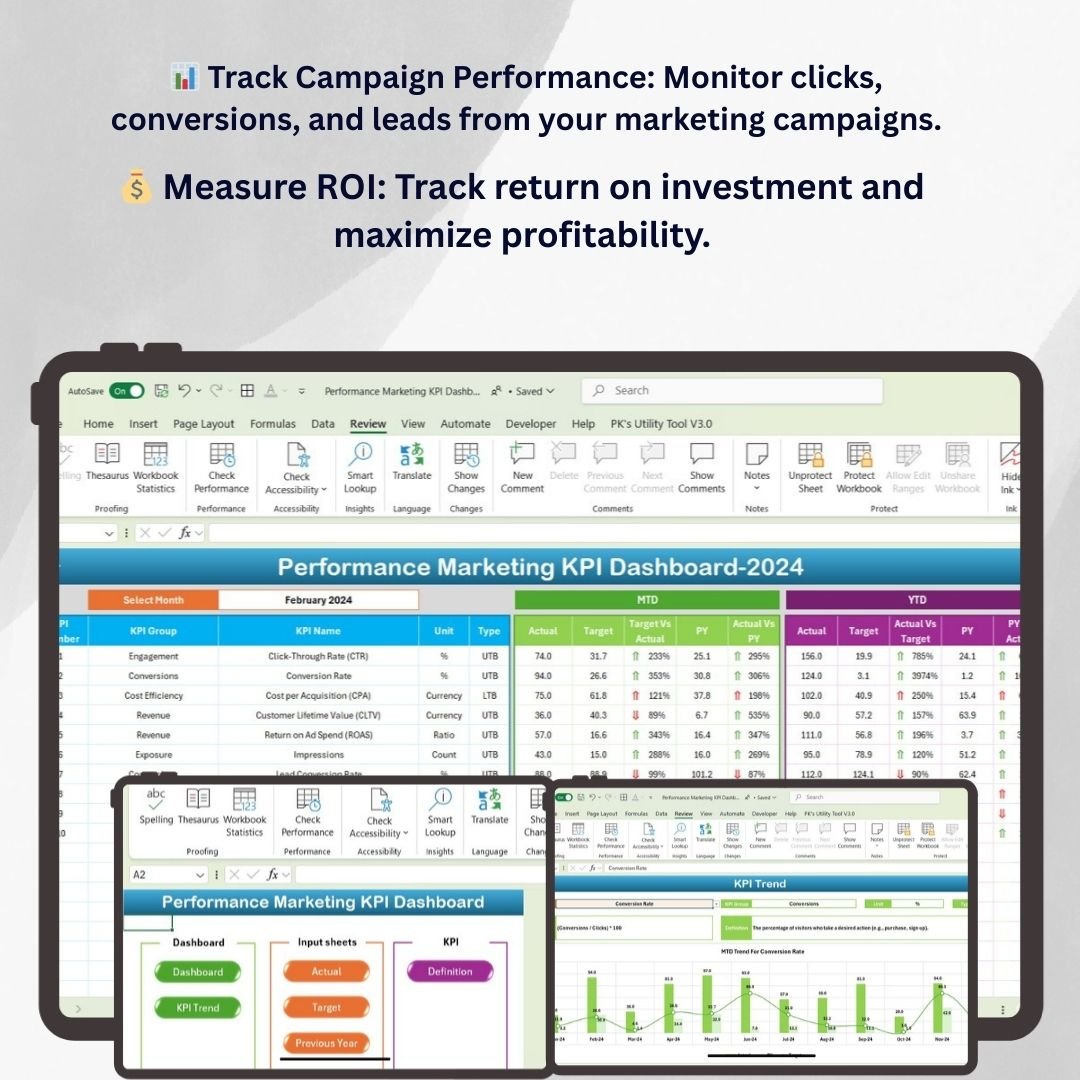
📊 Track Campaign Performance
Monitor key metrics such as clicks, conversions, impressions, and leads generated. Track the performance of your campaigns to determine which ones are delivering the best results and make data-driven adjustments.
💰 Measure Return on Investment (ROI)
Track the ROI of each marketing campaign to assess profitability. Determine how much revenue is generated from each dollar spent on marketing and identify opportunities for cost-saving improvements.
⚡ Customer Acquisition Cost (CAC) Tracking
Measure the cost of acquiring new customers through various channels. Track CAC to ensure that your marketing efforts are cost-effective and generate a positive return.
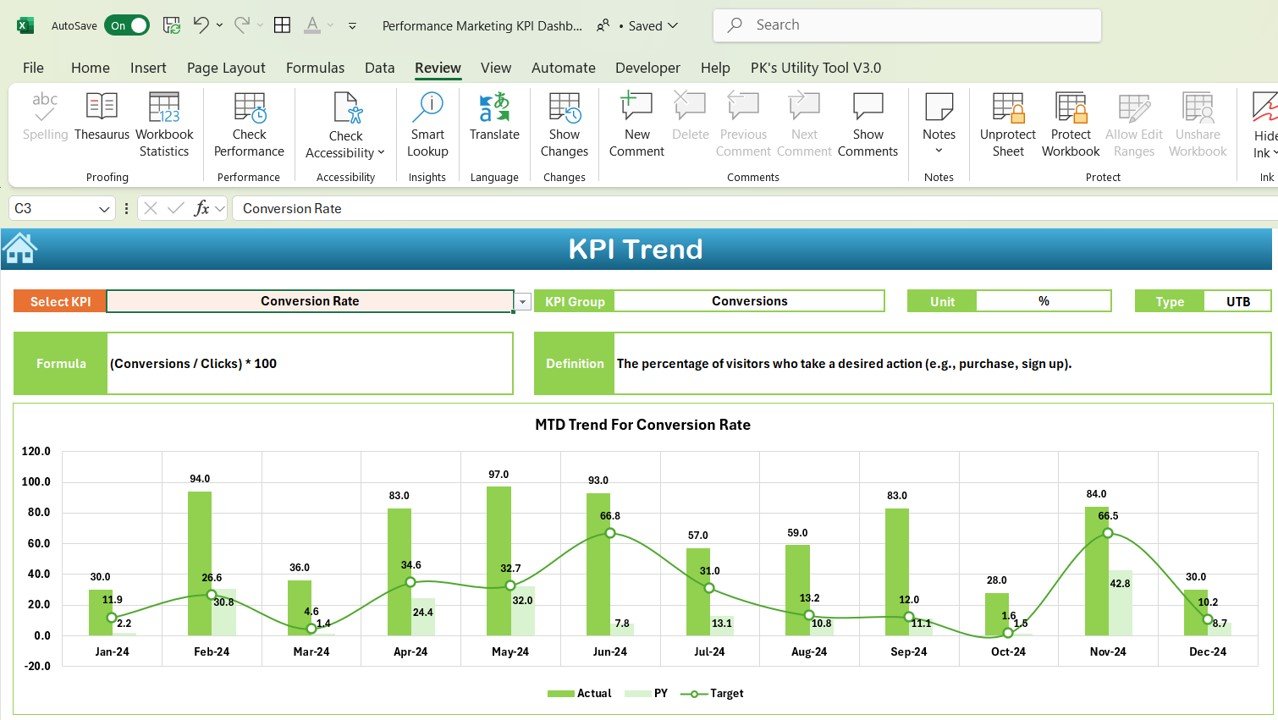
📈 Conversion Rate Optimization
Monitor conversion rates to assess the effectiveness of your campaigns in turning visitors into customers. Use this data to identify areas of improvement and optimize your marketing strategies for better conversions.
🖥️ Interactive & Real-Time Data Insights
The Excel dashboard offers real-time insights into all your marketing KPIs. With interactive charts, slicers, and filters, you can analyze campaign performance in real-time, identify trends, and make informed decisions.
Why You’ll Love the Performance Marketing KPI Dashboard in Excel
✅ Track Marketing Campaign Effectiveness
Monitor clicks, conversions, impressions, and leads to assess which campaigns are performing best and which need optimization.
✅ Measure ROI & Improve Profitability
Evaluate the return on investment for each campaign, helping you allocate your marketing budget wisely and boost profitability.
✅ Reduce Customer Acquisition Costs
Track CAC across different marketing channels and identify cost-effective strategies to acquire customers, improving overall marketing efficiency.
✅ Optimize Conversion Rates
Analyze conversion rates and use insights to optimize marketing tactics, landing pages, and messaging for better customer acquisition.
✅ Make Data-Driven Marketing Decisions
Use real-time data and actionable insights to make informed decisions and optimize your marketing strategies for improved performance and higher returns.
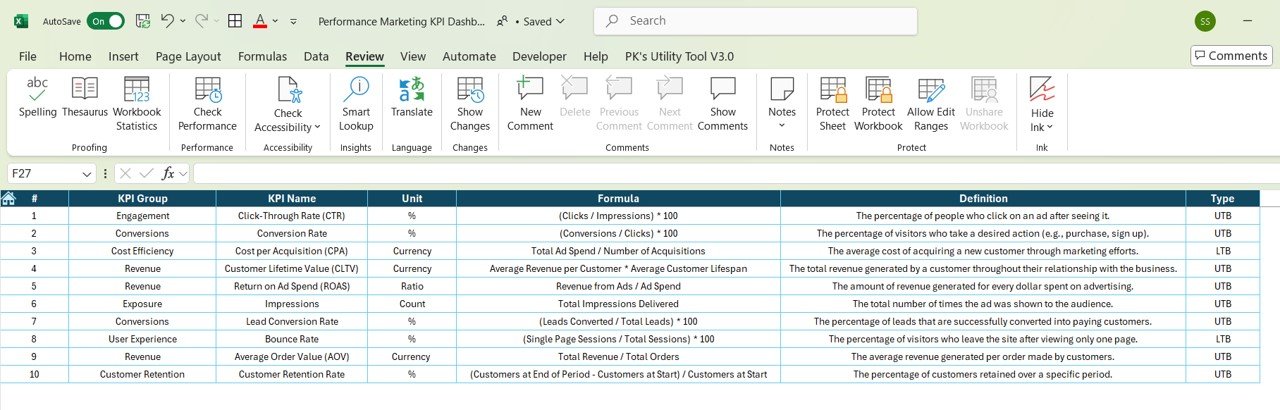
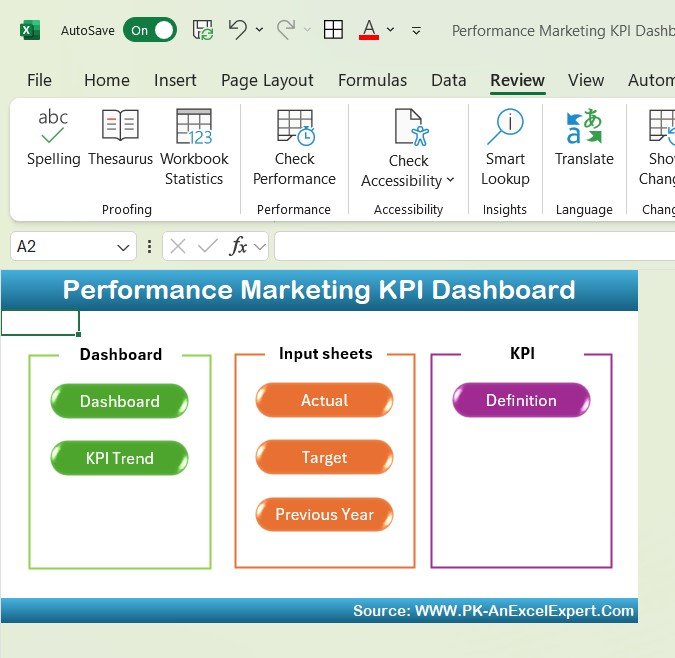
What’s Inside the Performance Marketing KPI Dashboard Template?
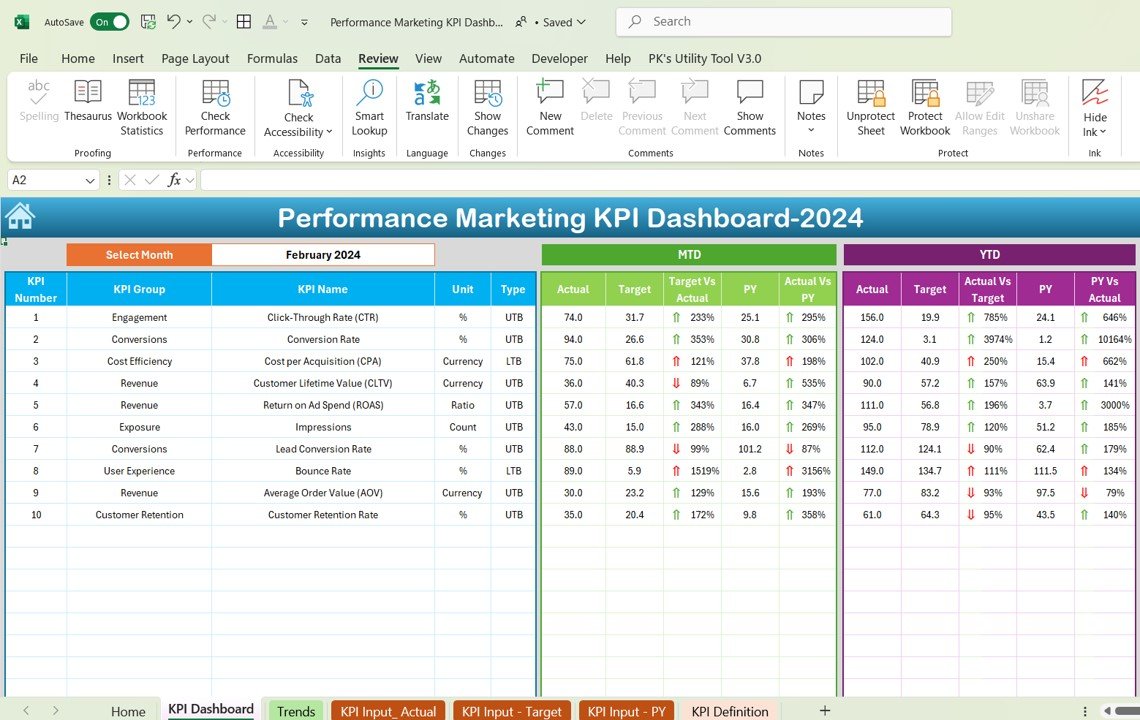
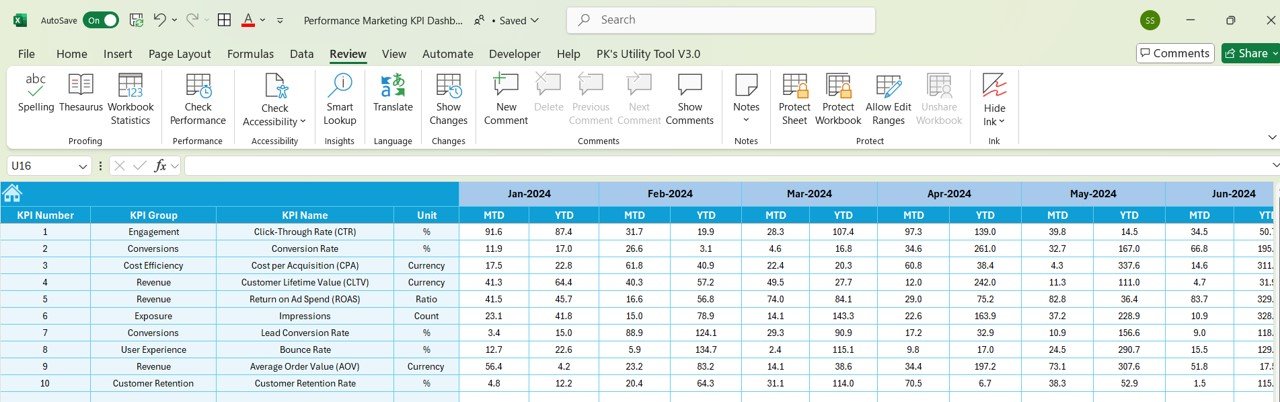
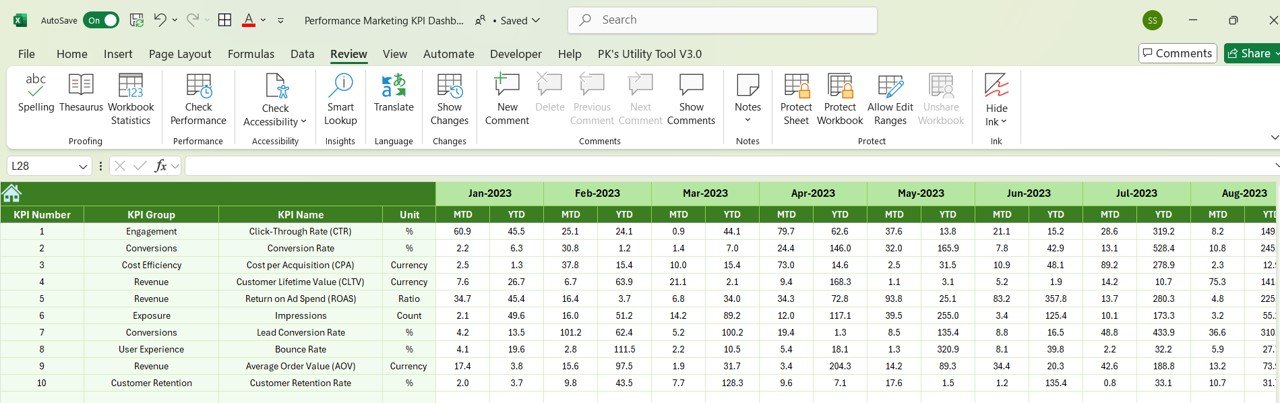
- Campaign Performance Tracking: Monitor clicks, impressions, conversions, and leads generated by your marketing campaigns.
- ROI Measurement: Track ROI to evaluate profitability and improve marketing effectiveness.
- Customer Acquisition Cost Tracking: Monitor CAC across different marketing channels to ensure cost-effectiveness.
- Conversion Rate Optimization: Track and optimize conversion rates to improve campaign results.
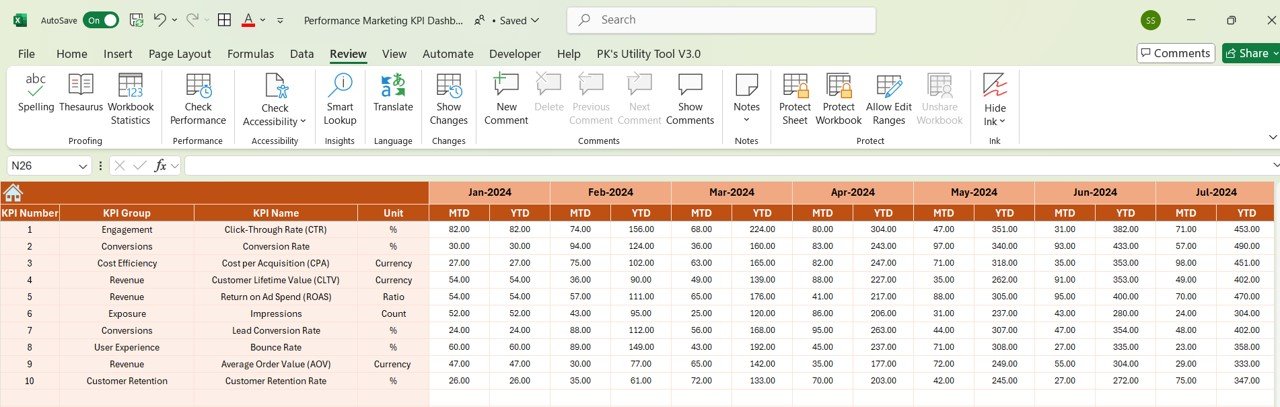
- Real-Time Insights: Access live data to monitor campaign performance and adjust strategies in real time.
- Customizable KPIs: Tailor the dashboard to track the KPIs that are most important for your marketing efforts.
How to Use the Performance Marketing KPI Dashboard in Excel
1️⃣ Download the Template: Get instant access to your Performance Marketing KPI Dashboard in Excel.
2️⃣ Input Your Data: Enter your campaign data, such as clicks, impressions, conversions, and spending, into the dashboard.
3️⃣ Track & Monitor KPIs: Use the dashboard to track marketing performance, ROI, CAC, and conversion rates in real-time.
4️⃣ Analyze & Optimize: Use the data to optimize your marketing campaigns, adjust budgets, and maximize performance.
Who Can Benefit from the Performance Marketing KPI Dashboard in Excel?
🔹 Digital Marketing Professionals & Agencies
🔹 Marketing Managers & Executives
🔹 E-commerce & Online Retailers
🔹 Content Marketers & Social Media Managers
🔹 Business Owners & Entrepreneurs
🔹 Anyone Looking to Improve Marketing Campaigns & Optimize ROI
Optimize your marketing efforts and improve campaign performance with the Performance Marketing KPI Dashboard in Excel. Track key metrics, optimize conversion rates, and make data-driven decisions to maximize ROI and grow your business.
Click here to read the Detailed blog post
Visit our YouTube channel to learn step-by-step video tutorials
Youtube.com/@PKAnExcelExpert


Reviews
There are no reviews yet.