Performance appraisals shape employee growth, organizational productivity, and long-term talent success. However, many organizations still rely on manual spreadsheets, disconnected HR systems, and subjective judgments during appraisal cycles. As a result, performance reviews often feel inconsistent, time-consuming, and unclear for both managers and employees.
That is exactly why the Performance Appraisal KPI Dashboard in Google Sheets becomes a game-changing solution.
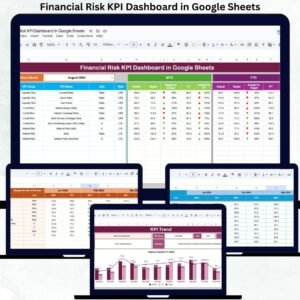
This ready-to-use dashboard transforms traditional appraisal data into structured KPIs, clear comparisons, and actionable insights. Instead of reviewing scattered appraisal forms, HR teams and managers can track performance metrics centrally, compare targets versus actual results, and analyze performance trends with confidence.
Because the dashboard runs entirely in Google Sheets, it remains flexible, cloud-based, collaborative, and cost-effective. You do not need complex HR software, BI tools, or technical expertise. You simply update performance data, select the month, and the dashboard refreshes automatically.
## 🚀 Key Features of the Performance Appraisal KPI Dashboard
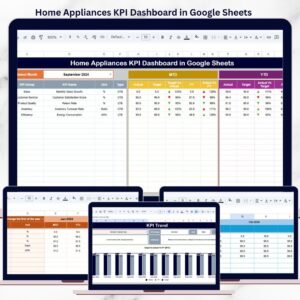
📊 MTD & YTD Performance Tracking
Monitor Month-to-Date and Year-to-Date appraisal performance effortlessly.
🎯 Target vs Actual Comparison
Evaluate employee performance objectively against predefined benchmarks.
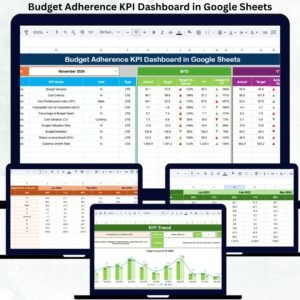
📅 Previous Year Benchmarking
Measure progress by comparing current appraisal results with historical data.
📈 KPI-Wise Trend Analysis
Identify consistent improvement, decline, or stagnation in performance KPIs.
🤝 Real-Time Collaboration
HR teams and managers work together in one shared dashboard.
## 📦 What’s Inside the Performance Appraisal KPI Dashboard
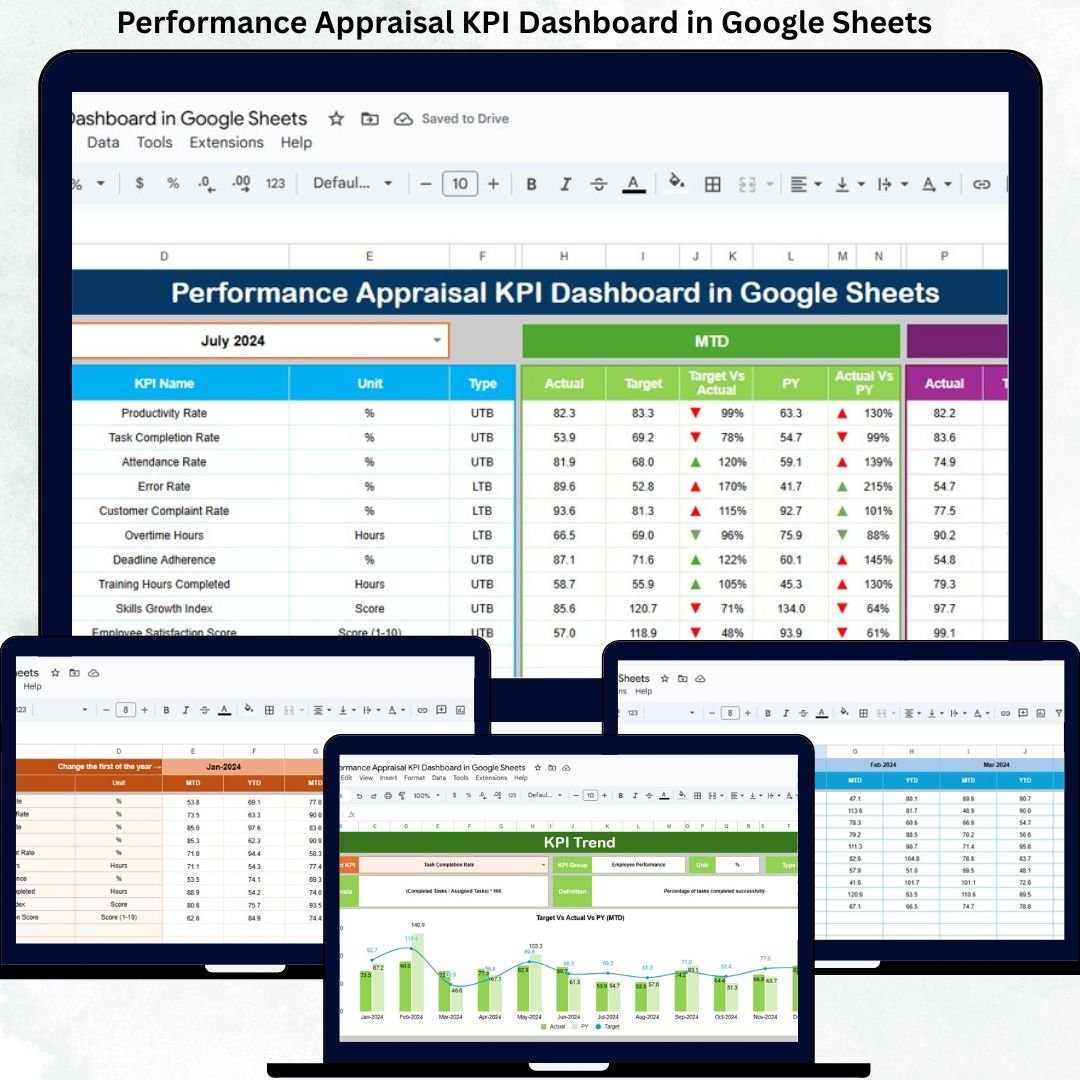
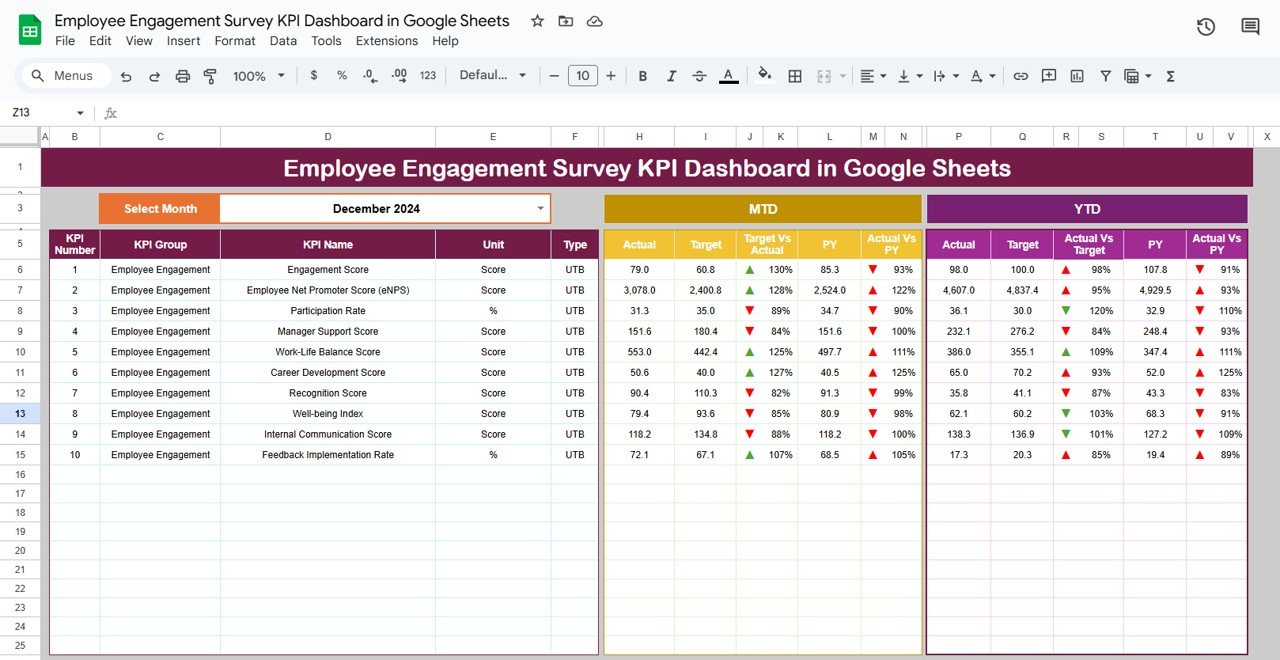
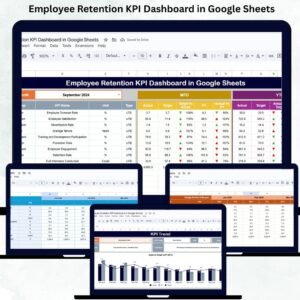
📌 Dashboard Sheet Tab (Main Page)
This is the executive summary of the appraisal system. You select the reporting month from cell D3, and the entire dashboard updates instantly.
The dashboard displays:
MTD Metrics
-
Actual
-
Target
-
Previous Year
-
Target vs Actual
-
PY vs Actual
YTD Metrics
-
Actual
-
Target
-
Previous Year
-
Target vs Actual
-
PY vs Actual
Conditional formatting with up and down arrows highlights performance movement clearly, helping managers understand results at a glance.
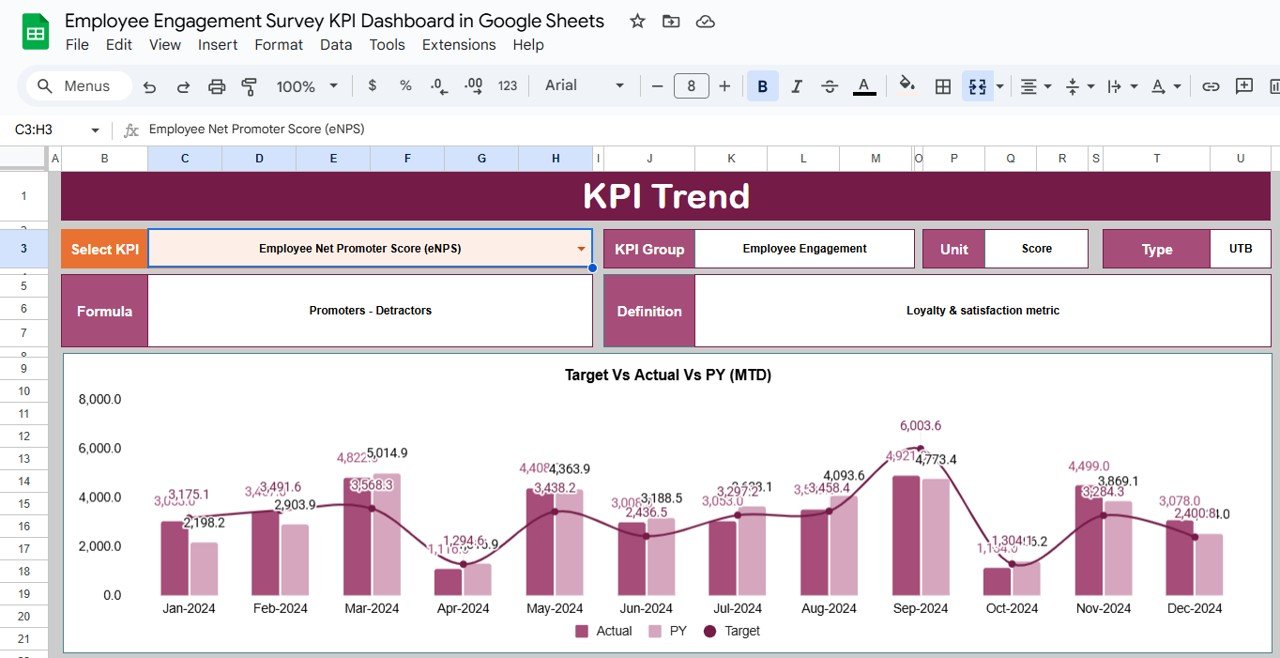
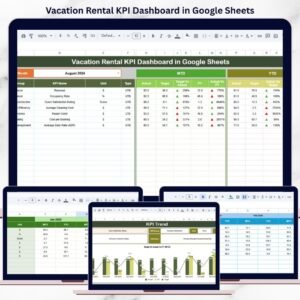
## 📊 KPI Trend Sheet Tab
This sheet allows deep analysis of individual appraisal KPIs.
You select a KPI from the dropdown in cell C3, and the dashboard displays:
-
KPI Group
-
KPI Unit
-
KPI Type (Upper the Better / Lower the Better)
-
KPI Formula
-
KPI Definition
Month-wise trend visuals help managers identify patterns, improvement areas, and performance risks early.
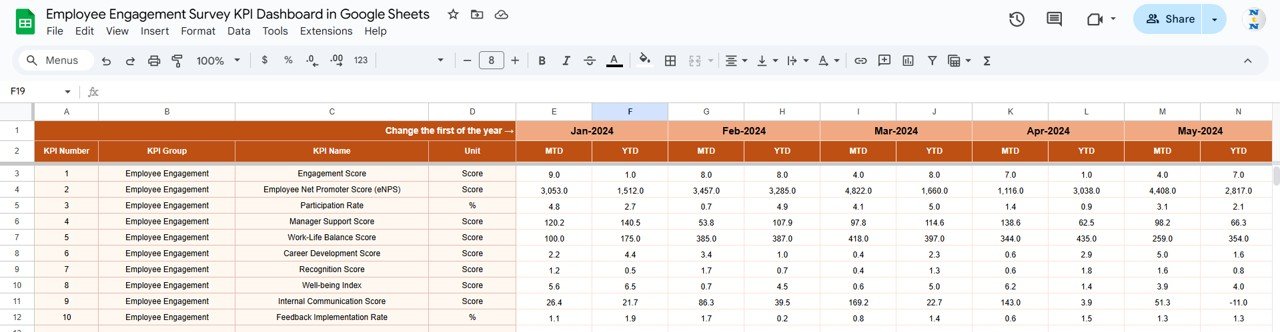
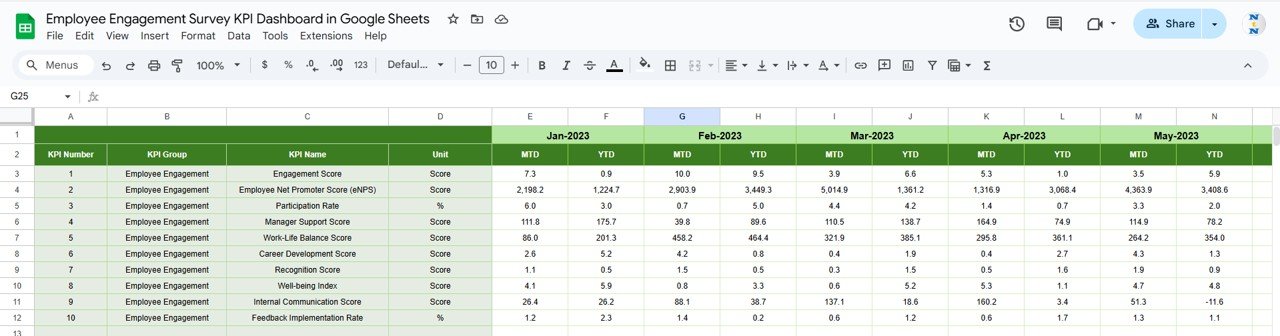
## 🧾 Actual Number Sheet Tab
This sheet captures real appraisal performance values.
You:
-
Enter MTD and YTD actual values for each KPI
-
Define the first month of the year in cell E1
All calculations and visuals update automatically, eliminating manual errors.
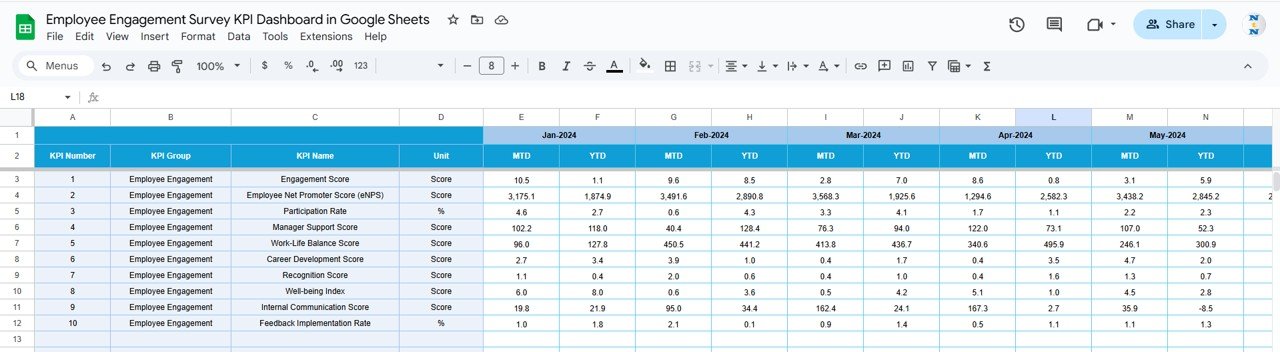
## 🎯 Target Sheet Tab
This sheet stores expected performance benchmarks.
It helps organizations:
-
Define clear appraisal goals
-
Standardize expectations across teams
-
Compare planned vs actual outcomes objectively
## 📅 Previous Year Number Sheet Tab
This sheet stores last year’s appraisal values and enables:
-
Year-over-Year comparison
-
Long-term performance trend analysis
-
Evaluation of appraisal framework effectiveness
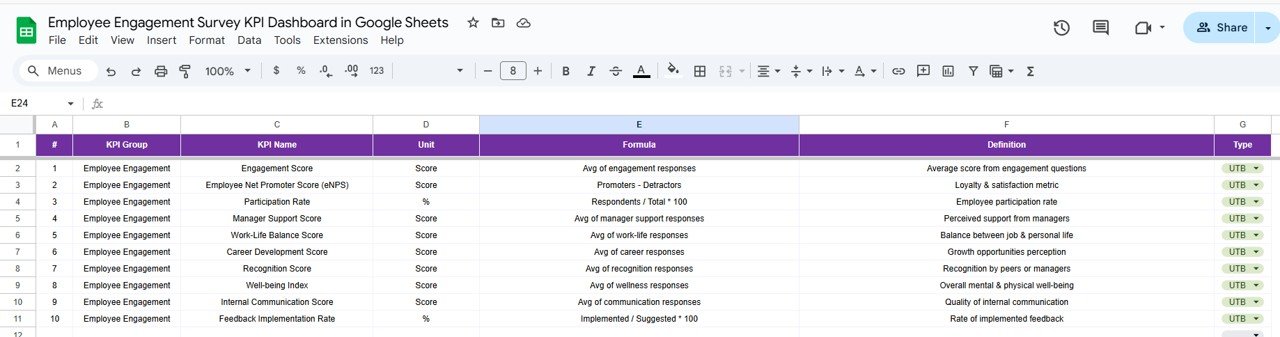
## 📚 KPI Definition Sheet Tab
This reference sheet ensures governance and clarity. It includes:
-
KPI Name
-
KPI Group
-
Unit
-
Formula
-
KPI Definition
-
KPI Type (UTB / LTB)
This prevents misinterpretation and ensures fair evaluations across departments.
## 🎯 Who Can Benefit from This Dashboard
-
HR Teams – Standardize appraisal analysis
-
Managers & Team Leads – Make objective evaluation decisions
-
Leadership Teams – Support promotions, rewards, and training plans
-
Growing Organizations – Scale performance management easily
### Click here to read the Detailed blog post
Watch the step-by-step video tutorial:


Reviews
There are no reviews yet.