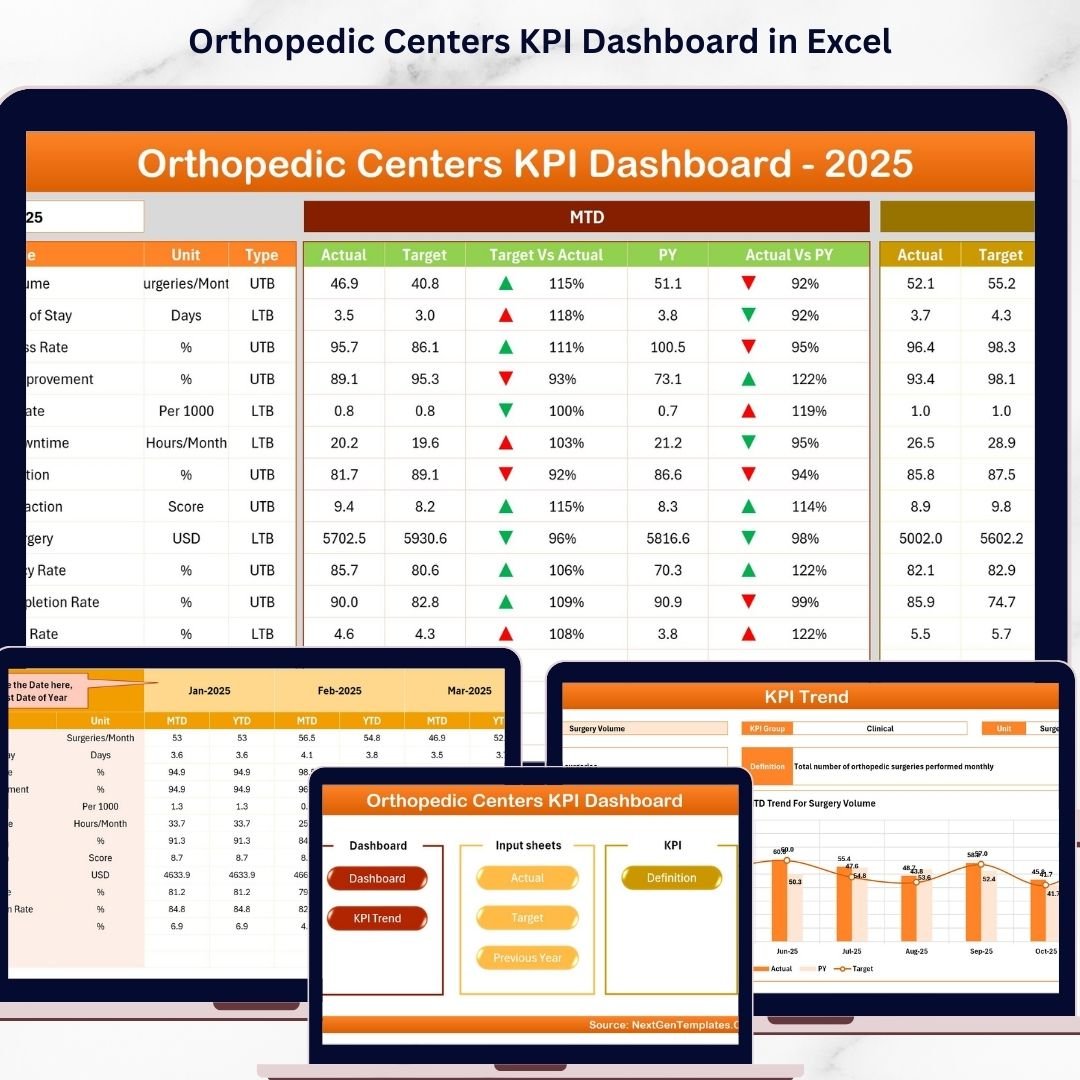


Key Features of Orthopedic Centers KPI Dashboard
Discover the Orthopedic Centers KPI Dashboard, your ultimate digital solution designed specifically to streamline performance tracking and data visualization for orthopedic centers. This comprehensive dashboard features 7 meticulously crafted worksheets that provide a dynamic and interactive experience to monitor all your key performance indicators (KPIs) effectively.
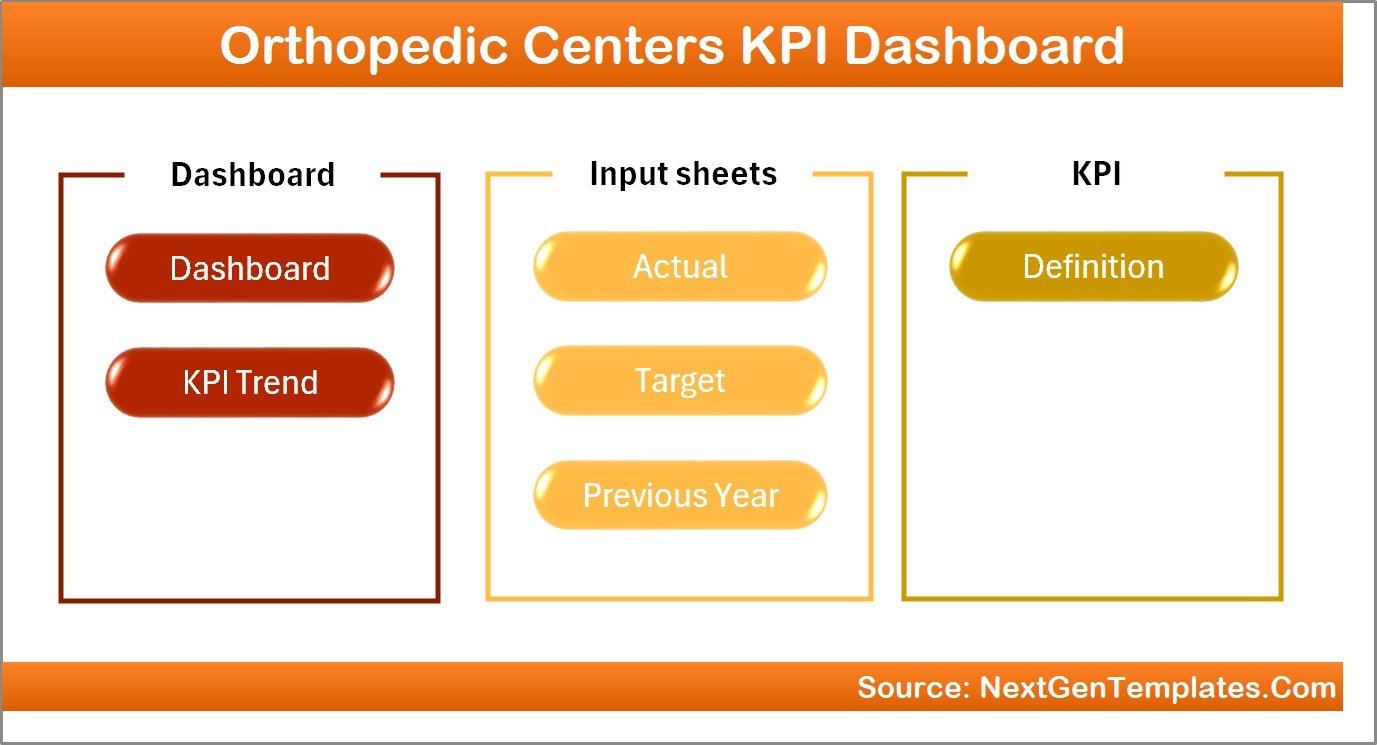
Start with the Home Sheet, an index page equipped with 6 easy-to-navigate buttons that instantly direct you to the core sections of the dashboard, ensuring quick access to essential data and insights.
Home Page
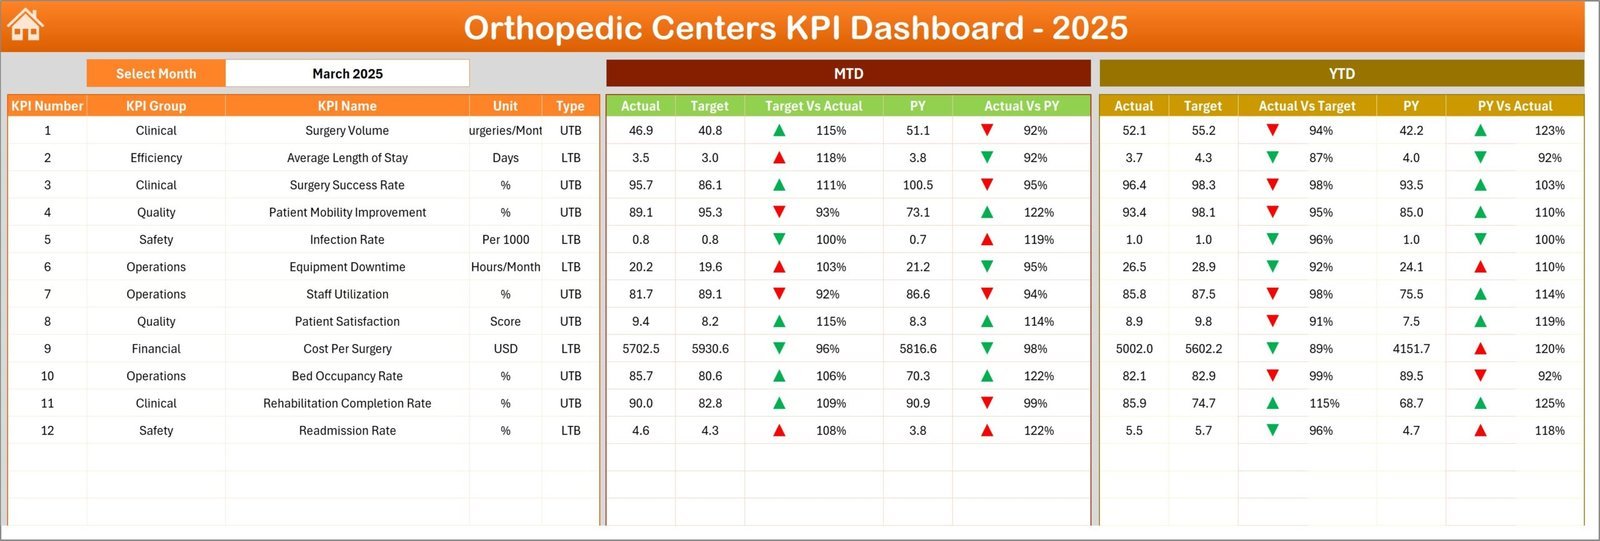
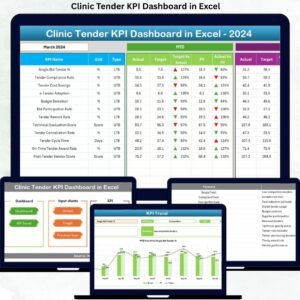
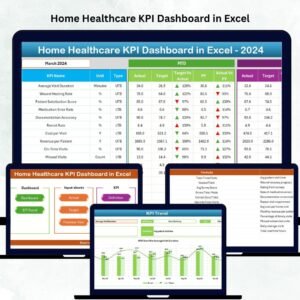
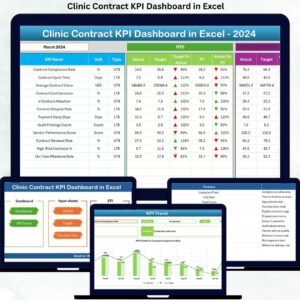
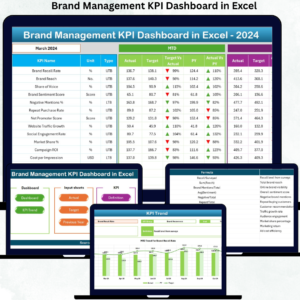
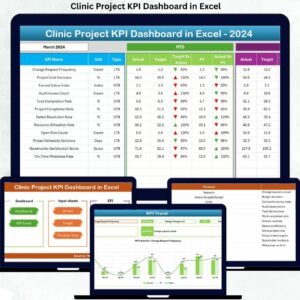
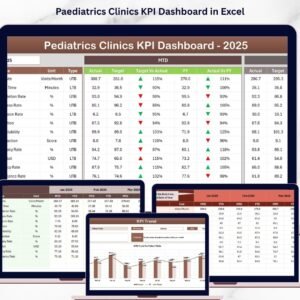
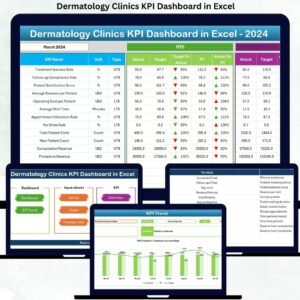
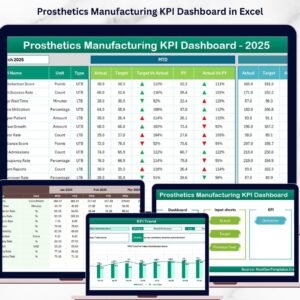
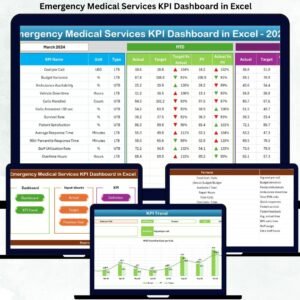
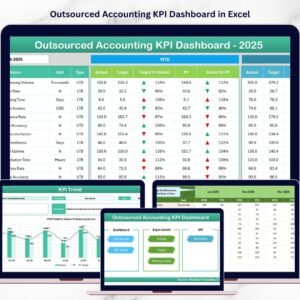
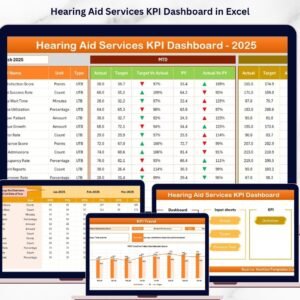
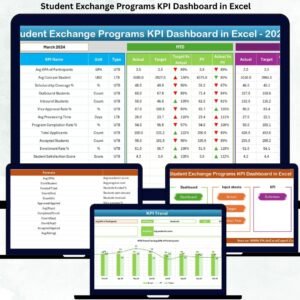
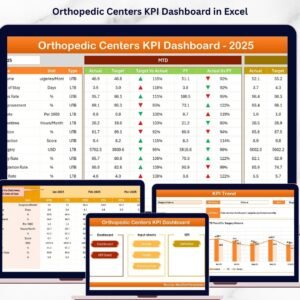
The Dashboard Sheet serves as the heart of the product, showcasing all KPI data in an engaging, user-friendly format. Users can select the month via a drop-down in cell D3 to dynamically update the data displayed. This sheet highlights Month-To-Date (MTD) actuals, targets, and previous year data, complete with visually intuitive conditional formatting using up and down arrows to instantly indicate performance.

Orthopedic Centers KPI Dashboard
Next, the KPI Trend Sheet allows you to select any KPI from a drop-down (cell C3) and view detailed information such as KPI group, unit, type (Lower The Better or Upper The Better), formula, and definition. Trend charts for MTD and Year-To-Date (YTD) actuals, targets, and previous year data provide a clear visual representation of performance over time.
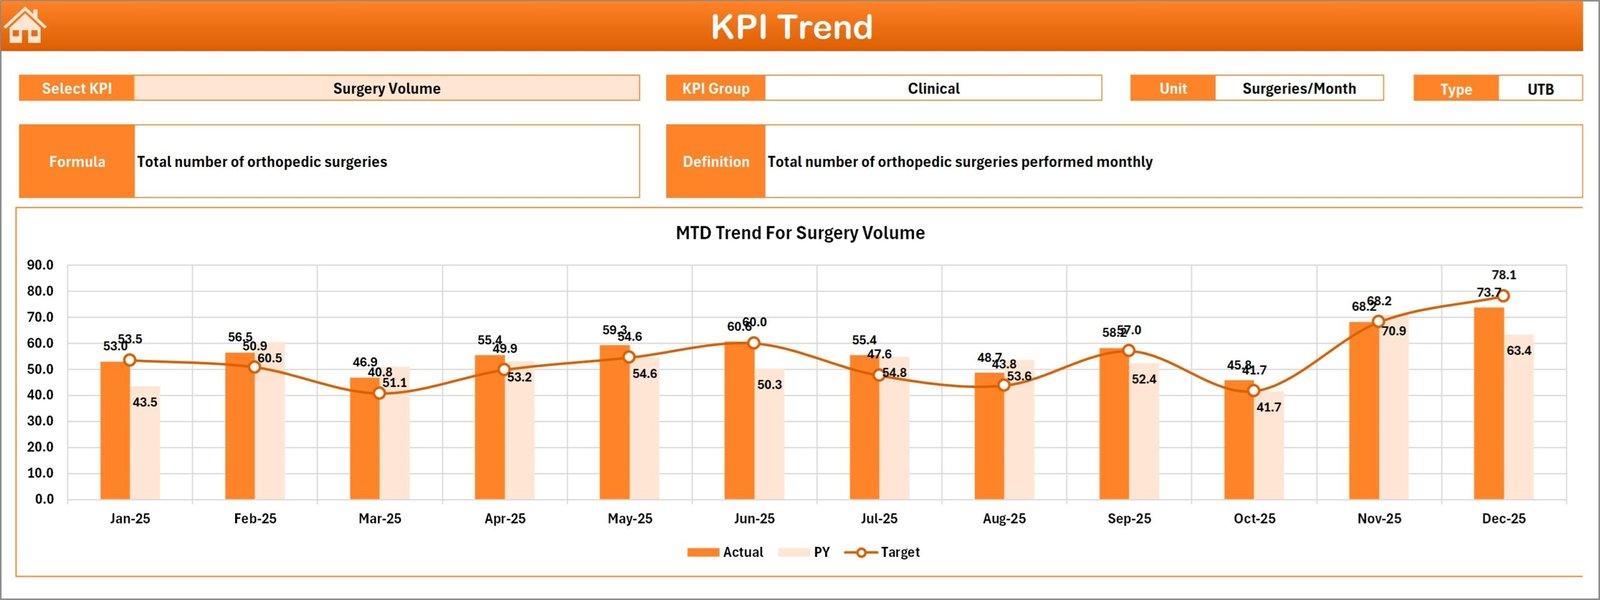
KPI Trend Sheet
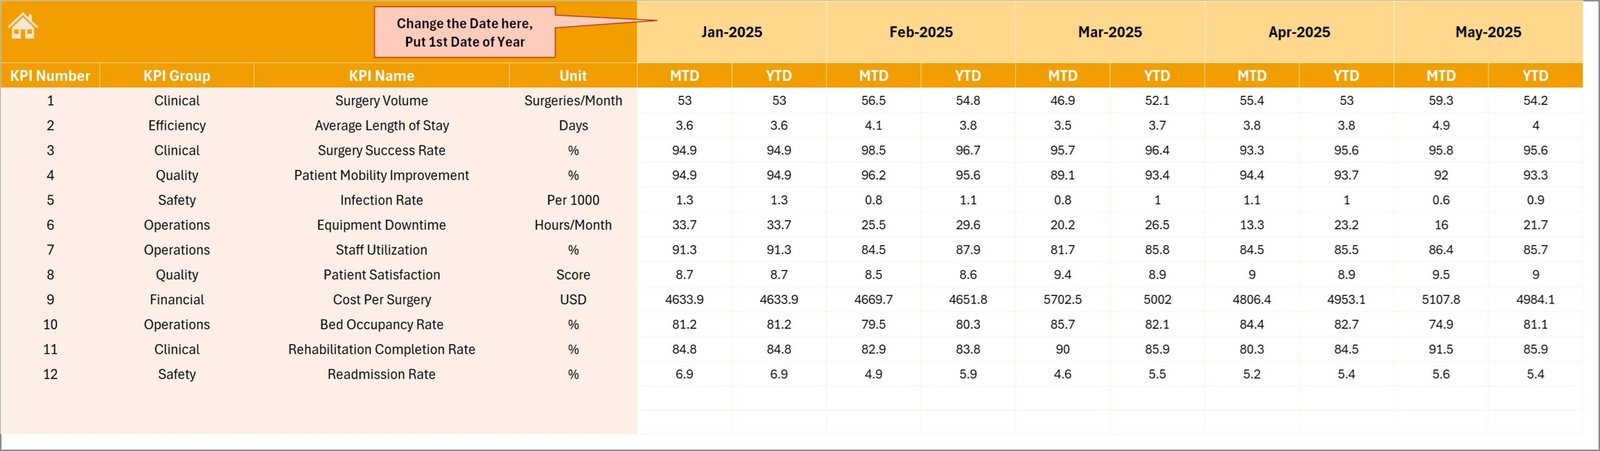
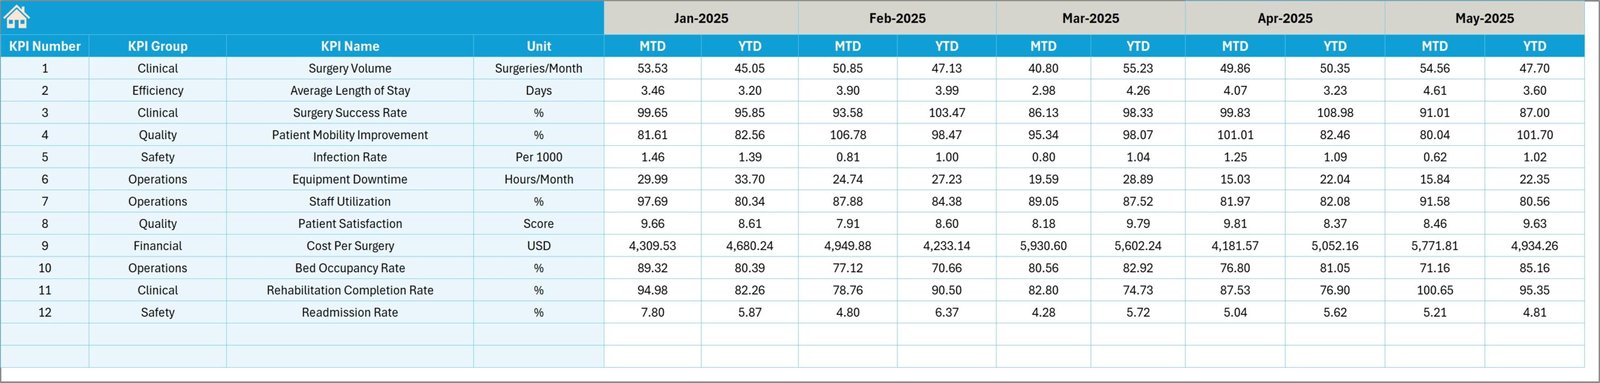
The Actual Numbers Input Sheet is designed for easy data entry of actual numbers, both MTD and YTD, for any selected month. You can conveniently change the starting month of the year in cell E1 to customize your reporting period.

Actual Numbers Input sheet
The Target Number Input Sheet allows users to enter monthly MTD and YTD target values for each KPI, facilitating precise goal setting and performance tracking.
Target Number Input sheet
For historical comparison, the Previous Year Number Sheet enables you to input last year’s KPI data, providing essential context for evaluating current performance.
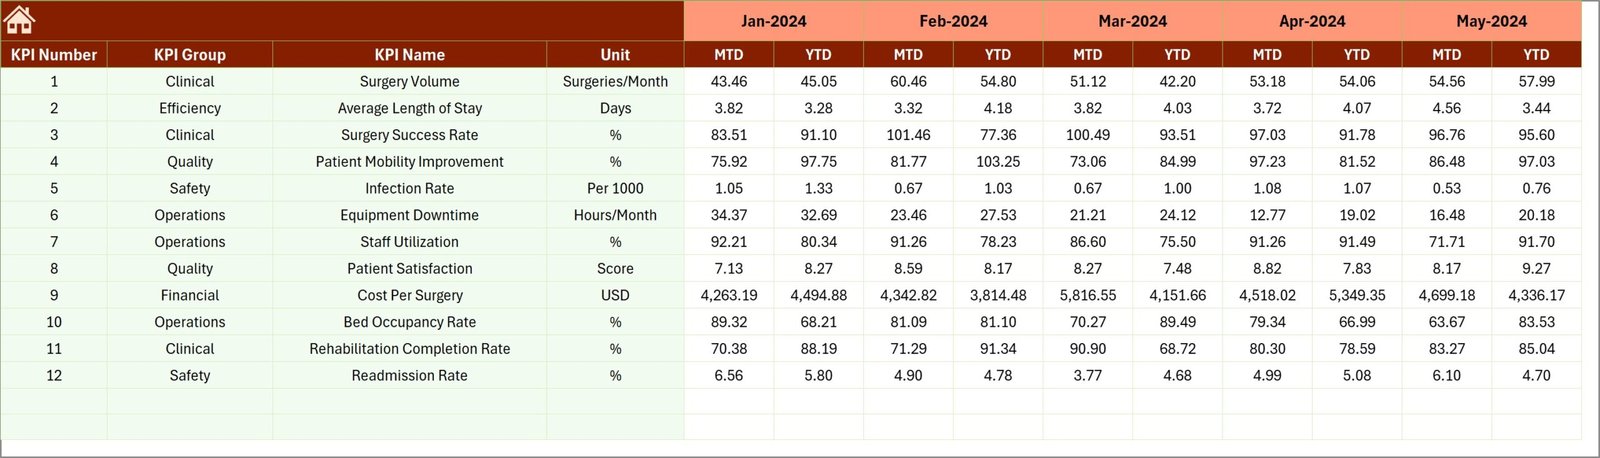
Previous Year Number Input sheet
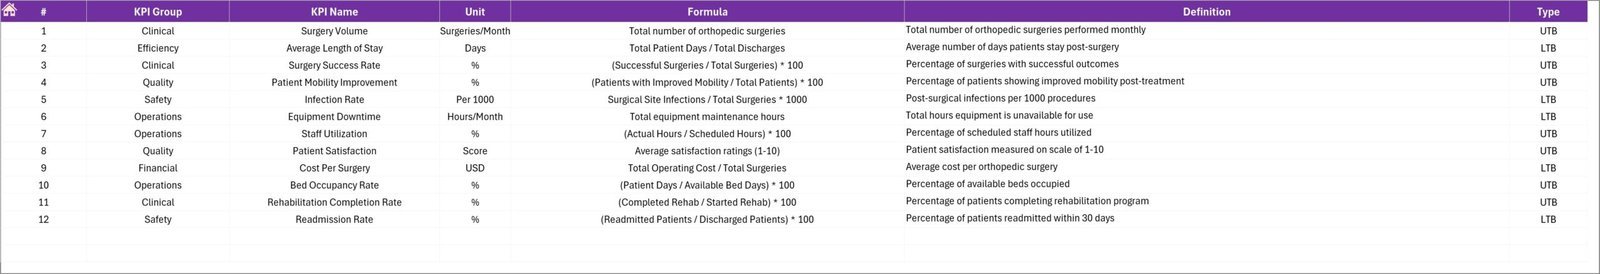
Finally, the KPI Definition Sheet organizes your KPIs in one place, including KPI name, group, unit, formula, and detailed definitions. It also categorizes KPIs as LTB (Lower The Better) or UTB (Upper The Better), helping interpret performance metrics accurately.

KPI Definition sheet
What’s Inside the Orthopedic Centers KPI Dashboard
This all-in-one digital product contains:
- 🗂️ Seven interactive worksheets for comprehensive KPI management
- 📅 Dynamic month selection with real-time data updates
- 📊 Visual charts and conditional formatting for quick insights
- 📝 Easy data input sheets for actuals, targets, and previous year comparisons
- 🔍 Detailed KPI definitions and formulas for clarity
- 🔄 User-friendly navigation buttons for seamless workflow
- 💡 Clear indicators for KPI performance trends
- 📈 MTD and YTD tracking to measure ongoing progress
How to Use the Orthopedic Centers KPI Dashboard
Getting started with the Orthopedic Centers KPI Dashboard is simple and intuitive. Follow these steps:
- 🔘 Begin on the Home Sheet and use the buttons to navigate between sections.
- 📅 Select the month you want to analyze on the Dashboard Sheet to view updated KPI metrics.
- ✍️ Enter actual performance numbers on the Actual Numbers Input Sheet for the desired months.
- 🎯 Input your monthly targets on the Target Number Input Sheet to set benchmarks.
- 📉 Add previous year data on the Previous Year Number Sheet to compare trends.
- 📈 Use the KPI Trend Sheet to select KPIs and observe detailed performance charts.
- 📚 Reference the KPI Definition Sheet to understand each KPI’s significance and measurement method.
- 🔄 Regularly update your data to maintain accurate and actionable insights.
This dashboard is designed for ease of use without requiring advanced technical skills, making it ideal for orthopedic center managers and analysts.
Who Can Benefit from This Orthopedic Centers KPI Dashboard
This KPI Dashboard is specially tailored to meet the needs of:
- 🏥 Orthopedic Clinic Managers: Gain real-time insights to drive operational efficiency.
- 📊 Healthcare Analysts: Analyze trends and KPIs in a structured, visual format.
- 👩⚕️ Medical Directors: Monitor clinical performance and patient outcomes effectively.
- 📈 Business Development Teams: Track growth metrics and identify improvement areas.
- 🧑💼 Hospital Administrators: Oversee multiple departments with consolidated KPI data.
- 🖥️ Data Enthusiasts: Leverage interactive dashboards for healthcare data visualization.
- 🎯 Quality Assurance Teams: Monitor target achievements and compliance standards.
Whether you are managing a small clinic or a large orthopedic center, this dashboard empowers you to make informed, data-driven decisions with ease.


Reviews
There are no reviews yet.