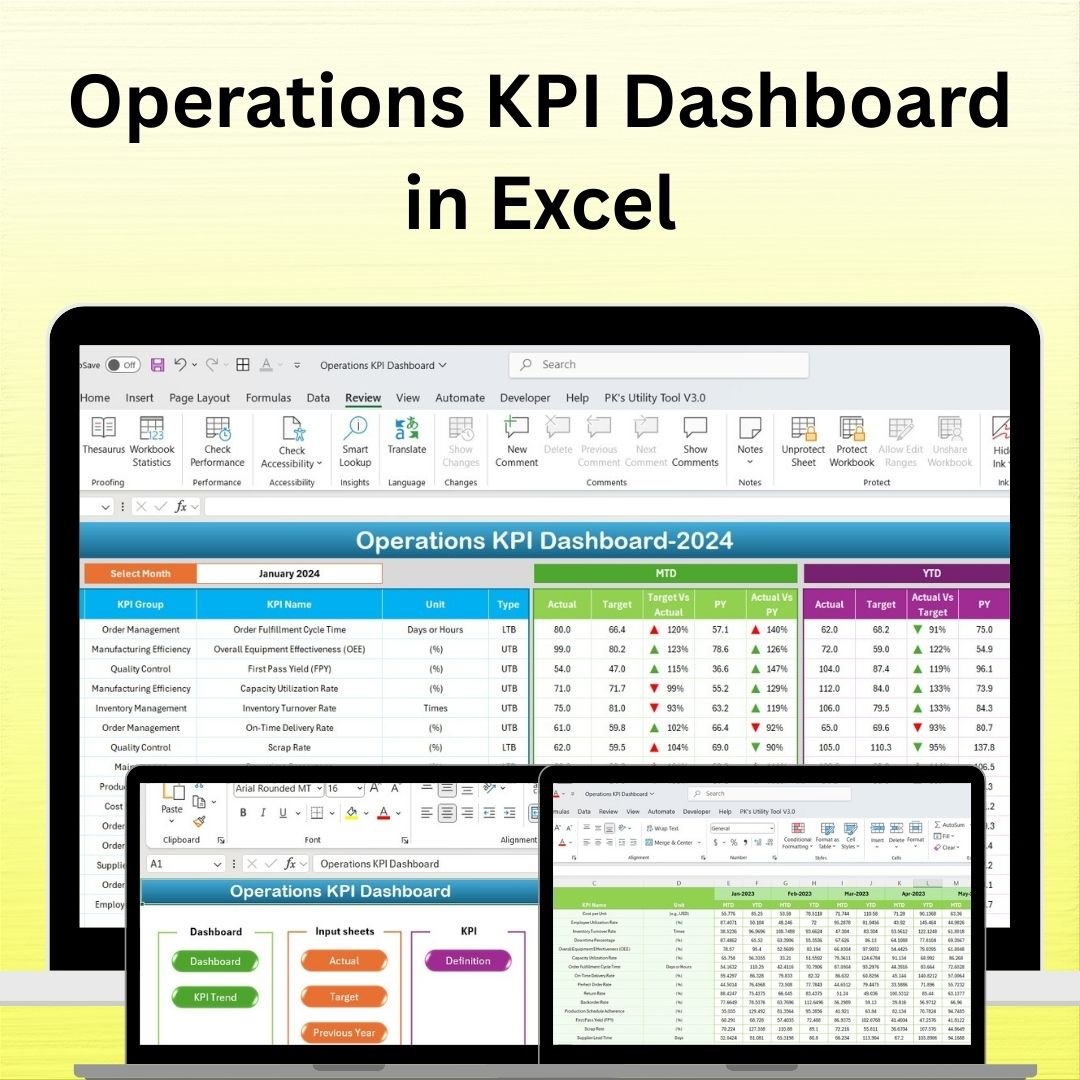

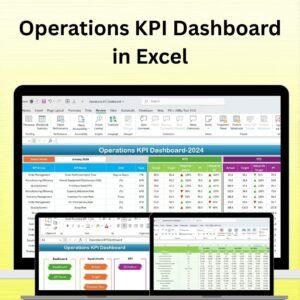
The Operations KPI Dashboard in Excel is a powerful tool designed to help businesses track, manage, and optimize their operational performance. Whether you’re managing production, supply chain, inventory, or customer service, this dashboard provides a centralized view of all your key operational metrics, helping you streamline processes, reduce inefficiencies, and enhance productivity.
With real-time tracking, dynamic charts, and customizable features, this Excel dashboard allows operations managers, business owners, and department heads to make informed, data-driven decisions. It helps monitor every aspect of your operations, from resource utilization and production speed to customer satisfaction and inventory levels.
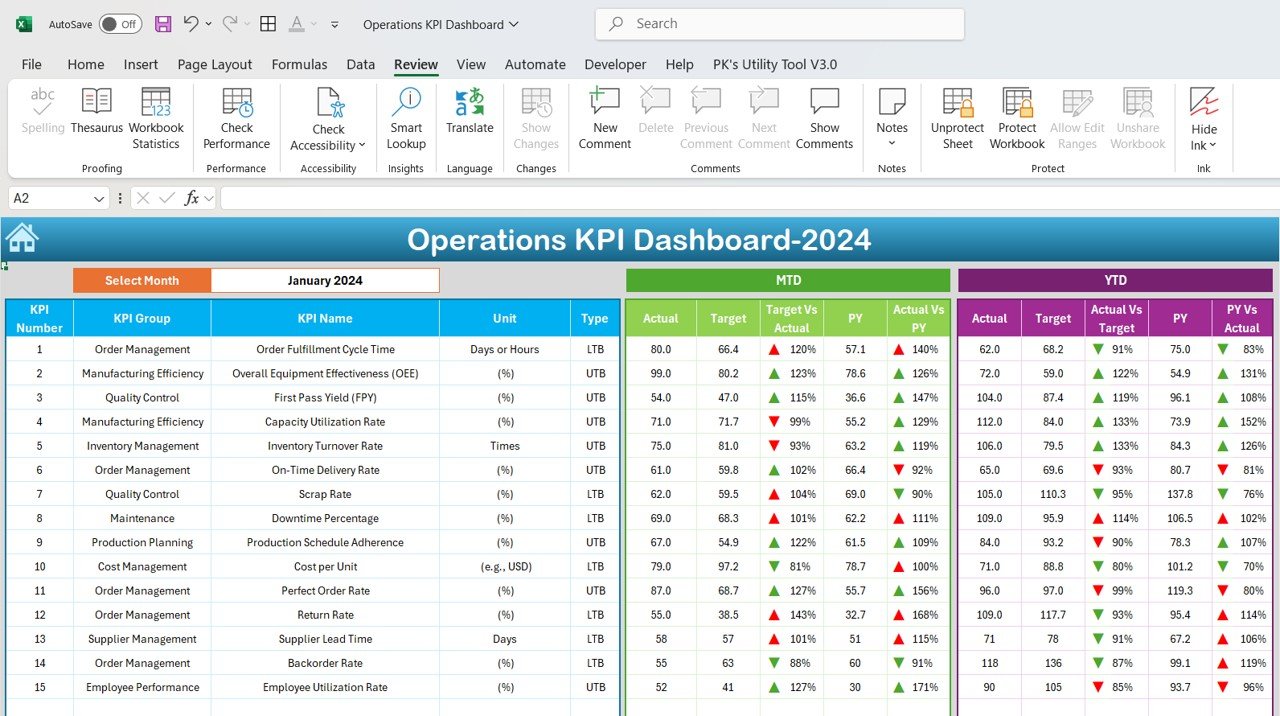
Key Features of the Operations KPI Dashboard in Excel:
📊 Comprehensive KPI Tracking
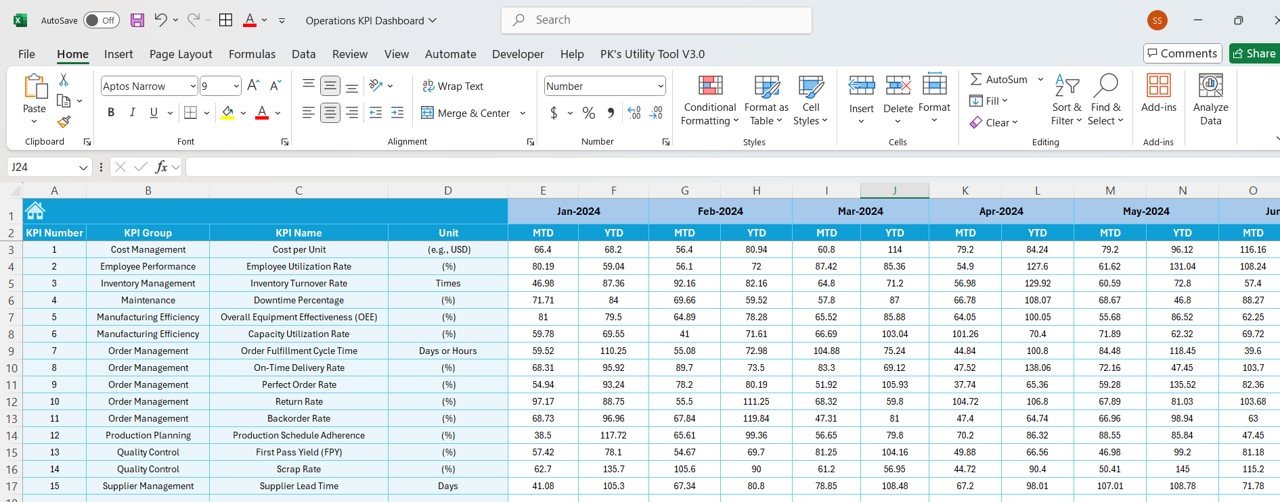
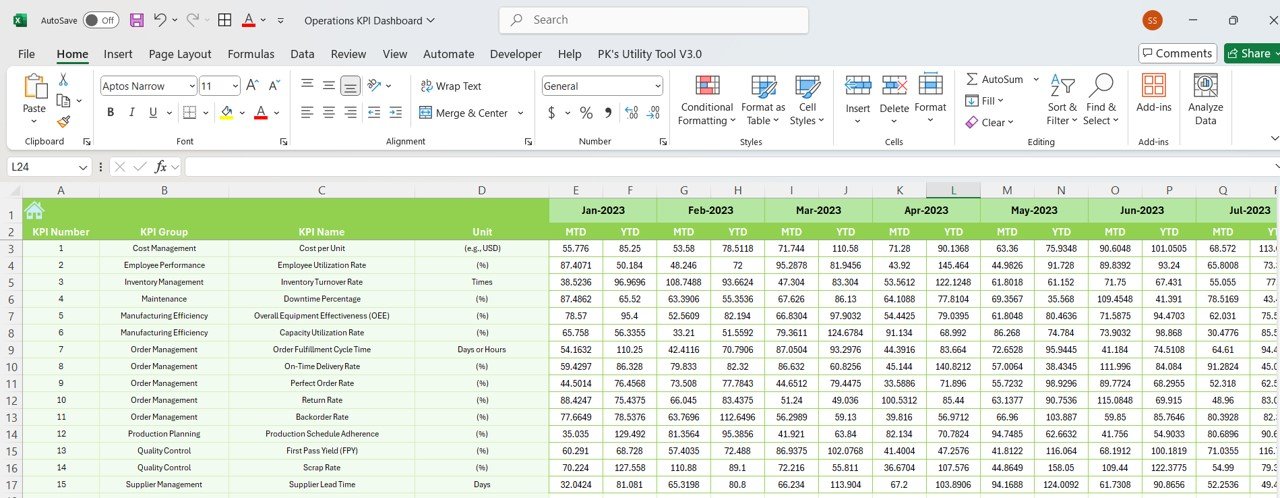
Track essential operational KPIs such as production output, inventory turnover, resource utilization, on-time delivery, and customer service performance—all in one dashboard.
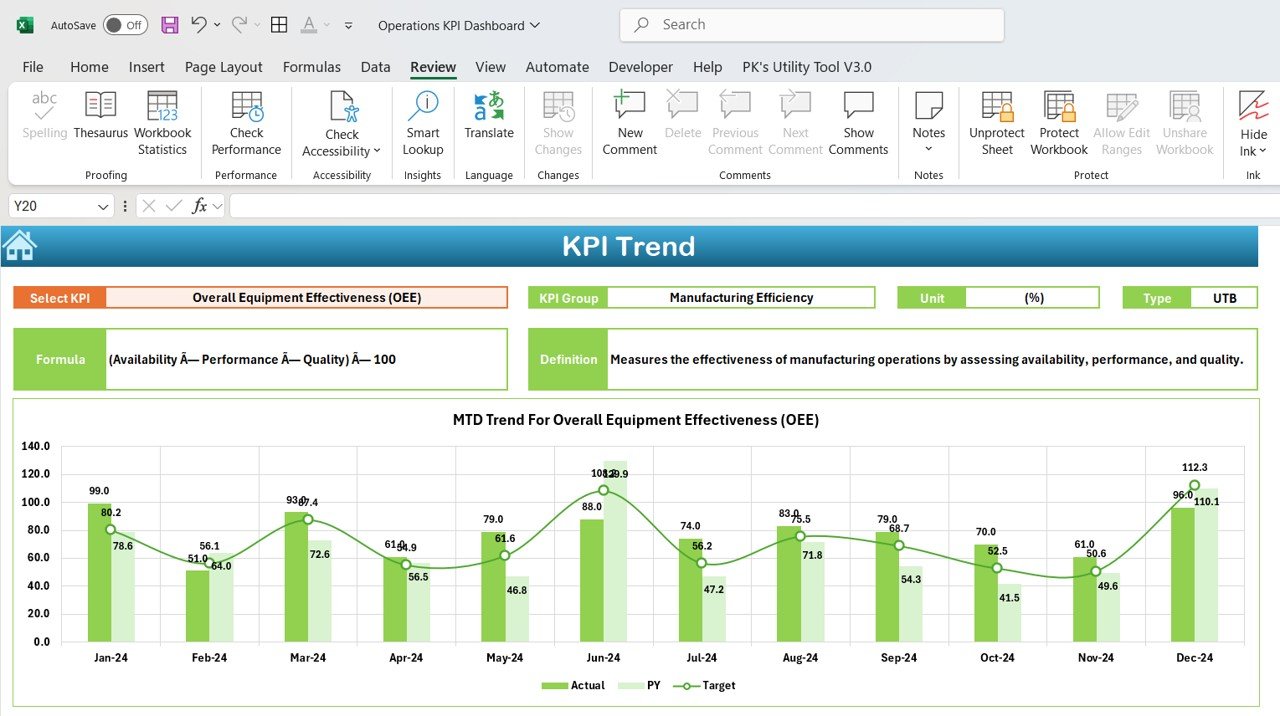
📈 Real-Time Performance Monitoring
Monitor operational performance in real time, ensuring you can react quickly to issues, optimize processes, and maintain a smooth operation.
📅 Month-to-Date (MTD) and Year-to-Date (YTD) Tracking
Track your operational performance across different periods, allowing you to measure improvement, identify trends, and benchmark progress.
🎯 Goal Setting and Performance Comparison
Set specific targets for each KPI and compare actual performance against goals to ensure that your operations are aligned with your business objectives.
🛠 Customizable Inputs
Easily input data such as production volumes, inventory levels, resource utilization rates, and customer feedback, while customizing the dashboard to suit your specific operational needs.
🔔 Conditional Formatting Alerts
Get real-time alerts using color-coded indicators to highlight underperforming areas, such as delayed deliveries, low inventory, or low customer satisfaction.
💼 Operations Insights
Gain deeper insights into the efficiency of your operations by tracking key metrics like resource utilization, production delays, and customer service satisfaction.
🚀 Why You’ll Love the Operations KPI Dashboard in Excel:
✅ Optimize Production Efficiency – Track production output, cycle times, and resource utilization to identify bottlenecks and optimize production efficiency.
✅ Improve Inventory Management – Monitor inventory levels, turnover rates, and order fulfillment to ensure that your supply chain is running efficiently and cost-effectively.
✅ Enhance Customer Service – Track customer satisfaction, support response times, and service levels to improve your overall customer service operations.
✅ Track Resource Utilization – Measure how efficiently your resources, whether human, machine, or material, are being used to maximize productivity.
✅ User-Friendly Interface – Designed for ease of use, this dashboard allows operations professionals to input data and interpret results without needing advanced technical skills.
✅ Fully Customizable – Tailor the dashboard to meet your specific operational requirements, whether you’re tracking production, inventory, logistics, or customer service.
What’s Inside the Operations KPI Dashboard in Excel:
- Production Performance KPI: Track key production metrics, such as output volumes, production cycle times, and machine utilization.
- Inventory Management KPI: Monitor inventory levels, turnover rates, order fulfillment, and stockouts to ensure efficient inventory control.
- Resource Utilization KPI: Measure the utilization of resources such as labor, machinery, and materials to maximize productivity and reduce waste.
- On-Time Delivery KPI: Track delivery performance to measure the percentage of on-time deliveries and identify areas for improvement.
- Customer Service KPI: Measure customer satisfaction, response times, and service levels to ensure high-quality customer support.
- Operational Costs KPI: Monitor operational costs to keep expenses within budget and identify cost-saving opportunities.
How to Use the Operations KPI Dashboard in Excel:
1️⃣ Download the Template – Access your Excel file instantly upon purchase.
2️⃣ Input Your Operational Data – Enter data such as production volumes, inventory levels, and customer service metrics into the pre-designed fields.
3️⃣ Set Operational Targets – Define your KPIs for production, inventory, customer service, and resource utilization to guide your operations.
4️⃣ Track Performance – Monitor your operational performance in real time and make necessary adjustments to improve efficiency and meet your business goals.
5️⃣ Generate Reports – Use the dashboard to generate performance reports for internal reviews, management meetings, or client presentations.
Who Can Benefit from the Operations KPI Dashboard in Excel:
- Operations Managers
- Supply Chain Managers
- Production Managers
- Inventory Managers
- Customer Service Teams
- Business Owners
- Logistics Managers
- Manufacturing Teams
The Operations KPI Dashboard in Excel is the perfect solution for businesses looking to optimize operational efficiency, track key performance metrics, and improve productivity across their operations.
Click here to read the Detailed blog post
https://www.pk-anexcelexpert.com/operations-kpi-dashboard/
Visit our YouTube channel to learn step-by-step video tutorials
Youtube.com/@PKAnExcelExpert


Reviews
There are no reviews yet.