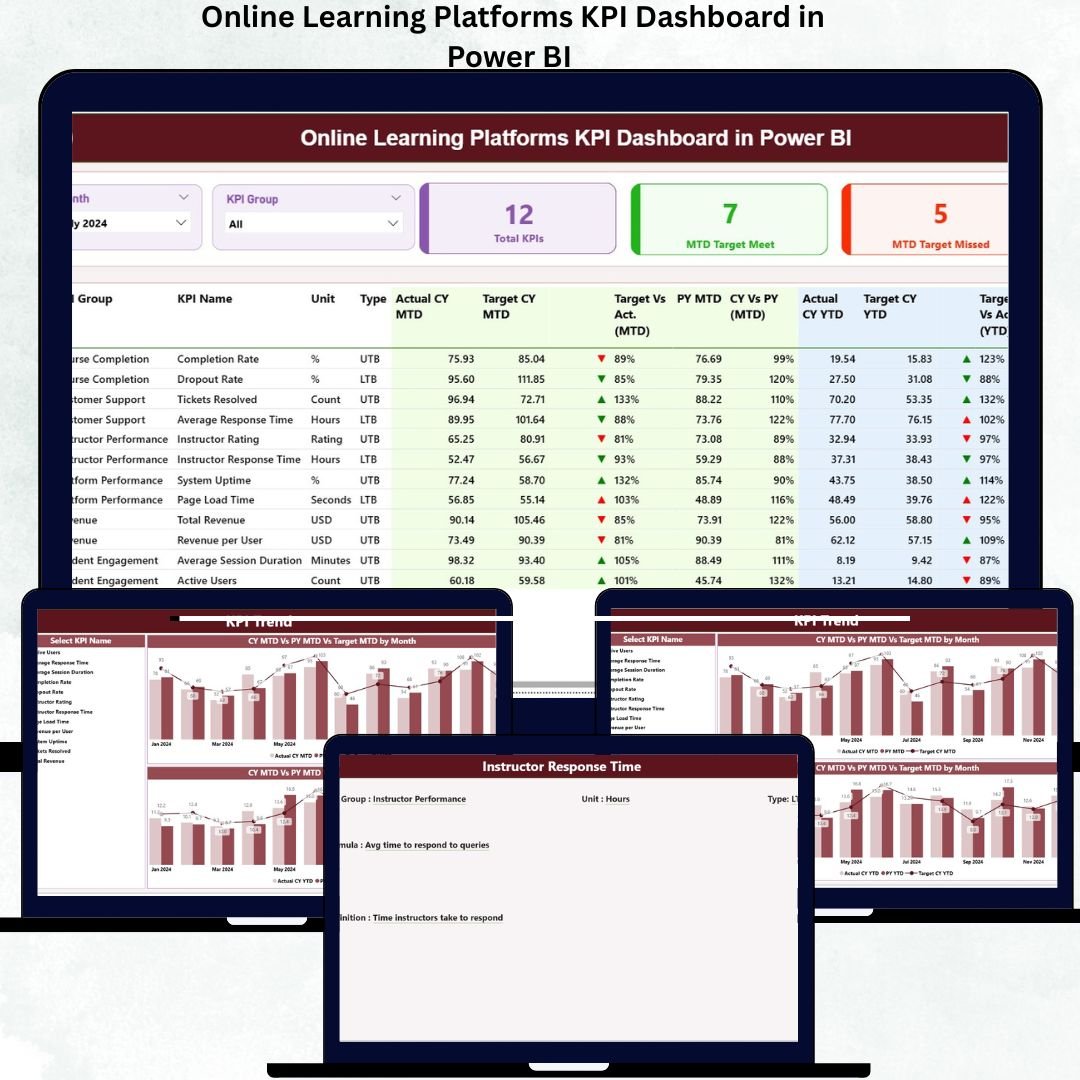
The world of online learning continues to grow rapidly, with more students enrolling in digital courses and more organizations launching their own training platforms. As the industry expands, the volume of data related to enrollment, engagement, revenue, completion rates, instructor performance, and learner behavior grows as well. Without proper tracking tools, this data becomes overwhelming. That’s why the Online Learning Platforms KPI Dashboard in Power BI is a must-have for every eLearning business that wants to make informed, data-driven decisions.
This powerful dashboard helps you monitor student activity, course performance, platform traffic, revenue patterns, category trends, instructor quality, and MTD/YTD progress—all within a clean, interactive Power BI interface. It uses Excel as the data source, making the entire system easy to update, customize, and manage without any coding skills. With its slicers, drill-through features, combo charts, KPI cards, and detailed definitions, this dashboard becomes your complete performance intelligence system.
✨ Key Features of the Online Learning Platforms KPI Dashboard in Power BI
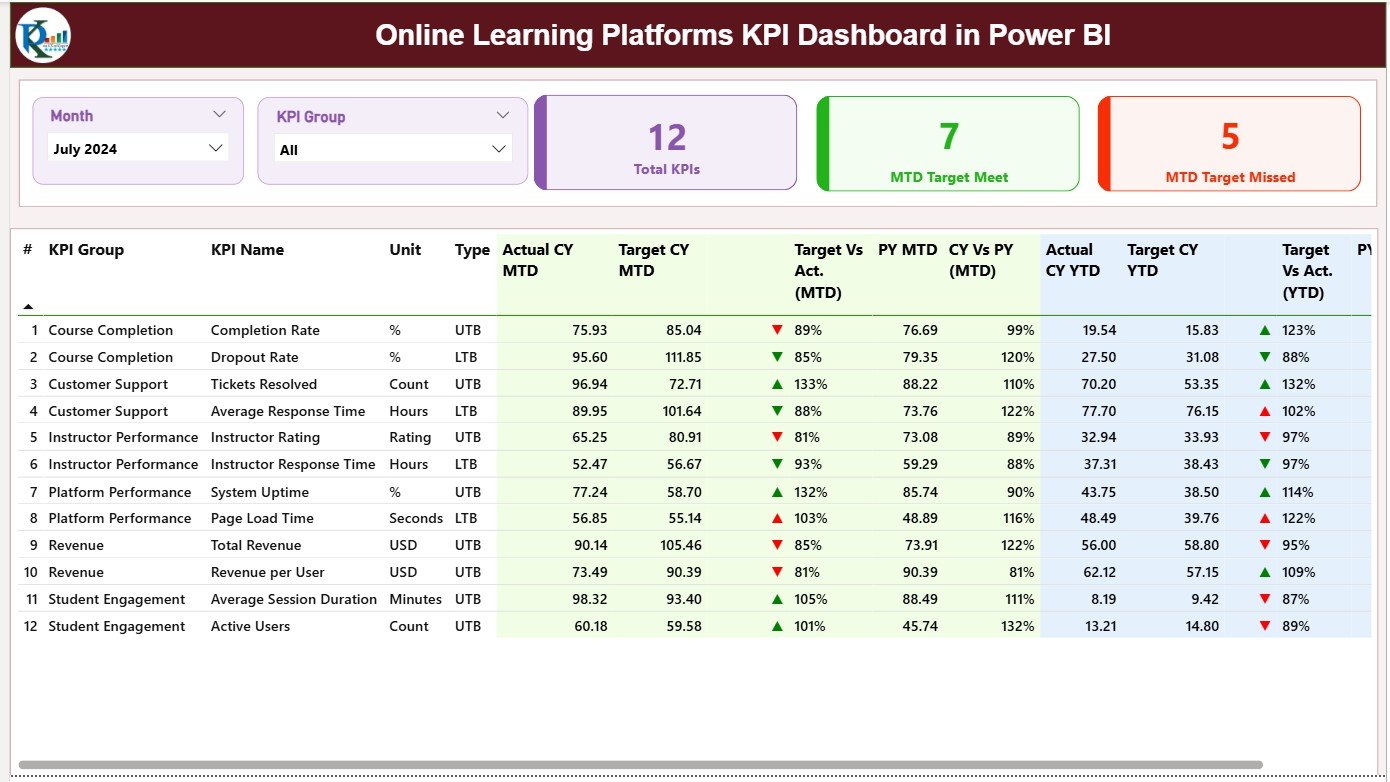
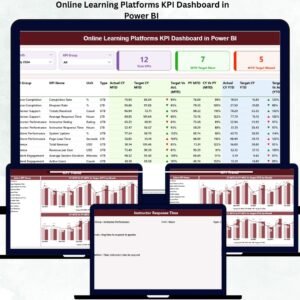
📊 Summary Page – Your All-in-One Control Center
This is the main page where you get a clear snapshot of all KPIs. From target achievements to category-level insights, everything is displayed with beautiful visuals.
-
🔘 Month Slicer & KPI Group Slicer – Switch between months, KPI categories, and performance groups instantly.
-
🟦 KPI Cards – See total KPI count, MTD targets achieved, and MTD targets missed at a glance.
-
📋 Detailed KPI Table – Displays KPI Number, KPI Group, Unit, KPI Type (UTB/LTB), Actual CY MTD, Target CY MTD, MTD Icons, YTD Progress, Previous Year comparison, and more.
-
📈 Visual Indicators – Green ▲ for achieved, Red ▼ for missed—making it easy to evaluate performance instantly.
📘 What’s Inside the Online Learning Platforms KPI Dashboard in Power BI
1️⃣ Summary Page
Your high-level dashboard showing:
-
All KPIs with status icons
-
Actual vs Target MTD & YTD
-
CY vs PY comparisons
-
Category-level insights
Everything is sorted and structured for fast evaluation.
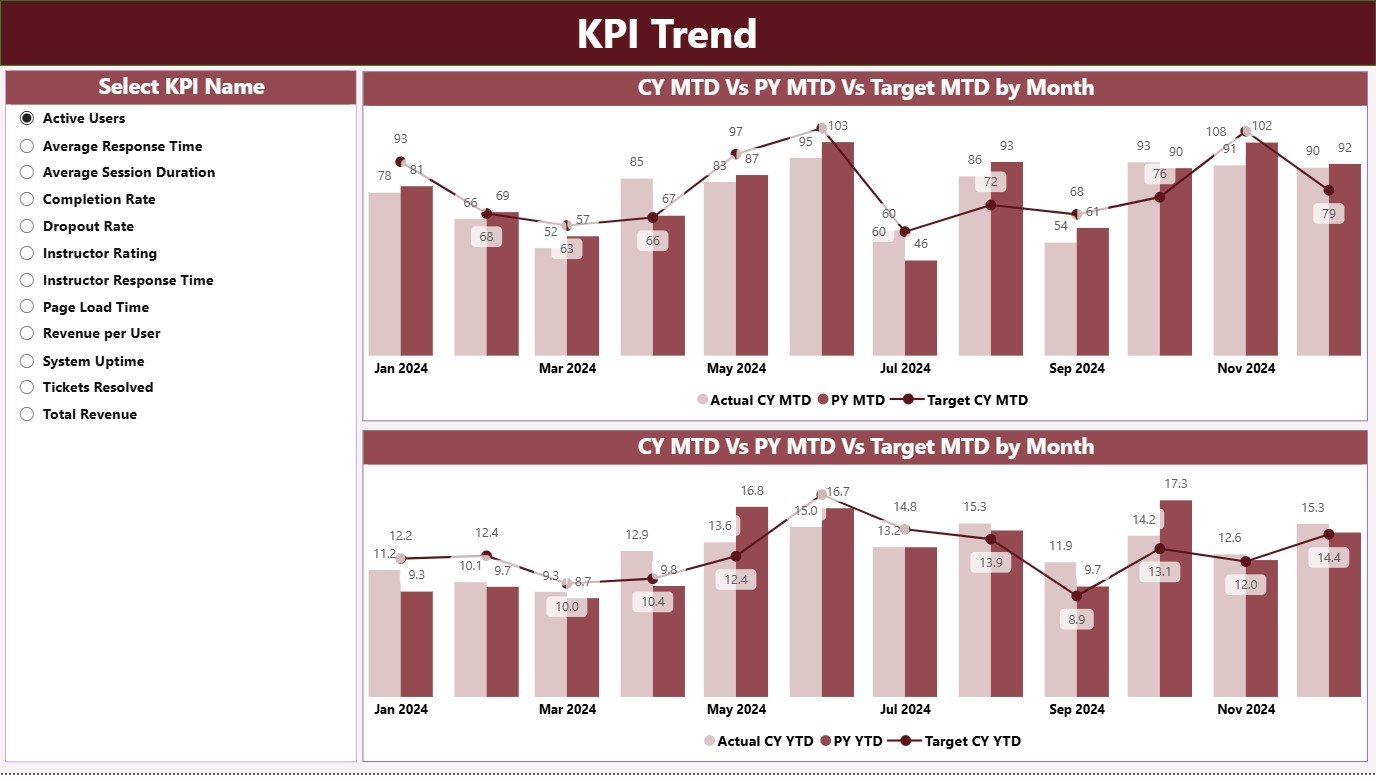
2️⃣ KPI Trend Page
Analyze performance over time using two advanced combo charts:
-
📉 MTD Trend Chart – Actual, Target & Previous Year values every month
-
📈 YTD Trend Chart – Cumulative performance compared across CY, PY & Target
-
🔽 KPI Selection Slicer – Select any KPI to instantly refresh both charts
This helps you understand monthly shifts, long-term patterns, and seasonal performance behavior.
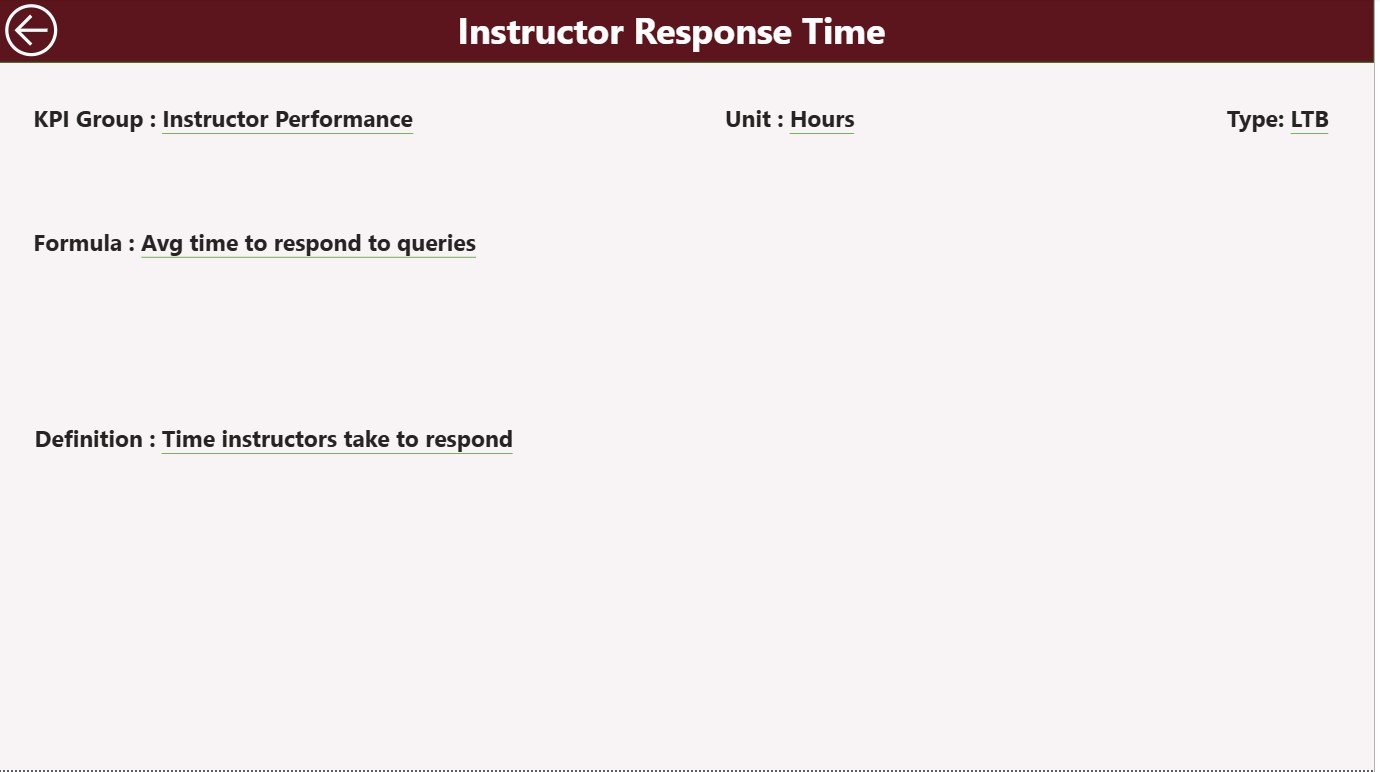
3️⃣ KPI Definition Page
A drill-through page showing:
-
KPI Number
-
KPI Group
-
KPI Name
-
Formula
-
Unit
-
Definition
-
KPI Type (UTB/LTB)
-
⬅ Back button for navigation
This ensures clarity for every KPI used in your dashboard.
🛠 How to Use the Online Learning Platforms KPI Dashboard in Power BI
Step 1: Update Excel Sheets
Update these three sheets regularly:
-
Input Actual – MTD & YTD actual performance
-
Input Target – Monthly & yearly targets
-
KPI Definition – Details for each KPI
Step 2: Refresh in Power BI
After updating your Excel file, click Refresh in Power BI.
The dashboard updates automatically.
Step 3: Explore the Summary Page
Use the slicers to switch months and categories and evaluate KPI performance.
Step 4: Dive into Trend Pages
Analyze MTD and YTD KPI trends to identify performance gaps or improvements.
Step 5: Drill Through for Definitions
Right-click any KPI on the Summary Page → Drill-through → View all KPI details.
🎯 Who Can Benefit from This Online Learning KPI Dashboard
🧑🏫 Online Academies & eLearning Platforms
Track student progress, course enrollments, completions, and satisfaction scores.
🧑💼 Corporate L&D Teams
Measure training effectiveness, instructor performance, and engagement rates.
👩💻 Education Analysts & Reporting Teams
Save hours of manual reporting by using automated KPI charts and tables.
🧑🏫 Tutors & Coaching Institutions
Analyze course-level performance and understand learner patterns.
🧠 EdTech Product Teams
Monitor platform activity, traffic sources, click-through rates, and system-level KPIs.
Anyone who manages education data or learning results will find this dashboard incredibly valuable.


Reviews
There are no reviews yet.